
Analysing the Reliability of Open Source Software Projects
Lerina Aversano and Maria Tortorella
Department of Engineering, University of Sannio, Benevento, Italy
Keywords: Management, Measurement, Documentation, Performance, Design, Reliability.
Abstract: Evaluation of software quality is one of the main challenges of software engineering. Several researches
proposed in literature the definition of quality models for evaluating software products. However, in the
context of Free/Open Source software, differences in production, distribution and support modality, have to
be considered as additional quality characteristics. In particular, software reliability should be taken into
account before selecting software components. In this direction, this paper evolves a quality model for
Free/Open Source Software projects, called EFFORT – Evaluation Framework for Free/Open souRce
projects for including reliability aspects and presents an empirical study aimed at assessing software
reliability and its evolution along the software project history.
1 INTRODUCTION
Adoption of Free/Open Source Software – FlOSS –
represents a concrete solution to support any
business, whatever the size. They offer customized
solutions for enterprises, even with few people that
can be up and running in two or three weeks.
Therefore, the adoption of a FlOSS ERP is very
advantageous for SME (Hyoseob and Boldyreff,
2010), (Wheeler, 2009). As an example, the
possibility of really trying the system (not just using
a demo), reduction of vendor lock-in, low license
cost and possibility of in-depth personalization are
some of the advantages.
Nevertheless, while adopting a FlOSS could
represent an important competitive advantage for a
company, it could be useless or even harmful if the
system does not adequately fit the organization
needs. Then, the selection and adoption of such a
kind of system cannot be faced in a superficial way.
The success and benefits of an OSS system can
be related to many factors expressing software
quality and, specifically, it concerns software
reliability. In particular, in (Raymond, 2001), it is
highlighted that a positive relationship exists
between the number of people involved in a project,
bug numbers, and software project quality.
Many quality models for evaluating FlOSS
systems have been proposed in literature (Kamseu
and Habra, 2009), (OpenBRR, 2005) (Golden,
2005), (QSOS, 2006), (Samoladas et al., 2008),
(Spinellis et al., 2009), (Sung et al., 2007).
Nevertheless, they do not cover all the relevant
aspects of software quality and working context of
the evaluated software systems and are not always
applicable to the specific context. An evaluation of
these models is provided in (Aversano et al., 2010),
and the obtained results highlight that one of the
characteristics that is not evaluated is the Software
Reliability.
This paper extends an existing framework, called
EFFORT – Evaluation Framework for Free/Open
souRce projects – defined for quantitatively
evaluating the quality of FlOSS systems (Aversano
and Tortorella, 2013). The extension regards a more
accurate evaluation of the Reliability characteristic.
The EFFORT framework was already applied with
success for assessing FlOSS ERP Systems
(Aversano et al., 2010b).
The remainder of this paper is organized as
follows: Section 2 describes the related works;
Section 3 reports a description of EFFORT; Section
4 describes the extension of EFFORT for evaluating
the Reliability; Section 5 discusses results obtained
by applying the extended framework to a case study
conducted on an open source ERP system. Finally,
Section 6 presents the conclusions.
2 RELATED WORKS
A lot of work has been done for characterizing and
evaluating the quality of FlOSS projects. Kamseu
and Habra proposed, in (Kamseu and Habra, 2009),
348
Aversano L. and Tortorella M..
Analysing the Reliability of Open Source Software Projects.
DOI: 10.5220/0005519903480357
In Proceedings of the 10th International Conference on Software Engineering and Applications (ICSOFT-EA-2015), pages 348-357
ISBN: 978-989-758-114-4
Copyright
c
2015 SCITEPRESS (Science and Technology Publications, Lda.)
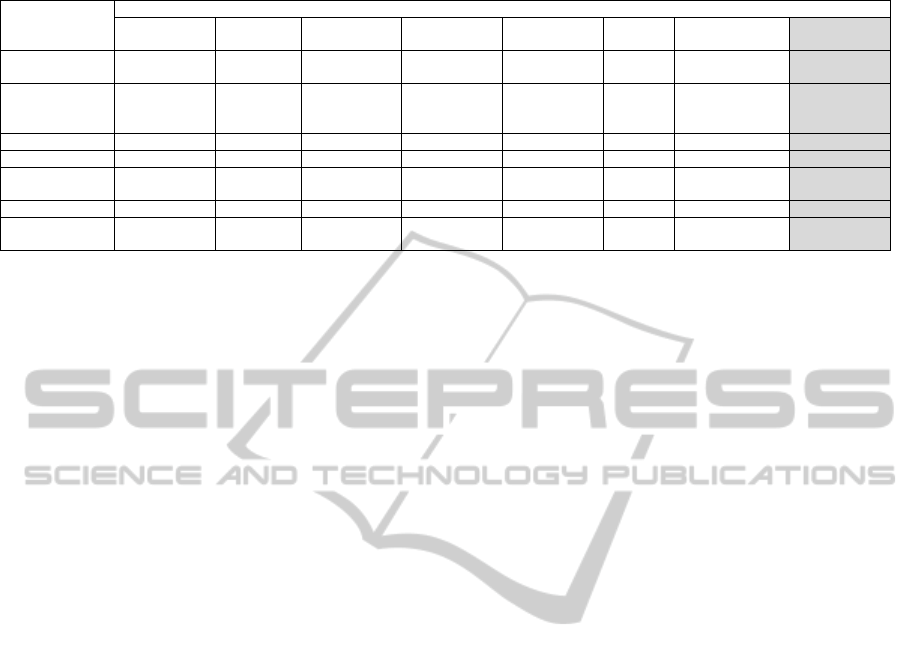
Table 1: Comparison among the proposed quality models with reference to the ISO standard.
ISO/IEC 9126
Q
UALITY MODELS
SQO-OSS
Sung-Kim-
Rhew
IRCA QSOS OpenBRR QualOSS QualiPSo
EFFORT
FUNCTIONALITY
Functionality Functionality
Functional
adequacy
Functionality
Functionality
RELIABILITY
Reliability Reliability
Maturity,
Quality
Assurance
Security
Reliability,
Developer quality
Reliability
USABILITY
Usability Usability Exploitability Usability
Usability
EFFICIENCY
Performance Performance Performance
Efficiency
MAINTAINABILITY
Maintainability
Maintainability/
Longevity
Modularity,
Documentation
Documentation
Maintainability
PORTABILITY
Portability Interoperability Packaging Interoperability
Portability
IN USE QUALITY
Security
As-is utility,
Customer satisfy.
an approach for analyzing the different factors that
potentially influence the adoption of an OSS system.
In (Sung et al., 2007), Sung, Kim and Rhew focused
on the quality of the product adapting ISO/IEC 9126
standard to FlOSS products. Wheeler defined a
FlOSS selection process, called IRCA, based on a
side by side comparison of different software
(Wheeler, 2009). QSOS – Qualification and
Selection of Open Source software – proposes a 5-
steps methodology for assessing FlOSS projects
(QSOS, 2006). The OpenBRR project – Business
Readiness Rating for Open Source – has been
proposed with the same aim of QSOS (OpenBRR,
2005). QualiPSo – Quality Platform for Open
Source Software – is one of the biggest initiatives
related to OSS realized by the European Union (Del
Bianco et al., 2008).
Generally speaking, some models mostly
emphasize product intrinsic characteristics and, only
in a small part, the other FlOSS dimensions. Vice
versa, models have been proposed that try to deeply
consider FlOSS aspects, offering a reduced coverage
to the evaluation of the product.
The models described above were compared
with reference to their compliance to the ISO/IEC
9126 standard, analysing the coverage and features
they had in common. Table 1 shows the results of
the analysis. A standard characteristic was
considered as covered by a model if it took into
account at least one of its attributes. Table 1 shows
that not all the models considered take into account
the ISO standard quality characteristics. The highest
coverage is exhibited by IRCA, but it does not
provide an adequate operational tool for its
application. The table also shows that the in-use
quality is the least-considered quality characteristic.
This is due to the difficulty of objectively measuring
the metrics related to in-use quality, because they
greatly depend on the user. The figure also shows
the EFFORT – Evaluation Framework for
Free/Open souRce projects – framework defined for
overcoming the limitations of the other quality
models. The comparison of EFFORT with the other
quality models highlights that it covers the main
quality characteristics and, in addition, it provides
working support for applying the framework.
Regarding the specific context of ERP systems,
different collections of criteria for evaluating an
Open Source System were proposed. Some
approaches generically regard ERP systems, other
ones are specifically referred to FlOSS ERPs.
Birdogan and Kemal propose an approach for
identifying and grouping the main criteria for
selecting an ERP system (Birdogan and Kemal,
2005). Evaluation-Matrix (http://evaluation-
matrix.com) is a platform for comparing
management software systems. Open Source ERP
Guru (http://opensourceerpguru.com/2008/01/08/10-
evaluation-criteria-for-open-source-erp/) is a web
site offering a support to the users in the
identification of an ERP open source solution to be
adopted in their organization. Reuther and
Chattopadhyay performed a study for identifying the
main critical factors for selecting and implementing
an ERP system to adopt within a SME (Reuther and
Chattopadhyay, 2004). This research was extended
by Zirawani, Salihin and Habibollah, that reanalyzed
it by considering the context of FlOSS projects
(
Zirawani et al., 2009). Wei, Chien and Wang defined
a framework for selecting ERP system based on the
AHP – Analytic Hierarchy Process – technique.
(Wei et al., 2005)
The analyzed models result to be quite
heterogeneous, but they have the common goal of
identifying critical factors for the selection of ERP
systems. The Birdogan and Kemal model is the most
complete one. Criteria considered from the highest
number of models regard functionality, usability and
costs, followed by support services, system
reliability and customizability.
AnalysingtheReliabilityofOpenSourceSoftwareProjects
349
This paper considers all the analysed limitations
of the previously proposed quality models and uses
them for enhancing the EFFORT framework. In
particular, not all the quality models adequately
consider the Reliability characteristic. Therefore, the
EFFORT framework was evolved for considering
that aspect.
3 BACKGROUND
EFFORT is a framework defined for evaluating the
quality of FlOSS systems (Aversano et al., 2010). It
can be considered as a base framework to be
specialized to a specific working context. EFFORT
has been defined on the basis of the GQM – Goal,
Question, Metrics – paradigm (Basili et al., 1994).
This paradigm guides the definition of a metric
program on the basis of three abstraction levels:
Conceptual level, referred to the definition of the
Goals to be achieved by the measurement activity;
Operational level, consisting of a set of Questions
facing the way the assessment/achievement of a
specific goal is addressed; and Quantitative level,
identifying a set of Metrics to be associated to each
question.
The GQM paradigm helped defining a quality
model for FlOSS projects and a framework to be
effectively used during the evaluation of a software
system. It considers the quality of a FlOSS project as
synergy of three main elements: quality of the
product developed within the project;
trustworthiness of the community of developers and
contributors; and product attractiveness to its
specified catchment area.
The model includes a hierarchy of attributes. In
correspondence to each first-level characteristic, one
Goal is defined. Then, the EFFORT measurement
framework includes three goals regarding: Product
quality, Community Trustworthiness and Product
Attractiveness. Questions, consequentially, map the
second-level characteristics, even if, considering its
complexity and the amount of aspects to be
considered, Goal 1 has been broken up into sub-
goals.
The following subsections summarily describe
each goal, providing a formalization of the goal
itself, incidental definitions of specific terms and list
of questions. The listed questions can be answered
through the evaluation of a set of associated metrics.
For reason of space, the paper does not list the
metrics, even if some references to them are made in
the final subsection, which discusses how the
gathered metrics can be aggregated for
quantitatively answering the questions. A full
description of the framework can be found in
(Aversano and Tortorella, 2013).
3.1 Product Quality
One of the main aspects that denotes the quality of a
project is the product quality. It is unlikely that a
product of high and durable quality has been
developed in a poor quality project. So, all the
aspects of the software product quality have been
considered in the framework, as defined by the
ISO/IEC 9126 standard (ISO, 2004), (ISO, 2005).
Goal 1 is defined as follows: Analyze the
software product with the aim of evaluating its
quality, from the software engineer’s point of view.
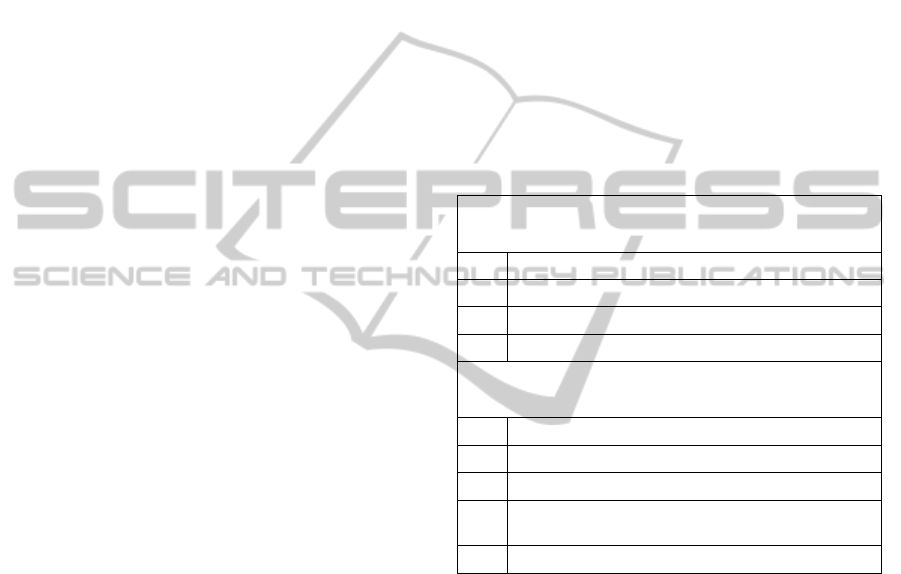
Table 2: Some sub-goals of the Product Quality.
Sub-goal 1a: Analyze the software product with the aim of
evaluating it as regards the portability, from a software
engineering’s point of view
Q 1a.1 What degree of adaptability does the product offer?
Q 1a.2 What degree of installability does the product offer?
Q 1a.3 What degree of replaceability does the product offer?
Q 1a.4 What degree of coesistence does the product offer?
Sub-goal 1b: Analyze the software product with the aim of
evaluating it as regards the maintainability, from a software
engineering’s point of view
Q 1b.1 What degree of analyzability does the product offer?
Q 1b.2 What degree of changeability does the product offer?
Q 1b.3 What degree of testability does the product offer?
Q 1b.4
What degree of technology concentration does the
product offer?
Q 1b.5 What degree of stability does the product offer?
Almost all the attributes of the questions
reference regard the ISO 9125 standard. This goal is
analyzed by considering different six sub-goals
concerning: portability, maintainability, reliability,
functionality, usability, and efficiency. For reasons
of space, Table1 just shows the first two sub-goals
and related metrics.
3.2 Community Trustworthiness
With Community Trustworthiness, it is intended the
degree of trust that a user can give to a community,
about the offered support. Support can be provided
by communities by means of: good execution of the
development activities; use of tools, such as wiki,
forum, trackers; and provision of services, such as
maintenance, certification, consulting and
outsourcing, and documentation.
ICSOFT-EA2015-10thInternationalConferenceonSoftwareEngineeringandApplications
350
Goal 2 is defined as follows: Analyze the offered
support with the aim of evaluating the community
with reference to the trustworthiness, from the
(user/organization) adopter’s point of view.
Table 3 shows the set of questions related to
Goal 2.
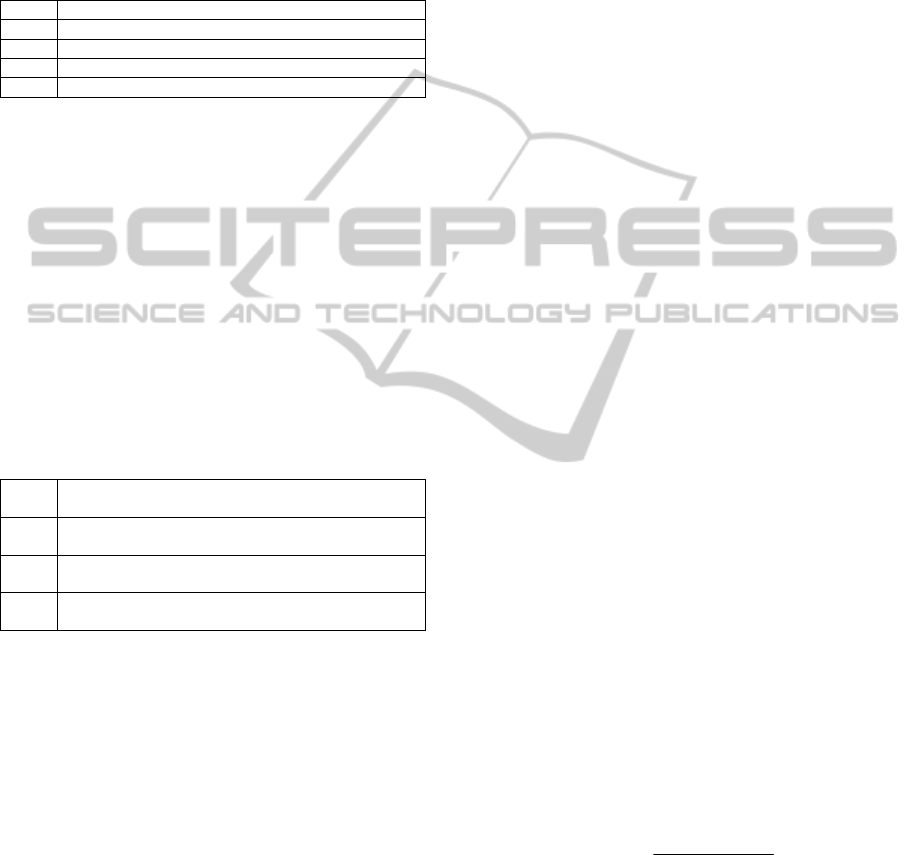
Table 3: Questions regarding Community Trustworthiness.
Q 2.1 How many developers does the community involve?
Q 2.2 What degree of activity has the community?
Q 2.3 Support tools are available and effective?
Q 2.4 Are support services provided?
Q 2.5 Is the documentation exhaustive and easily consultable?
3.3 Product Attractiveness
The third goal has the purpose of evaluating the
attractiveness of the product toward its catchment
area. The term attractiveness indicates all the factors
that influence the adoption of a product by a
potential user, who perceives convenience and
usefulness to achieve his scopes.
Goal 3 is related to product attractiveness and it
is formalized as follows: Analyze software product
with the aim of evaluating it as regards the
attractiveness from the (user/organization)
adopter’s point of view.
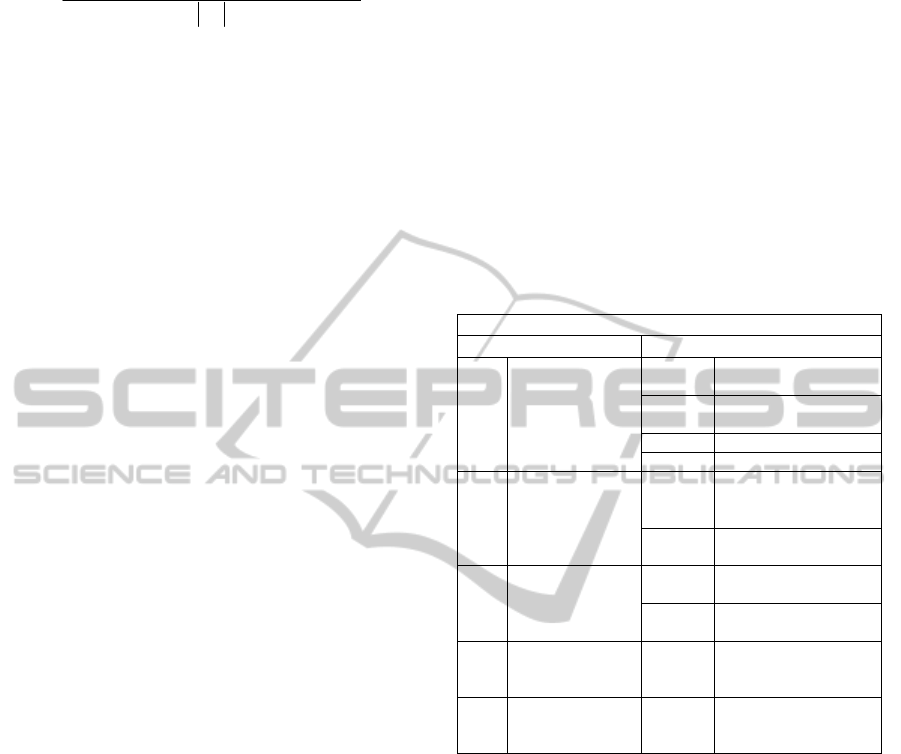
Table 4: Questions regarding Product Attractiveness.
Q 3.1
What degree of functional adequacy does the product
offer?
Q 3.2 What degree of diffusion does the product achieved?
Q 3.3 What level of cost effectiveness is estimated?
Q 3.4
What degree of reusability and redistribution is left by
the license?
Two elements that have to be considered for
evaluating a FlOSS product are functional adequacy
and diffusion. The latter could be considered as a
marker of how the product is appreciated and
recognized as useful and effective. Other factors that
can be considered are cost effectiveness, an
estimation of the TCO (Total Cost of Ownership)
(Kan et al., 1994), and type of license. This aspects
are considered for formulating the questions of Goal
3 listed in Table 4.
3.4 Data Analysis
Once data have been collected by means of metrics,
they cannot be directly aggregated and compared
because they have different scales. Then, it is
necessary to normalize them. The paper uses the
min-max normalization and the values have been
mapped to one-five scale. The guidelines for
choosing the mapping ranges have been defined on
the basis of the experience and information coming
from the literature. This approach makes to lose the
granularity of the information, but it is needed if a
comparison is required. A more punctual evaluation
can be performed by considering the effective values
of the metrics. Therefore, the normalized values are
aggregated, according to the interpretation of the
related metrics, so that one can obtain useful
information for answering the questions. In
particular, the following issues needs to be
considered:
• Metrics have different types of scale, depending
on their nature. Then, it is not possible to directly
aggregate measures. To overcome this limitation,
after the measurement is done, each metric is
mapped to a discrete score in the [1-5] interval,
where: 1 = inadequate; 2 = poor; 3 = sufficient; 4
= good; and, 5 = excellent. The mapping of the
metrics to the range values has been defined on
the basis of study of the literature and previous
experiences.
• A high value for a metric can be interpreted in a
positive or a negative way, according to the
context of the related question; even the same
metric could contribute in two opposite ways for
answering two different questions. So, the
appropriate interpretation is given for each
metric.
Questions do not have the same relevance in the
evaluation of a goal. A relevance marker is
associated to each metric in the form of a numeric
value in [1,5] interval. These markers are selected on
the basis of the relevance that the current literature
gives to the different quality attributes. They can be
modified also considering the exigencies and
suggestion of the involved organization. Generally
speaking, Value 1 is associated to questions with
minimum relevance, while value 5 means maximum
relevance. The aggregation function for Goal g is
defined as follows:
()
()
∈
∈
=
q
q
Qid
id
Qid
id
r
idmr
gq
*
(1)
where:
- r
id
is relevance associated to question id (sub-
goal for goal 1);
- Q
g
is the set of questions (sub-goals for goal 1)
related to goal g.
- m(q) is the aggregation function of the metrics of
question q:
AnalysingtheReliabilityofOpenSourceSoftwareProjects
351
(2)
where v(id) is the score obtained for metric id
and i(id) is its interpretation. In particular:
i(id) =
{
0 if the metric has negative interpretation
(3)
1 if the metric has positive interpretation
and M
q
is the set of metrics related to question q.
4 ANALISYS OF SOFTWARE
SYSTEM RELIABILITY
This section describes the changes that have been
introduced in EFFORT for evaluating some
elements that characterize the reliability of a
software system. Specifically, as it is described in
the following, the main characteristics that have
been taken into account for the analysis, regard the
assessment of the external quality, community and
short-term support offered by the developers. Then,
the study focused on the analysis of the available
data project, regarding bugs, patches and releases.
Specifically, the fundamental aspects observed by
the EFFORT framework have been investigated and
expanded with some factors that were not previously
considered. In particular, the analysis presented in
this paper analyses the following parameters:
External Quality Evaluation of the Products.
It considered:
• Bugs, representing a failure of a program or
mistake in writing the code that causes a failure
or unexpected behaviour, and, sometimes the
complete failure of the application;
• Patches, a term that indicates a file created to
solve a specific programming error (bug) that
prevents the functionality of the system.
Community Activities. It considers:
• Developers, for analysing and understanding
how the developers are divided within the
SourceForge communities and grouped on the
basis of the workload and level of stability of the
software projects.
• Releases, for analysing the evolution of the
software projects. This helped to understand if
the new release indicates an improvement,
renovation, modification, etc., in the software
project.
• Downloads, for analysing the number of
downloads of a considered OSS project. This
analysis could be useful for understanding how
users approach the open source products, and if
they "prefer" to use and, then, download, newer
products (in prealpha, alpha or beta state) or to
rely on safe products (in stable or mature state).
Short-term Support:
• Time allocation of the bug, analysing this aspect
is useful for understanding how the community
is timely to respond and try to correct a problem.
• Time resolution of the bug, analysing whether a
community is quick to fix bugs, if there is a team
that is dedicated to the software project or it is
just a work done as a "hobby."
Table 5: Questions and metrics integrated in EFFORT.
EFFORT Integration
Questions Metrics
Q 1c.1 What degree of
robustness provides
software?
M 1c.1.7 Average number of bugs
per year
M 1c.1.8 Index of bugs with
priority 9
M 1c.1.9 Index of open bugs
M 1c.1.10 Index of fixed bugs
Q 2.1 How big is the
developer
community?
M 2.1.2 Number of developers
with at least one bug
assigned
M 2.2.6 Index of not considered
bugs
Q 2.2 What is the degree
of activity of the
community?
M 2.2.7 Index of not assigned
bugs
M 2.3.10 Number of support
requests
Q 2.3 Are Support tools
available and
effective?
M 2.3.11 Number enhancement
requests
Q 3.2 What is the
diffusion degree of
the product?
M 3.2.12 No. of downloads from
sourceforge in the last
quarter
Integrating these aspects in EFFORT has
required adding to the questions new metrics, not
considered in the basic framework. Table 5 lists the
questions affected by this customization, together
with the metrics that have been added. With
reference to sub-goal 1.c, regarding Robustness, the
inserted metrics go from metric M 1c1.7 to metric M
1c1.10. In particular, they are intended to measure
the incidence of bugs on the software. Regarding
Goal 2, concerning Community Trustworthiness,
metrics have been added for analyzing the behaviour
of the community with reference to the bug
management. In particular, metric M 2.1.2 has been
considered for understanding if bugs are assigned to
developers, metrics M 2.2.6 and M 2.2.7 have been
inserted for analyzing how many bugs are not
considered and/or not assigned and, then,
understanding the community activity, and metrics
M 2.3.10 and M 2.3.11 are added for verifying the
() () ()
[]
()
[]
q
Mid
M
idvidiidvidi
qm
q
}6mod*1*{
)(
∈
−+
=
ICSOFT-EA2015-10thInternationalConferenceonSoftwareEngineeringandApplications
352

support tools with reference to the enhancement
requests. Finally, with reference to the
Attractiveness of the project, and the question
related to the diffusion degree of the product, metric
M 3.2.12 has been added for considering the
integrated number of downloads made in the last
quarter of the analysed timeline. This metric very
important as it shows the interest degree that the
project community has with reference to the
considered software project.
Furthermore, the EFFORT framework has been
extended with the addition of a new question.
Specifically, Table 6 reports this kind of extension.
The added question has been defined with reference
to Goal 2. It is related to the level of efficiency of
the developers in relation to the bug resolution.
Metrics M 2.6.1 and M 2.6.2 are evaluated in terms
of days and represent the reactivity of the
community developers to the errors. The last two
metrics are related to the developer activity in the
context of the bug management.
Table 6: Question and related metrics added to the
framework.
EFFORT Extension
Questions Metrics
Q 2.6 What is the
degree of
efficiency of the
developers with
reference to the
b
ug resolution
activities?
M 2.6.1 Average number of days for
bug resolution
M 2.6.2 Average number of days for
b
ug assignment to at least
one developer
M 2.6.3 Average number of bug
assigned to each developer
M 2.6.4 Number of active developers
5 CASE STUDY
Assessing the effectiveness of the changes
introduced in the EFFORT framework required the
execution of a case study on a relevant open source
ERP (Enterprise Resource Planning) project.
Compiere (www.compiere.com) has been
considered system. It is widely used in small and
medium enterprises. A description of the planning of
the analysis and achieved results follows.
The obtained quality results are different from
those ones achieved by applying the previous
version of EFFORT and published in (Aversano and
Tortorella, 2013). This is due to the more accurate
evaluation depending on the larger quantity of data
that have been considered for performing it.
In the next subsection, the planning of the
analysis will be described. Then, the subsequent
subsections provide a discussion concerning the
performed bug analysis and evaluated quality of the
selected project.
5.1 Planning of the Analysis
Data for conducting the analysis have been extracted
from the Notre Dame database. This database is
hosted by the University of Notre Dame and
includes data for 563.290 open source projects.
In order to make the assessment as most reliable
as possible, all the found information have been
collected and considered during the analysis. During
the planning phase, the software project Compiere,
to be analyzed in a major detail, was chosen among
the most relevant available projects. Issues, such as
the programming language, were considered to
facilitate the metrics collection.
To obtain reliable results many websites were
consulted. The most important and useful ones were:
Sourceforge, a web resource useful for gathering
quantitative data regarding the download and
development of open source projects.
Freshmeat, a website that offers information
about the popularity and activities carried out on a
selected project.
Openhub, a public directory of open source
projects and related developers, where it is possible
to find the results of analyzes, reports and
comparisons on demographic trends of the software.
It also provides information on the issued license
and number of committers and performs code
analysis.
As previously stated, the selected project is
Compiere, an ERP solution including also a
customer relationship management (CRM)
component. It was designed for small and medium-
sized businesses, government agencies and non-
profit organizations. This system is distributed and
supported by Compiere, Inc. and the Compiere
Partner Network, a group of certified partners. The
software source code is released under the GPL v2,
as Community Edition. There are also three other
editions Standard, Professional and Enterprise. They
are issued on an annual subscription basis for a fee
and, in the case of the Professional and Enterprise
editions, with commercial license. The various
issues differ for the offered support, but there are
differences also in terms of services, documentation,
functionality, provided updates and upgrades.
5.2 Bug Analysis
The first development of this project dates back to
1999, but only since June 2001, it is available on
AnalysingtheReliabilityofOpenSourceSoftwareProjects
353
Sourceforge under the name “Compiere ERP +
CRM Business Solution”. Since its birth, bugs were
reported. A suitable query submitted to Wiki Notre
Dame returns a number of “defects” equals to 8387.
A careful analysis indicates that the query
considered:
- 2717 Bugs;
- 49 Contributions;
- 104 Documentation Requests;
- 740 Feature Requests;
- 67 Patches;
- 4710 Support Requests
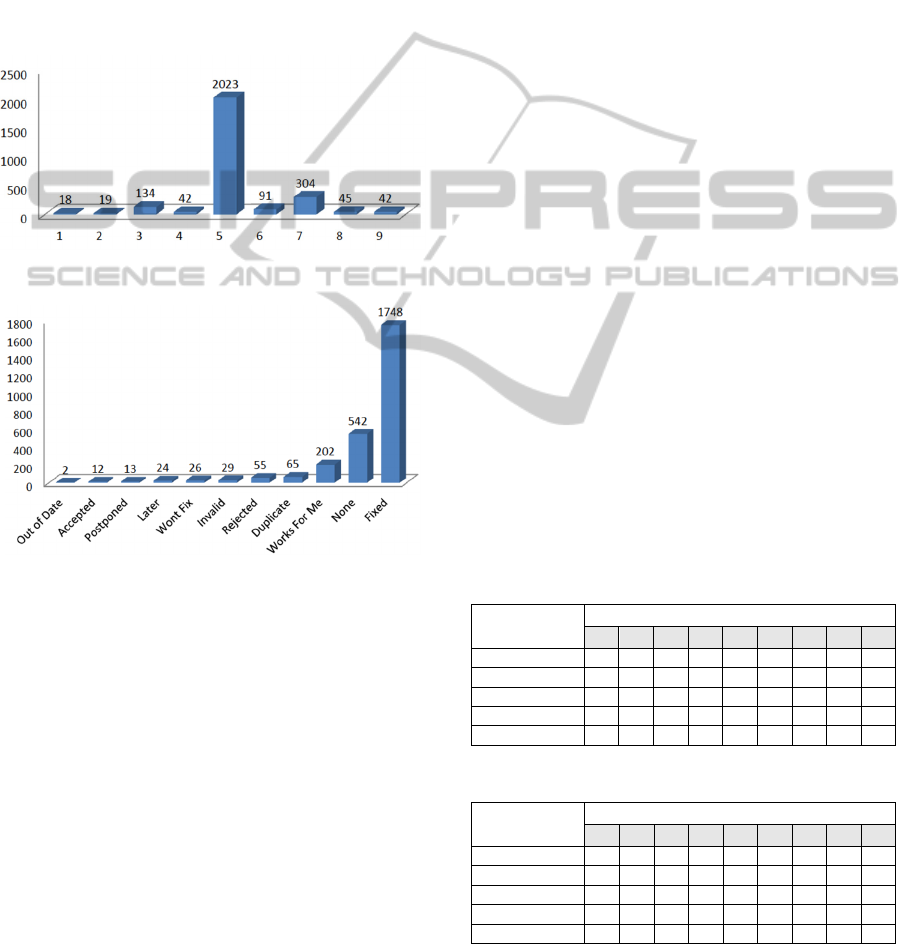
Figure 1: Compiere bug distribution for different priority.
Figure 2: Bugs of Compiere for the different state.
Figure 1 shows the distribution of the bugs with
reference to the priority, shown on the horizontal
axis. It indicates that most of the bugs has priority 5,
and this is justified by the fact that level 5 is the
level of priority assigned by default from
Sourceforge. This should indicates that the bugs
priority level is not always specified. If we consider
the other priorities, it is noteworthy to observe that
the bugs that have the higher priorities are more than
those with the lower priorities, especially if level 7,
with 304 bugs, is considered.
By performing an analysis on the number of
open bugs, the following results are obtained:
- Closed 2673
- Deleted 36
- Open 9
Figure 2 shows the distribution of the bugs for
their states at the date the data have been collected.
It suggests that Compiere has not only a low number
of bugs, but it also has a very small number of open
bugs. It can be noticed from Figure 2 that the
number of bugs that are in the state Accepted is
greater than that one of the bugs which are Open.
This difference is due to the number of bugs that
have been accepted but not yet assigned to any
developer.
At this point, we passed to analyze the average
time for resolution of the bugs. This is particularly
important for understanding the behaviour of the
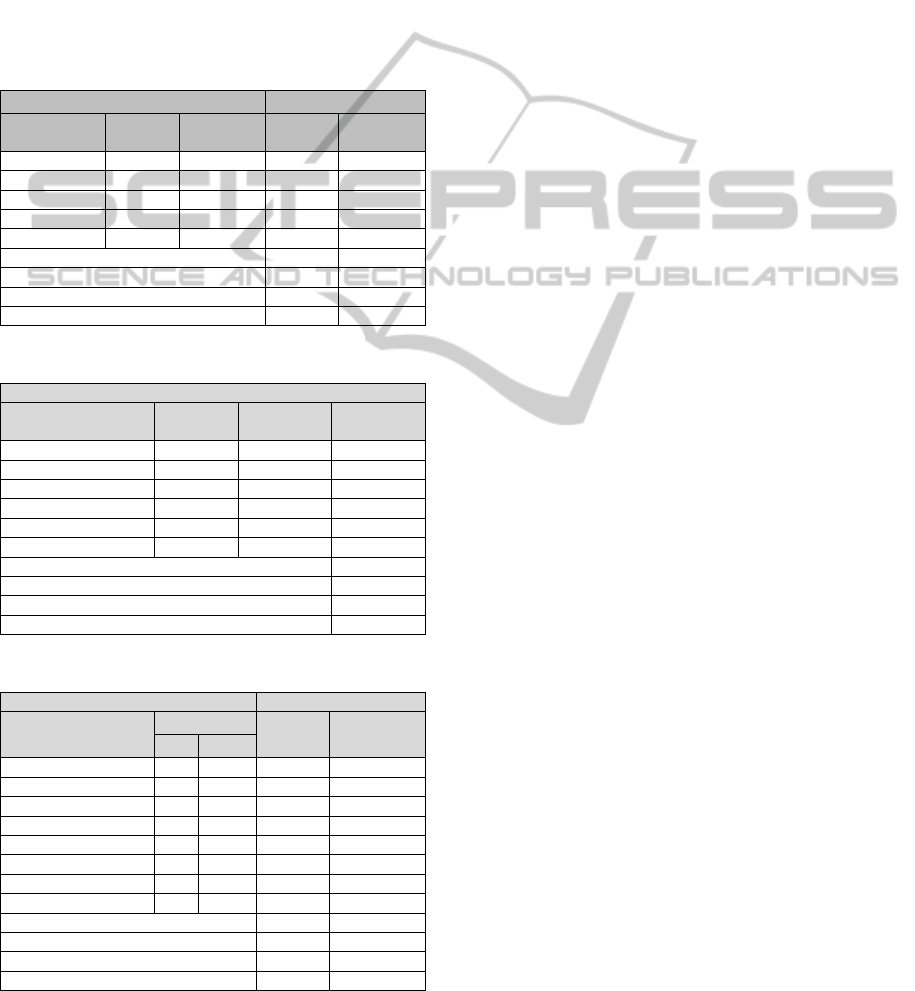
community. Table 7 reports the medium value of the
resolution time, measured in days, for the analysed
project with reference to the levels of priority and
state of the project, on the basis of the data collected
in Sourceforge. Table 7 shows that the resolution
time decreases, as the bug priority increases, and this
is something to be expected. Moreover, it is possible
to observe that the resolution time increases when
the project is stable and mature and this is justified
by the higher complexity of the project at that level
of maturity.
Then, it has been performed an analysis aimed at
investigating the behaviour of the community,
especially to identify the bugs discovered and not
yet assigned to any developer. It has been observed
that in Compiere 570 bug are unassigned and 2148
bugs are assigned to at least one developer. While,
the number of developers assigned to at least one
bug is 19.
Overall, Table 8 reports the average time,
expressed in days, to assign a bug to at least one
developer.
Table 7: Resolution time in days for bugs observed in
Compiere.
Project State Bug Priority
1 2 3 4 5 6 7 8 9
Prealpha 177 186 227 161 145 107 110 77 98
Alpha 165 143 141 123 104 92 96 78 74
Beta 167 149 147 147 112 102 96 70 70
Stable 86 169 161 162 118 128 122 102 93
Mature 181 213 178 236 115 158 141 148 97
Table 8: Average time to assign a Bug in Compiere.
Project State Bug Priority
1 2 3 4 5 6 7 8 9
Prealpha 95 107 105 75 88 56 59 48 39
Alpha 55 80 67 62 62 44 65 59 54
Beta 49 81 66 68 60 54 72 48 35
Stable 34 82 85 83 74 72 75 56 58
Mature 60 114 105 92 72 80 90 86 82
It can be noticed how the assignment time is kept
nearly constant for each bug priority, regardless the
project state. A shorter time is used for assigning the
ICSOFT-EA2015-10thInternationalConferenceonSoftwareEngineeringandApplications
354
bugs with priorities 9 and 1. The quick assignment
of bugs with priority 9 was expected, while the one
regarding the bugs with priority 1 was perhaps due
to the ease to find a solution. The allocation time for
all the degrees of maturity of the product, is higher
when the software is mature. This can be caused by
the complexity and criticality of the bugs, and this
generally makes the resolution complex and needing
more experienced developers, who are not always
active.
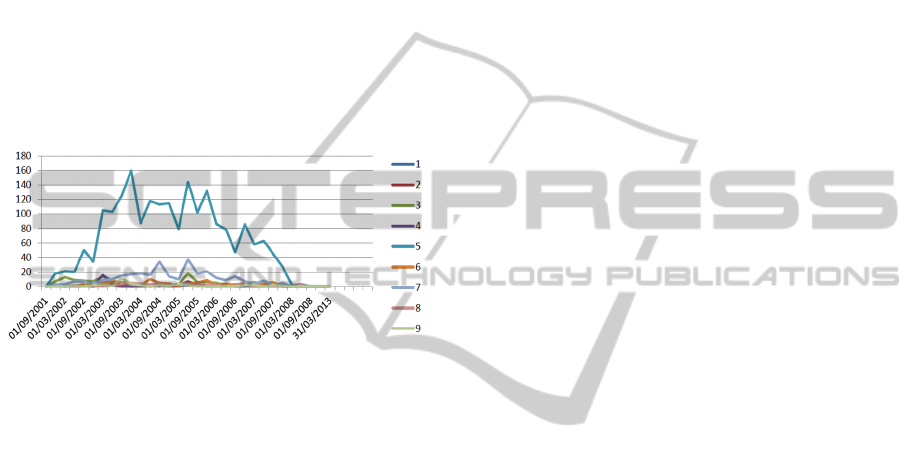
The next phase of the analysis aimed at
investigating the number of bugs over the timeline
of the project. The number of bugs were identified in
the time period going from the publication date in
the Sourceforge project (June 2001), to the analysis
date (March 2013), with a quarterly sampling.
Figure 3: Number of bugs in Compiere during its life
cycle.
Figure 3 graphically represents the distribution
of the bugs over the life cycle of the project. The
figure shows that, starting from 2008, there is not
any presence of bugs. This caught our attention and
requested a more detailed study. From the website it
emerged that the project with the name "Compiere
ERP + CRM Business Solution" is still present today
on Sourceforge, but the last change has been made
on 19
th
January 2010. This was not a relevant change
and was not related to a detected bug. In fact, the
Compiere project had suffered problems from the
evolutionary point of view from 2008, because there
were discrepancies between the Compiere inc. and
the development community. From this point, a
number of forks have been generated for obtaining a
new projects based on Compiere. Taking into
account some documents, it was possible to
understand a little 'more of the history of this
project: Compiere, written entirely in Java, was born
in 1999 thanks to Jorg Janke; in the past it was
considered the ERP and CRM system most widely
used, so much that in 2008, there were more than 1.5
million downloads and more than 100 partners. In
2006 the company Compiere inc. detected a
significant capital from the New Enterprise
Associates with the aim of increasing the success of
the ERP project and turned the project into a
commercial software. In 2007 the company changed
its corporate structure by adding new managers,
engineering a renewed and expanded its sales
channels and services; the product line was
expanded to include Compiere Professional Edition
and Enterprise. As with many commercial
enterprises system built around open source
products, there was a dispute between the
management company, who was trying to monetize
investments, and the community of Fulfilment, who
wanted to leave free and open the source code. On
June 16
th
, 2012 Compiere was acquired.
The previous analysis suggested we explore the
history of the open source project under
consideration.
5.3 Quality Analysis
Besides the data discussed above, the additional
aspect considered in the EFFORT framework have
been taken into account. Specifically, numerous
other elements have been considered for assessing
the quality of the software project, and, in particular:
–
analysis of data on official web sites and wiki
projects,
–
analysis of the source code,
–
installation and use of the software,
–
analysis of the official forums,
–
analysis of the tracker,
–
analysis of the documentation,
–
analysis of data on the sourceforge site, Openhub
and freshmeat
–
detailed analysis of the bug;
–
analysis of the patch
–
analysis of the release
–
analysis on the community
It was decided to use two levels of relevance for
aggregating the values of the metrics:
–
one considering the weights that arise from the
open source nature of the project, indicated as
relevance OSS in the result tables;
–
one considering the weights due to the
characteristics of the ERP systems, indicated in
the table as relevance ERP.
Tables 9, 10 and 11 indicate the obtained results.
The General column contains the results obtained by
considering the OSS relevance, and the Customized
column the results achieved by applying the ERP
relevance.
AnalysingtheReliabilityofOpenSourceSoftwareProjects
355
Product Quality Results
Table 9 shows the results of the product quality
assessment of Compiere. The data aggregated for the
questions related to the product quality goal are
reported in the table, together with those concerning
the sub-goals, evaluated as the arithmetic means of
the values obtained for the related questions. In
correspondence of each sub-goal, the table reports
the results of the: weights of the OSS relevance;
weights of the ERP relevance; generalized and
customized version of the framework.
Table 9: Product quality results.
Quality characteristics Compiere
Name
OSS
Relevance
ERP
Relevance
General Customized
Portability 3 2 4,25 3,72
Mantainability 3 4 2,97 2,97
Reliability 3 5 4,65 4,53
Functionality 5 5 4,13 3,96
Usability 4 4 3,26 3,26
Unweighted average 3,85 3,69
Weighted average for OS 3,85 3,69
Weighted average for ERP 3,74
Weighted average for OS + ERP 3,72
Table 10: Community Trustworthiness results.
Support sub-characteristics
Name
OSS
Relevance
ERP
Relevance
Customized
#developers 2 1 2,00
Community Activity 4 2 3,29
Support tool 5 4 2,82
Support service 2 4 3,44
Documentation 4 4 2,00
Developers activity 4 4 3,25
Unweighted average 2,80
Weighted average for OS 2,43
Weighted average for ERP 2,45
Weighted average for OS + ERP 2,44
Table 11: Product Attractiveness results.
Quality characteristics Compiere
Name
Relevance
General Customized
OSS ERP
Functional adequacy 5 5 3,25 3,25
Diffusion 4 3 3,75 3,75
Effective costs 3 5 2.40 3,22
Legal reusability 1 5 5,00 5,00
Migration support 0 5 3,67
Data import 0 5 5,00
Configurability 0 2 3,89
Customization 0 4 4,67
Unweighted average 3,60
Weighted average for OS 3,34
Weighted average for ERP 3,58 4,07
Weighted average for OS + ERP 3,48 3,92
It is possible to observe in Table 9 that Compiere
appears to be a software project that is reliable and
well suited to the functional requirements. However,
it presents a poor maintainability. Its product quality
is higher if it us considered as a generic open source
project, while it decreases when the ERP quality
characteristics are considered.
Community Trustworthiness Results
Results of the analysis of the Community
Trustworthiness regarding Goal 2 are reported in
Table 10. The results indicate that the Compiere
community does not appear to be very trusted,
especially with reference to the offered
documentation. However, it is necessary to specify
that not all the documentation is freely available,
and, therefore, it was not considered in the analysis.
In any case, it can be stated that the company
Compiere Inc. did not significantly "suffer" for the
lack of interest of the developers.
Product Attractiveness Results
The results obtained with reference to the Product
Attractiveness are shown in Table 11. Compiere
appears to be a software project with a good
attractiveness. It obtained very high marks, and the
best results are obtained for the diffusion, data
portability and legal reusability. The worst results is
related to the costs and support to the migration.
6 CONCLUSIONS
The proposed work started from the idea of having a
toolkit supporting the characterization and
evaluation of OSS projects. In this direction, it is
important not only to consider the quality of the
software, but also other distinctive features of the
open source projects. Therefore, it was decided to
identify those data that are usually difficult to detect
by the users, and that are useful for making some
assessments of the projects of the OSS repository
Sourceforge. In addition, it was decided to proceed
to the customization of an already defined
framework, EFFORT, retaining its characteristic of
generality, that allows to characterize any type of
open source project regardless its application
domain.
The EFFORT framework was evolved to include
software reliability aspects. This was done with the
double aim of having the possibility of better
analysing the software product quality, and
understanding how an open source community is
careful and reactive to the management of the open
ICSOFT-EA2015-10thInternationalConferenceonSoftwareEngineeringandApplications
356

source project and its problem resolution. The
evolution required the analysis of the reliability
characteristic and accessible data in the available
repositories.
Once the evolution has been performed, for
understanding the applicability of the evolved
framework, it was applied to a case study conducted
on a relevant selected open source ERP project,
Compiere. The gathered data and results analysis
provided a positive feedback with reference to the
applicability and effectiveness of the new
framework. They provided a better insight of the
software project quality and the analysis of the bugs
also suggested to deepen the Compiere history and
understanding its management mechanisms
Now, the EFFORT framework considers many
aspects of the OSS quality. The only thing that it is
not yet considers is the quality in use that could be
subject of future studies. In future works, this aspect
will also be considered. In addition, a more detailed
analysis of its applicability will be performed, by
considering additional OSS projects.
REFERENCES
Aversano L., Pennino I., and Tortorella M. Evaluating the
Quality of Free/Open Source ERP System. In
Proceedings of the 12th International Conference on
Enterprise Information Systems ICEIS 2010, Springer-
Verlag. (Funchal, Madeira – Portugal, 2010).
Aversano, L. and Tortorella, M., Quality evaluation of
floss projects: Application to ERP systems.
Information & Software Technology, 55(7) (2013),
1260-1276 .
Aversano, L., Pennino, I. and Tortorella M. Evaluating the
Quality of FREE/OPEN Source Project. In INSTICC
Proceedings of the ENASE (Evaluation of Novel
Approaches to Software Engineering) conferences
(Athens, Greece, 2010).
Basili, V. R., Caldiera, G., & Rombach, H. D. The goal
question metric approach. In Encyclopedia of Software
Engineering. Wiley Publishers. 1994.
Birdogan, B., Kemal, C., 2005. Determining the ERP
package-selecting criteria: The case of Turkish
manufacturing companies. Business Process
Management Journal, 11(1) (2005), 75 – 86.
Del Bianco, V., Lavazza, L., Morasca, S., Taibi, D. The
observed characteristics and relevant factors used for
assessing the trustworthiness of OSS products and
artefacts. QualiPSo, 2008.
Golden B. Making Open Source Ready for the Enterprise,
The Open Source Maturity Model. Extracted From
Succeeding with Open Source, Addison-Wesley
Publishing Company, 2005.
Hyoseob, K., and Boldyreff, C. Open Source ERP for
SMEs. In ICMR 2005. (Cranfield University, U.K.,
2005).
International Organization for Standardization, 2001-2004.
ISO standard 9126: Software Engineering – Product
Quality, part 1-4. ISO/IEC.
International Organization for Standardization, 2005, ISO
standard ISO/IEC 25000:2005, Software Engineering -
- Software product Quality Requirements and
Evaluation (SQuaRE).
Kamseu, F., Habra,
N. Adoption of open source software:
Is it the matter of quality? In PReCISE, Computer
Science Faculty, University of Namur, rue
Grandgagnage, Belgium, 2009.
Kan, S. H., Basili, V. R., Shapiro, L. N. Software quality:
an overview from the perspective of total quality
management. IBM SYSTEMS JOURNAL. 1994.
OpenBRR. Business Readiness for Open Source. Intel.
2005.
QSOS. Method for Qualification and Selection of Open
Source software. Atos Origin. 2006.
Raymond, E.S. The cathedral and the bazaar: musings on
linux and open source by an accidental revolutionary,
2nd Ed., O’Reilly, 2001.
Reuther, D., Chattopadhyay, G. Critical Factors for
Enterprise Resources Planning System Selection and
Implementation Projects within Small to Medium
Enterprises. In International Engineering Management
Conference 2004, IEEE Comp.Soc.press, 2004.
Samoladas, I., Gousios, G., Spinellis, D. and Stamelos, I.,
The SQO-OSS quality model: measurement based
open source software evaluation, In: IFIP 20th World
Computer Congress, Working Group 2.3 on Open
Source Software, OSS 2008, Springer (Milano, Italy,
2008).
Spinellis, D., Gousios, G., Karakoidas, V., Louridas, P,
Adams, P.J., Samoladas, I., and Stamelos, I.
Evaluating the Quality of Open Source Software.
Electr. Notes Theor. Comput. Sci., Vol. 233, 2009, pp
5-28.
Sung, W. J., Kim, J. H., and Rhew, S. Y. A quality model
for open source selection. In Proceedings of the IEEE
Sixth International Conference on Advanced
Language Processing and Web Information
Technology. (China, 2007).
Wei, C. C., Chien, C. F., Wang, M. J. J. An AHP-based
approach to ERP system selection. In International
Journal of Production Economics. 96(1) (2005), 47-
62.
Wheeler, D. A. How to evaluate open source software/free
software (OSS/FS) programs. http://www.dwheeler.
com/oss_fs_eval.html#support, 2009.
Zirawani, B., Salihin, M. N., Habibollah, H. Critical
Factors to Ensure the Successful of OS-ERP
Implementation Based on Technical Requirement
Point of View. In 3rd Asia International Conference
on Modelling & Simulation, IEEE Comp.Soc.press.,
2009.
AnalysingtheReliabilityofOpenSourceSoftwareProjects
357
