Retrieval, Visualization and Validation of Affinities between Documents
Lu
´
ıs Trigo
1
, Martin V
´
ıta
2
, Rui Sarmento
1
and Pavel Brazdil
1
1
LIAAD – INESC TEC, Porto, Portugal
2
NLP Centre, Faculty of Informatics, Botanick
´
a 68a, 602 00, Brno, Czech Republic
Keywords:
Information Retrieval, Knowledge Artifacts, Graph-based Representation of Documents, Centrality Measures,
Affinity Network, Comparison of Rankings.
Abstract:
We present an Information Retrieval tool that facilitates the task of the user when searching for a particular
information that is of interest to him. Our system processes a given set of documents to produce a graph,
where nodes represent documents and links the similarities. The aim is to offer the user a tool to navigate in
this space in an easy way. It is possible to collapse/expand nodes. Our case study shows affinity groups based
on the similarities of text production of researchers. This goes beyond the already established communities
revealed by co-authorship. The system characterizes the activity of each author by a set of automatically
generated keywords and by membership to a particular affinity group. The importance of each author is
highlighted visually by the size of the node corresponding to the number of publications and different measures
of centrality. Regarding the validation of the method, we analyse the impact of using different combinations
of titles, abstracts and keywords on capturing the similarity between researchers.
1 INTRODUCTION
A great part of today’s knowledge appears in the form
of documents that can be accessed via Internet, or di-
rectly on web pages. These knowledge sources can
be easily accessed. The aim of Information Retrieval
(IR) is to facilitate the task of the user when searching
for a particular information that is of interest to him.
The information is normally returned in the form of
a rank list of documents which is not very helpful, if
the number of documents is large and the user has not
a clear picture of what he is looking for. Additional
techniques, like the characterization of documents by
keywords or brief snippets, help to focus on an item
of interest or else to skip it. Another technique that
is sometimes employed is clustering of documents of
interest as they are being returned. This way the user
can focus on a relevant cluster while searching for the
relevant item.
Our system starts by processing the documents in
a usual manner that is common to many text min-
ing (TM) tasks. To facilitate the processing, nor-
mally only parts of the documents are used, like ti-
tles or abstracts, as these are sufficient to get an idea
about what the document is about. Usual bag-of-
words (BoW) representation has been adopted.
In the next stage, we calculate similarity among
the individual documents and represent the resulting
information in the form of a graph. This can be shown
to the user for inspection. The aim is to offer him a
tool to navigate in the space of documents in an easy
way.
It is clear that larger graphs represent a problem,
as the user may easily get lost. This is one of the mo-
tives that the graph is processed to discover what we
call affinity groups. The user can thus consider the
node of interest (e.g. representing a particular doc-
ument or set of documents) and identify the affinity
group that this node belongs to. Our system enables
the identification of all other nodes with the greatest
affinity score. If a node represents, for instance, some
author, it is possible to identify all authors that work
on similar topics (as judged by words in BoW repre-
sentation).
As was mentioned before, inspecting large graphs
may be a bit tedious. Therefore the system offers the
facility to condense all nodes of a given affinity group
into a single metanode. This is useful for obtaining a
global perspective of the full network or to obliterate
those groups that are of lesser interest to the user. Any
condensed nodes can be expanded at will.
One special facet is provided that helps the user
to determine whether a particular node is important
or not. This is done by attaching keywords to each
452
Trigo, L., Víta, M., Sarmento, R. and Brazdil, P..
Retrieval, Visualization and Validation of Affinities between Documents.
In Proceedings of the 7th International Joint Conference on Knowledge Discovery, Knowledge Engineering and Knowledge Management (IC3K 2015) - Volume 3: KMIS, pages 452-459
ISBN: 978-989-758-158-8
Copyright
c
2015 by SCITEPRESS – Science and Technology Publications, Lda. All rights reserved
affinity group. The user can thus scan these keywords
and determine whether the group is of interest or not
and condense/expand the details accordingly.
It is a common knowledge that not all nodes in
a graph are equally important. Various graph-based
measures were introduced, such as betweenness and
eigenvector centralities, to enable to identify the im-
portant nodes. Our prototype software uses these
measures exactly with this aim. As the absolute val-
ues are not meaningful in themselves, we provide a
relative value in a boxplot. This again helps to make
the search/retrieval more effective.
The methods described are general and applica-
ble to many diverse domains. These can include doc-
uments describing R&D projects, legal documents,
court cases or medical procedures.
The case study we present in this paper used these
techniques to analyse affinities between researchers.
This enables sensing uncovered relations that go be-
yond the already established communities revealed by
co-authorship networks.
As a validation step, we investigate the impact of
including additional information into the researchers’
profiles – in our case, besides titles, we consider
adding paper keywords and abstracts. The key ques-
tion we wish to answer is, whether and how the com-
puted similarity among researchers changes if more
information is taken into account. In other words, the
question is whether the keywords and abstracts pro-
vide some additional value for dealing with similari-
ties. In order to evaluate three types of “publication-
based” profiles – titles only, titles+keywords and ti-
tles+keywords+abstracts, the computed similarities
were compared to real-world data – quantified opin-
ions about similarity among researchers provided by
them. These real-world data were obtained via ques-
tionnaires disseminated within a concrete research in-
stitute. Our results show that adding keywords ac-
companying articles is beneficial, but adding also ab-
stracts does not seem to lead to further improvements.
1.1 Our Prototype in the Light of
Knowledge Artifacts
As some researchers (Goldstone and Rogosky, 2002)
have pointed out, the meaning of a concept – in our
work “document” - depends on the relationship with
the other concepts in the conceptual framework. Our
prototype (Gallicyadas, 2015) can be seen as a repre-
sentational knowledge artifact aiming to give the user
a broad sense of the document space enabling fast
browsing and efficient decision support.
Humans are very efficient in processing visual in-
formation and obtaining insights regarding proper-
ties and their relationships and that enables an Aug-
mented Intelligence approach (Schmitt, 1998). Thus,
in the context of searching for learning objects (doc-
uments) (Bednar et al., 2007), the simple relational
model providing content and its contextual material
(the related content) enables a good user interpreta-
tion of the given knowledge space. Regarding the
views that documents represent users in a commu-
nity, our system may be seen as capturing a structured
representation aiming to identify potential collabo-
rations/knowledge sharing in some collective. New
knowledge potentiates new practices and its exploita-
tion in a spiral (Nissen et al., 2007).
2 RELATED WORK
Considering that our case study targets the academic
domain, the related work discussed here was chosen
accordingly.
The discovery of similarities between researchers
was addressed before (Price et al., 2010), and its aim
was to facilitate the process of paper distribution to re-
viewers. Their web-based methodology, called Sub-
Sift, retrieves researchers’ profiles based on their pub-
lications. These profiles enable a typical Information
Retrieval task. The papers submitted to a scientific
conference – playing the role of Query in IR – are
compared with different profiles, in order to optimize
the task of attributing articles to the suitable reviewer.
Other application in the academic field considers
the curricula organization of some courses and anal-
yses ”communities” and centrality of their learning
units (V
´
ıta et al., 2015).
Regarding the process of automatic extraction of
publications for each researcher, there are some chal-
lenges that were addressed by others (Bugla, 2009).
Beyond the bibliographic sources, the main issue
in retrieval of publications is name disambiguation
which helps to overcome two problems. The first
one involves attributing a publication to someone else
with the same name. The second one is failing to at-
tribute a publication to the correct person simply be-
cause he used a different variant of his name. One of
the techniques to determine whether a given publica-
tion of P in some bibliographic database should be at-
tributed to person P’ on a given site, involves a check
to determine whether both (i.e. P and P’) have the
same home institution. Such strategies are followed
in a web application used by the University of Porto
(Authenticus, 2014), which provides a compilation of
authors publications from several major bibliographic
databases (ISI, SCOPUS, DBLP, ORCID and Google
Scholar).
Retrieval, Visualization and Validation of Affinities between Documents
453
There is also work on recommender systems for
academic papers. In some literature, the relation-
ships between academic papers are often represented
in graphs that include authors in the nodes (Arnold
and Cohen, 2009) , (Zhou et al., 2008). A content-
based approach was proposed, including terms from
the papers’ titles in the graph (Lao and Cohen, 2010).
More recently, some approaches build graph networks
representing papers that are connected through cita-
tions (Baez et al., 2011) (K
¨
uc¸
¨
uktunc¸ et al., 2012).
Others (Lee et al., 2013) use a colaborative filtering
approach to recommend papers (items) to researchers
(users). AMRec (Huang et al., 2013) extracts con-
cepts from academic corpora, that are categorized as
tasks and methods, as well as their relations. These
are processed to provide recommendations of meth-
ods to researchers.
3 METHODOLOGY
In our practical application we considered that each
document includes the list of publication titles of a
particular author/researcher. This section presents the
main steps undertaken to uncover the unknown infor-
mation regarding affinities as well as its validation.
The method involves the following steps:
• Identify institutions and obtain researchers’
names
• Use web/text mining to process researchers’ pub-
lications
• Discover of potential communities linked by
affinities
• Identification of important nodes (researchers) in
the graph
• Characterization of nodes using keywords
• Comparing the rankings obtained from dissimilar-
ity matrices and rankings obtained via question-
naires
The first step is to select the institutions and ob-
tain the researchers names in their webpage. This in-
formation can be extracted by an expression in XPath
query language to obtain their names from the web-
site. Each researcher’s name can be used in the search
through the chosen bibliographic database, such as
DBLP, which enables direct access to each researcher
list of publications. The matching between authors
names in the institution’s website and bibliographic
databases brings name ambiguity problem that was
addressed before (Bugla, 2009). The resulting pub-
lications related to each author were kindly provided
by the Authenticus team, which in fact eliminated the
need to use web mining.
Publications titles are stored into plain text
files/documents, each representing a particular au-
thor. The text files are retrieved and preprocessed in
the usual manner. We use bag-of-words (BoW) and
vector representation (Feldman and Sanger, 2007),
and perform usual preprocessing including removal
of numbers, stop-words, punctuation and other spuri-
ous elements. After this task, the list of documents
is transformed into a document-term matrix represen-
tation, each line (document) representing a vector of
its terms, with tf-idf weighting. The vector represen-
tation is used to obtain the cosine similarity matrix.
This matrix can be visualized in the form of an affinity
graph and is used as the basis for further processing.
The affinity network enables to calculate some
measures of the importance of individual researchers.
Two centrality measures (Iacobucci, 1994) were ex-
tracted from the graph. The betweenness centrality
indicates the number of times a vertex joins two other
vertices on the shortest path. The eigenvector central-
ity gives more importance to nodes that are connected
to the most influent nodes.
For the affinity group extraction task, we have
selected the Walktrap algorithm (Pons and Latapy,
2005). This technique finds densely connected sub-
graphs, also referred to as communities, through ran-
dom walks. It assumes that short random walks tend
to stay in the same community.
Furthermore, TextRank algorithm (Mihalcea and
Tarau, 2004) was used to extract keywords from the
existing text (publication titles).
The validation process compares the rankings re-
trieved from the graph and rankings obtained via
questionnaires. More details on validation can be
found in section 5.
4 CASE STUDY
Our method and the corresponding prototype uses
data involving 120 researchers of seven units of a
Portuguese R&D institution (INESC-TEC, 2015) and
their 4153 publications.
In the main screen, the prototype presents the
affinity network of the 7 R&D units/centers consid-
ered. Further exploration and browsing features are
presented below.
In the graph, nodes represent researchers and links
similarities. There are several ways to infer the im-
portance of a particular author/node. The most im-
mediate visual clues are the node size, proportional to
the number of the author’s publications, and the num-
KITA 2015 - 1st International Workshop on the design, development and use of Knowledge IT Artifacts in professional communities and
aggregations
454
ber and quality of connections to other researchers.
The strength of the similarity between researchers is
represented by the thickness of the edge. The node
border color identifies the affiliation unit and the core
color identifies the affinity group. If the user selects
one of the research units in the left-hand drop down
menu, the corresponding network is shown in the can-
vas. Fig. 1 shows the R&D network and their three
affinity groups discriminated by the core color of the
nodes.
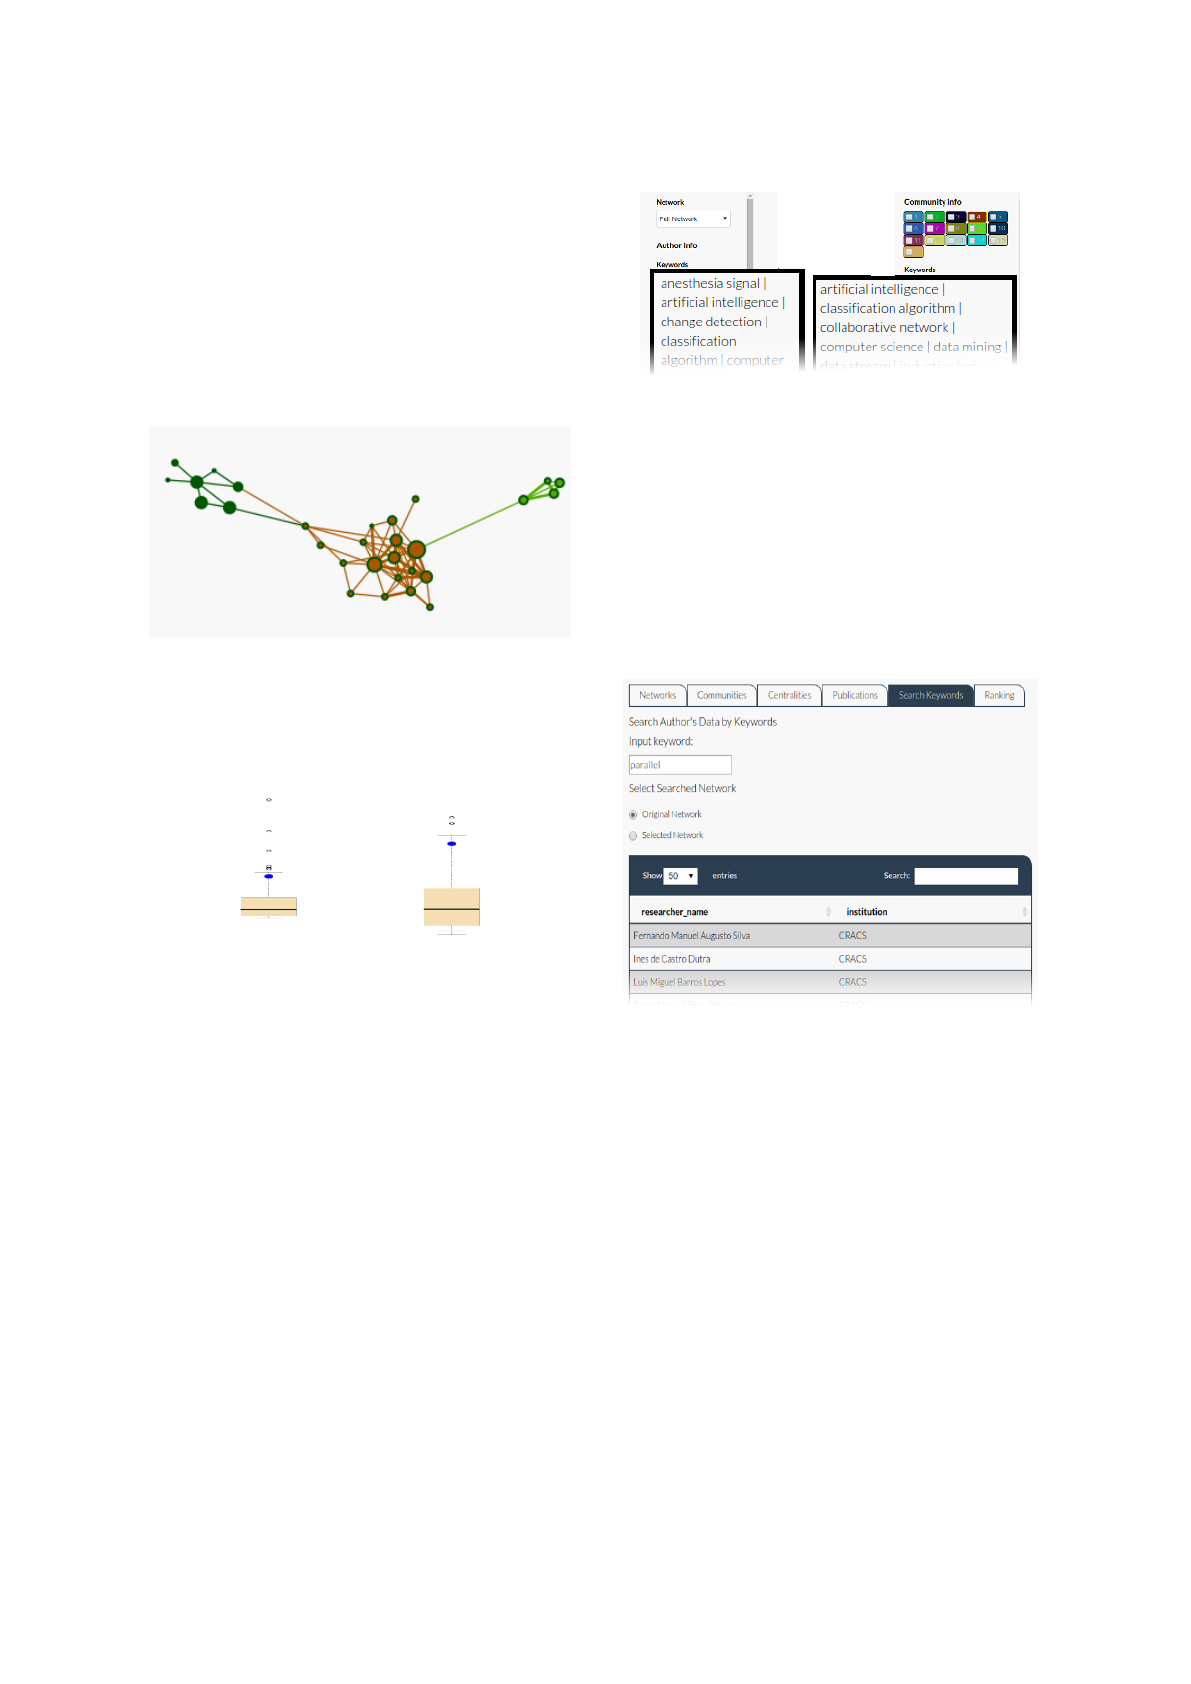
Figure 1: Network of an R&D unit/center.
The other graphic elements for this relevance as-
sessment are betweenness and eigenvector centralities
boxplots (Fig. 2) that show the relative position of the
author in respect to the others.
Figure 2: Betweenness and eigenvector centralities box-
plots for the selected researcher.
The user has several options to select the node(s)
he is looking for. It can be made both visually, by
clicking on a node, or by textual search – by typing re-
searcher’s name in the main tab or keywords in a sec-
ondary tab. Each node (researcher) is characterized
by keywords. Keyword descriptors for the selected
author are presented in the left-hand side panel. Key-
word descriptors of the researcher’s affinity group are
presented in the right-hand side (Fig. 3).
The quality of the characterizing keywords gener-
ated by our prototype is quite reasonable. So far, we
have performed an informal evaluation, by just com-
paring the keywords generated with the keywords ex-
tracted from researchers’ web pages. For instance,
for the selected author, the keywords that were col-
lected from his webpage (Data Mining and Decision
Support; Knowledge Discovery from Data Streams;
Artificial intelligence) have a significant overlap with
the ones that were automatically extracted. We plan to
Figure 3: Keyword descriptors for a selected researcher in
the left-hand side panel and for his/her affinity group in the
right hand-side.
carry out a more thorough quantitative study later us-
ing conventional term overlap metrics (e.g. precision,
recall).
Beyond the visual clues in the network canvas, the
interface presents two distribution pie charts that give
an insight about the distribution of the members that
belong to the same affinity group and R&D unit of the
selected researcher.
Figure 4: Searching network authors by keyword.
The prototype also includes extra tabs at the top.
One of the tabs enables the search for the researchers
that are characterized by some particular keyword.
Thus, finding authors associated with specific key-
words or research areas is simple and intuitive. Fig. 4
shows a specific search by the keyword parallel.
There is an additional aspect that we would like to
mention here – folding and unfolding. Fig. 5 shows
the folding of the full network in existing affinity
groups. On the right-hand side, the network is folded,
hiding many of the details of the full network. The
size of nodes is proportional to the number of ele-
ments of the affinity group and the width of the con-
nection/edges is determined by the mean of the sim-
ilarity weights of the connections between the corre-
sponding groups.
Retrieval, Visualization and Validation of Affinities between Documents
455
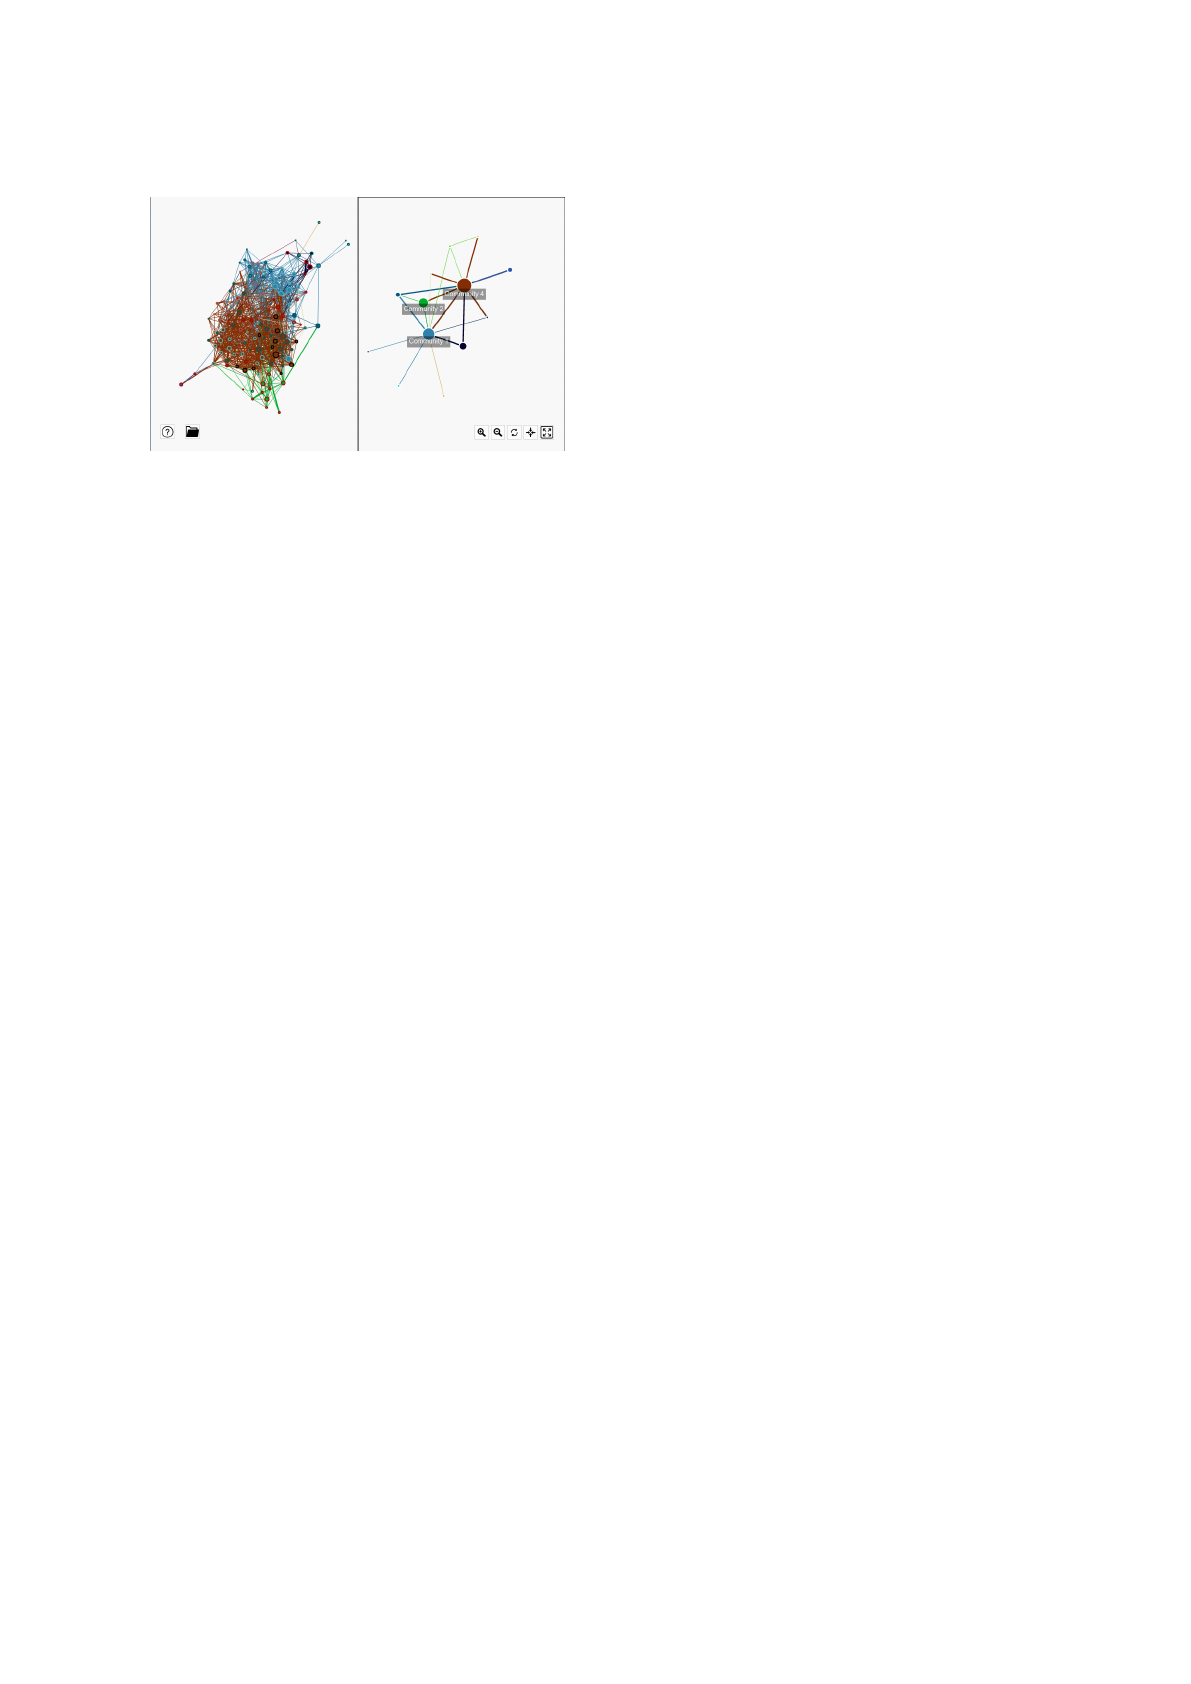
Figure 5: Unfolded and folded version of the full network.
5 VALIDATING RETRIEVAL
Our prototype only used paper titles for generating
the similarity matrix. In this section we describe the
work carried out to validate our method and test if
adding abstracts and paper keywords improves the
results. The validation step was applied to the data
about the Institute for Fuzzy Modeling and Applica-
tion (IRAFM, 2015), University of Ostrava, Czech
Republic having slightly more than 30 researchers,
including Ph.D. students. About two thirds of the re-
searchers completed the questionnaire.
The source of the data about researchers’ publi-
cations is the Information System of the Research,
Experimental Development and Innovations (ISVAV,
2015) run by the Czech authorities. It gathers infor-
mation about all the R&D results throughout more
than 10 years. The advantage of using this data
source is that we do not need to deal with traditional
problems of IR: different variants of the researchers’
names and same names of different persons. Names
are stored in a normalized variant and researchers
have a unique ID – with some exceptions, that were
handled manually.
We have focused this task on the graph that has
been automatically generated and analyse each node.
The similarities to other nodes are compared to simi-
larities obtained from questionnaires.
5.1 Computing the Dissimilarity Matrix
for Each Corpus – Preprocessing
Issues
For each researcher we have generated a single plain
text files that contains:
• titles (T)
• titles plus keywords (T+K)
• titles plus keywords plus abstracts (T+K+A)
These three corpora: T, T+K, T+K+A consist
from the corresponding sets of files for each re-
searcher. Using preprocessing tools contained in tm
package, a standard sequence of preprocessing steps
was applied on these text data (transformation to low-
ercase, then punctuation, numbers and white spaces
were removed).
Analogously as in previous work (Brazdil et al.,
2015) we have chosen a bag-of-words representa-
tion for our documents in each collection (corpus)
and a document-term-matrix was generated (tf-idf
weighting (Feldman and Sanger, 2007) was used),
so we obtained 3 DTM for each corpus (T, T+K,
T+K+A) and from those three dissimilarity matrices
were computed using the cosine similarity. Values
were rounded to two decimal digits and values lower
than a certain threshold were replaced by zeros.
By observing the dissimilarity matrices, we can
assign a list of k most similar researchers to a given
researcher. The initial setting for the further analy-
sis is that we have a list of top-5 most similar re-
searchers obtained from the questionnaire (i.e., the
“true ordering”) and also three top-5 lists of most sim-
ilar researchers obtained from corresponding dissimi-
larity matrices (T, T+K, T+K+A). Hence, we are able
to compare true orderings/rankings to our “computed
ones” and evaluate them.
5.2 Ranking Comparison Measures
For comparing these pairs of rankings, we have used
the three measures. But before introducing these mea-
sures, a small example will show how the rankings
have been obtained.
Let us assume we have a following order-
ing (“true ordering”) of top five elements: L
1
=
(P
1
,P
2
,P
3
,P
4
,P
5
) and a “computed ordering” L
2
=
(P
6
,P
2
,P
1
,P
7
,P
4
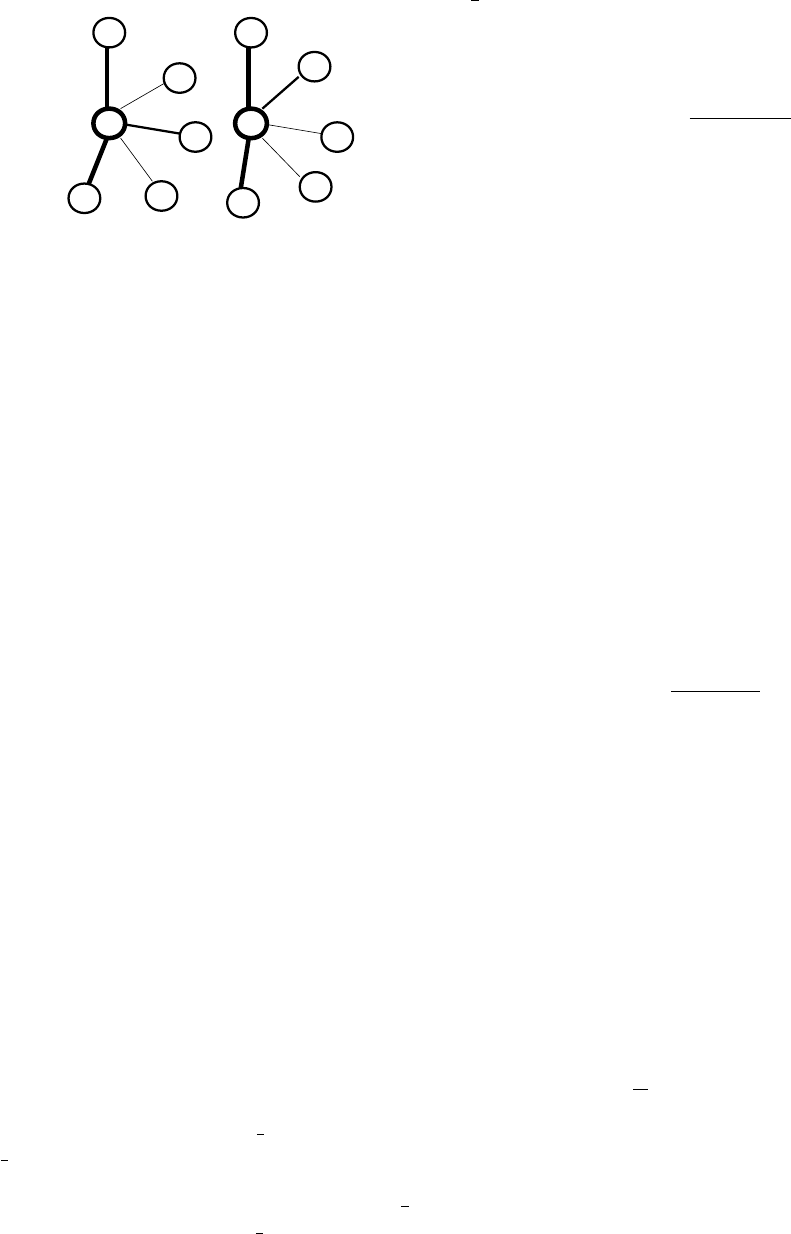
). Fig. 6 shows the graphs that are
used as the basis for this ordering. For instance, the
element P
1
precedes P
2
in the true ordering, because
Sim(P
1
,P
0
) = 0.6 and Sim(P
3
,P
0
) = 0.4 and obviously
0.6 >0.4 (here Sim represents similarity).
Let us now examine the measures. The first and
most simple measure is the size of the overlap of the
two rankings. We used the normalized variant, i.e.,
the size of the overlap divided by the length of the
lists. Thus, as we deal with top lists, we can obtain
only six values – 0, 0.2, ..., 1 – where 1 is the result
for equal lists, 0 for lists having no common elements.
Returning to our example, the lists L
1
and L
2
have 3
elements in common, so the overlap measure has a
value of 0.6.
The obvious advantage of this method is a triv-
ial implementation and straightforward interpretation.
KITA 2015 - 1st International Workshop on the design, development and use of Knowledge IT Artifacts in professional communities and
aggregations
456
P0
P6
P7
P1
P4
P2
0.35
0.17
0.24
0.11
0.31
“True”“Computed”
P0
P1
P3
P5
P4
P2
0.6
0.5
0.2
0.4
0.1
Figure 6: ”Computed” and ”True” similarity graphs that are
the basis for the ordering of the top 5 elements.
However, this measure cannot capture the differences
arising from the changes in the ordering within the
(top-five) lists.
The second measure is based on the Spearman’s
footrule (Bar-Ilan et al., 2006). Since this measure
is designed for use on two rankings of the same set,
it has been applied it to reduced lists where non-
overlapping elements have been removed from both
lists. That is, we have obtained two lists of the
same length containing only elements common to
both original lists. Moreover, the mutual ordering of
the remaining elements is the same as in the original
lists. Reduced lists can be represented as ranks σ
1
and σ
2
from the set {1, . . . , |S|} where S is a set of all
common elements of the original lists.
Suppose, for instance, we have two lists includ-
ing elements L
1
and L
2
shown earlier. The reduced
lists containing only common elements are L
0
1
=
(P
1
,P
2
,P
4
) and L
0
2
= (P
2
,P
1
,P
4
), while L
0
1
represents
the correct ordering. Variables σ
1
and σ
2
represent
the ranks of the elements of L
0
1
in each list. So for σ
1
we get the obvious ordering (1, 2, 3) and for σ
2
we
have (2, 1, 3).
The value of the Spearman footrule for permuta-
tions σ
1
and σ
2
can be computed in a following way
(Bar-Ilan et al., 2006):
Fr
|S|
(σ
1
,σ
2
) =
|S|
∑
i=1
|σ
1
(i) − σ
2
(i)| (1)
Formula for Fr
|S|
calculates the sum of differences
of all ranks. In our example, we get |1 − 2| + |2 −
1| + |3 − 3| = 2. Obviously, the value of Fr
|S|
is 0
in case of σ
1
= σ
2
, i.e. when the lists are identical.
To obtain a normalized value of Spearman footrule,
it is necessary to divide Fr
|S|
by the maximal value
maxFr
|S|
. The maximal value is
1
2
|S|
2
for |S| even and
1
2
(|S| − 1)(|S| + 1) for |S| odd.
Let us see what happens in our example. As have
an odd number of elements, we apply the formula
1
2
∗
(|S|−1)∗(|S|+1), which gives
1
2
∗(3−1)∗(3+1) =
1
2
∗ 2 ∗ 4 = 4. In our example, the value of Sp
|S|
is
1 − Fr
|S|
/maxFr
|S|
= 1 − 2/4 = 0.5.
The value of the correlation Sp
|S|
is calculated as
follows:
Sp
|S|
(σ
1
,σ
2
) = 1 −
Fr
|S|
(σ
1
,σ
2
)
maxFr
|S|
(2)
Note that if two original lists contain two common
elements having the same ordering in both lists but
they differ in the placement of each list, the value of
Sp remains 1.
The last measure is an extension of the previous
method, described in (Bar-Ilan et al., 2006) and is
called G-measure.
The main idea of this approach is assigning the
rank k + 1 to the element that did not appear in top k
list. For two permutations, say τ
1
,τ
2
, on the same set
containing n elements, the extended metric for k top
elements is defined as
F
k+1
(τ
1
,τ
2
) = 2(k − z)(k + 1) + (3)
+
∑
i∈Z
|τ
1
(i) − τ
2
(i)| −
∑
i∈S
τ
1
(i) −
∑
i∈T
τ
2
(i)
where Z is the set of common elements (i.e. elements
appearing in both top-k lists), z = |Z|, S is the set of
elements that appear only in L
1
, and T is the set of
elements that appear only in L
2
. A normalization is
needed and in case of this measure we obtain the G −
measure (Fagin et al., 2003):
G
(k+1)
= 1 −
F
(k+1)
maxF
(k+1)
(4)
It can be easily proved that the max F
(k+1)
value
is k(k + 1).
Let us consider our example. To compute G
(k+1)
for k = 5 we use the rule for F
(k+1)
. In our case, z,
i.e. the cardinality of set of common elements |Z| is
equal to 3, and so the first expression 2(k −z)(k +1) is
equal to 24. The first sum of the differences of ranks
of common elements of both lists is 3. This is because
the differences of ranks for P
1
is 2, por P
2
is 0 and
for P
3
is 1. Then we sum the rankings of elements
contained only in list S, containing the elements in L
1
but not in L
2
, i.e. elements P
3
and P
5
, is equal to 8.
The sum of the ranks of elements contained only in
L
2
, i.e. P
6
and P
7
, is 5. Therefore we have F
(k+1)
=
24 + 3 − 8 − 5 = 14. Since max F
(k+1)
= k(k + 1) =
30, the G
(k+1)
= 1−
14
30
. After rounding, we get 0.533.
In conclusion, the value of the G-Measure is influ-
enced also by the positions of the common elements
in the original lists, while the Spearman’s footrule
value takes into the account only the mutual orderings
of the common elements in the original lists.
Retrieval, Visualization and Validation of Affinities between Documents
457
5.3 Evaluation and Results on Rankings
The three ranking measures were applied to the dif-
ferent combinations of document elements are sum-
marized in Table 1. The table shows that adding key-
words to the corpus provides slightly better results
with respect to all measures, most notably with re-
spect Spearman. On the other hand, adding abstracts
has no impact on two measures out of three. Only at
G-measure there is a slight improvement.
Table 1: Evaluation of ranking results for the different com-
binations of document elements (T, T+K, T+K+A).
Corpus Overlap Spearman G-measure
T 0.478 0.500 0.426
T+K 0.496 0.533 0.452
T+K+A 0.496 0.533 0.458
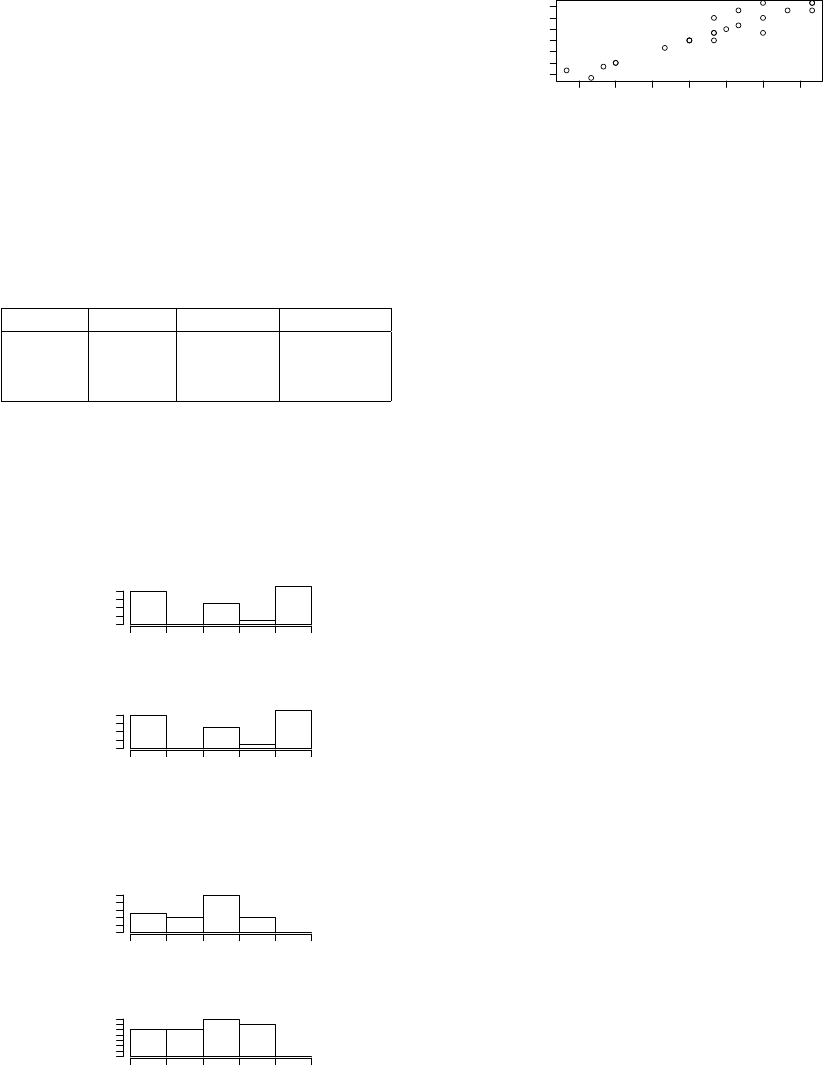
We show distributions of Sp and G −measure val-
ues for several combinations of T, T+K and T+K+A.
We note that the distributions differ quite substan-
tially. We observe for instance that if we add key-
words, the frequency of values of Spearman coeffi-
cients changes (Fig. 7 and 8).
Freq.
0.0 0.2 0.4 0.6 0.8 1.0
0 6
Figure 7: Distribution of Sp for T corpus.
Freq.
0.0 0.2 0.4 0.6 0.8 1.0
0 6
Figure 8: Distribution of Sp for T+K corpus.
In case of adding abstracts, the frequency of val-
ues of G-measure values changes too (Fig. 9 and 10).
Freq.
0.0 0.2 0.4 0.6 0.8 1.0
0 6
Figure 9: Distribution of G measure for T+K corpus.
Freq.
0.0 0.2 0.4 0.6 0.8 1.0
0 4
Figure 10: Distribution of G measure for T+K+A corpus.
The values of G-measures of T+K and T+K+A
corpora are highly correlated – this can be observed
in the following graph.
Thus, we can state a hypothesis that adding key-
words to titles leads to a significant improvement,
0.1 0.2 0.3 0.4 0.5 0.6 0.7
0.1 0.4 0.7
T+K
T+K+A
Figure 11: Correlation between G-measures of T+K and
T+K+A.
while adding abstract does not provide a significant
difference. This needs to be confirmed in future work,
where more data needs to be collected.
6 CONCLUSION AND FUTURE
WORK
The prototype described here enables a better under-
standing of a large set of documents for various rea-
sons. It portrays the information in the form of a
graph which can be inspected visually. Various means
are provided to navigate in the graph when search-
ing for relevant information. This includes compact-
ing/expanding nodes, annotating nodes with automat-
ically generated keywords, as well as graph central-
ity measures that show the relative importance of
each document. Instead of showing absolute num-
bers which are difficult to interpret, the values are rel-
ativised and presented in the form of a boxplot.
Scaling up the network presents some challenges
for some text mining operations, such as the similar-
ity calculation that is needed for the graph. We plan
to adopt a streaming approach to overcome this diffi-
culty. Besides, we also need to address the problem of
visualizing large graphs. This could be done by auto-
matically collapsing nodes that have no interest to the
user.
Regarding the validation step, this preliminary
study shows that abstracts do not add significant in-
formation to the titles. In contrary, keywords seem to
have some contribution for the calculation of similar-
ity. Our future work will aim to scale up the question-
naire to more researchers in different environments in
order to get more confidence in these results.
The methods described are general and applica-
ble to many diverse domains. These can include doc-
uments describing R&D projects, legal documents,
court cases or medical procedures. One of the authors
of this paper applied this methodology to medical cur-
ricula (V
´
ıta et al., 2015). Our case study focused one
R&D institution, permitting to obtain potentially im-
portant information about possible collaborators for
each researcher.
KITA 2015 - 1st International Workshop on the design, development and use of Knowledge IT Artifacts in professional communities and
aggregations
458
ACKNOWLEDGEMENTS
This work has been partially funded by FCT/MEC
through PIDDAC and ERDF/ON2 within project
NORTE-07-0124-FEDER-000059 and through the
COMPETE Programme (operational programme for
competitiveness) and by National Funds through the
FCT – Fundac¸
˜
ao para a Ci
ˆ
encia e a Tecnologia
(Portuguese Foundation for Science and Technology)
within project FCOMP-01-0124-FEDER-037281.
The authors wish to express their gratitude to the
Authenticus team for providing the list of titles of
publications of INESC Tec researchers needed for this
study and to all members of Institute for Fuzzy Mod-
eling an Applications, University of Ostrava, Czech
Republic for cooperation in the process of obtaining
the data for validating the system.
REFERENCES
Arnold, A. and Cohen, W. W. (2009). Information extrac-
tion as link prediction: Using curated citation net-
works to improve gene detection. In Proc. of the
3rd Int. Conf. on Weblogs and Social Media, ICWSM
2009, San Jose, California, USA, May 17-20, 2009.
Authenticus (2014). Authenticus bibliographic database.
https://authenticus.up.pt/. Accessed: 2014-09-30.
Baez, M., Mirylenka, D., and Parra, C. (2011). Understand-
ing and supporting search for scholarly knowledge.
In 7th European Computer Science Summit, Milano,
Italy.
Bar-Ilan, J., Mat-Hassan, M., and Levene, M. (2006). Meth-
ods for comparing rankings of search engine results.
Computer networks, 50(10):1448–1463.
Bednar, P., Welch, C., and Graziano, A. (2007). Learn-
ing objects and their implications on learning: A case
of developing the foundation for a new knowledge in-
frastructure. Learning objects: Applications, implica-
tions & future directions.
Brazdil, P., Trigo, L., Cordeiro, J., Sarmento, R., and Val-
izadeh, M. (2015). Affinity mining of documents sets
via network analysis, keywords and summaries. Oslo
Studies in Language, 7(1).
Bugla, S. (2009). Name identification in scientific publi-
cations. Master’s thesis, FCUP, University of Porto,
Portugal.
Fagin, R., Kumar, R., and Sivakumar, D. (2003). Compar-
ing top k lists. SIAM Journal on Discrete Mathemat-
ics, 17(1):134–160.
Feldman, R. and Sanger, J. (2007). The text mining hand-
book: advanced approaches in analyzing unstruc-
tured data. Cambridge University Press.
Gallicyadas (2015). Affinity miner online prototype.
http://gallicyadas.pt/affinity-miner.
Goldstone, R. L. and Rogosky, B. J. (2002). Using relations
within conceptual systems to translate across concep-
tual systems. Cognition, 84(3):295–320.
Huang, S., Wan, X., and Tang, X. (2013). Amrec: An intel-
ligent system for academic method recommendation.
In Workshops at the Twenty-Seventh AAAI Conference
on Artificial Intelligence.
Iacobucci, D. (1994). Graphs and Matrices. In: Wasser-
man, S. (eds), Social network analysis: methods
and applications. PP. 92-166. Cambridge University
Press, New York.
INESC-TEC (2015). Inesc tec. http://www.inesctec.pt/.
IRAFM (2015). Institute for fuzzy modeling and applica-
tion. http://irafm.osu.cz/.
ISVAV (2015). Information system of the research,
experimental development and inovations.
http://www.isvav.cz.
K
¨
uc¸
¨
uktunc¸, O., Saule, E., Kaya, K., and C¸ ataly
¨
urek,
¨
U. V. (2012). Recommendation on academic net-
works using direction aware citation analysis. CoRR,
abs/1205.1143.
Lao, N. and Cohen, W. W. (2010). Relational retrieval us-
ing a combination of path-constrained random walks.
Machine Learning, 81(1):53–67.
Lee, J., Lee, K., and Kim, J. G. (2013). Personalized aca-
demic research paper recommendation system. arXiv
preprint arXiv:1304.5457.
Mihalcea, R. and Tarau, P. (2004). TextRank: Bringing Or-
der into Texts. In Conference on Empirical Methods
in Natural Language Processing, Barcelona, Spain.
Nissen, H.-E., Bednar, P., and Welch, C. (2007). Use and
Redesign in IS: Double Helix Relationships? Inform-
ing Science.
Pons, P. and Latapy, M. (2005). Computing communities in
large networks using random walks. In Proceedings
of the 20th International Conference on Computer
and Information Sciences, ISCIS’05, pages 284–293,
Berlin, Heidelberg. Springer-Verlag.
Price, S., Flach, P. A., and Spiegler, S. (2010). Subsift: a
novel application of the vector space model to support
the academic research process. In WAPA, pages 20–
27.
Schmitt, G. (1998). Design and construction as computer-
augmented intelligence processes. Caadria, Osaka.
V
´
ıta, M., Komenda, M., and Pokorn
´
a, A. (2015). Exploring
medical curricula using social network analysis meth-
ods. 5th International Workshop on Artificial Intelli-
gence in Medical Applications, Lodz, Poland.
Zhou, D., Zhu, S., Yu, K., Song, X., Tseng, B. L., Zha, H.,
and Giles, C. L. (2008). Learning multiple graphs for
document recommendations. In Proceedings of the
17th International Conference on World Wide Web,
WWW 2008, Beijing, China, April 21-25, 2008, pages
141–150.
Retrieval, Visualization and Validation of Affinities between Documents
459
