
Daily Equity Returns and Price Limit in China's Stock Market
Yuan Yirui
National Research Institute for Rural Elechrification, 122 Xueyuan Road, Hangzhou, China
yryuan@hrcshp.org
Keywords: Price Limit, Volatility, Normal Distribution.
Abstract: The purpose of this paper is to get a conclusion whether the price limits have C-H effects on return series on
limit-hitting days in China. I compare the volatilities between the non-limiting return series and return series
with price limit. ‘Estimating the effect of price limits on limit-hitting days’ is the main reference published
in 2005 by Chung Jeff and Li Gan. The model I use is normal distribution.
1 INTRODUCTION
Price limit is an established amount in which a price
may increase or decrease in any single trading day
from the previous day’s settlement price. It limits the
extent that how far the price can move up or down.
The purpose of Price limits is to control price
fluctuation and make an orderly market. Price limit
has two effects: ceiling effect, C-H effect. As I will
use return series instead of only limit-hitting days’
returns, there is no ceiling effect. The C-H effect is
called cooling-off and heating-up effect. It assumes
that price limit may cool off or heat up price
behavior. If it has effect, I can use price limit as a
tool to achieve certain purposes.
Around half of the world’s stock exchanges use
price limit tool. For example, In China, Stock
exchange limit the price changes to 10% in mid-
1997, but now the price limits decline to 5%. We
can see that price limits will also change according
to the economy status.
There are many references I can use. In the paper
used as the main reference, the main conclusion is
that price limit will have some cooling off effect in
normal iid distribution. But the effect is not
significant in mixture normal distribution. The
model I use is the one introduced in the reference. In
‘Price limit performance: Evidence from the Tokyo
Stock Exchange’, there are three hypothesis of
effect: volatility spillover hypothesis (prevent price
change and immediate correction), delayed price
discovery hypothesis (the block on price may force
stock to discover until next trading day), trading
interference hypothesis (people want to sell or buy at
equilibrium price and they will wait). They use daily
stock price data of four years. In the first hypothesis,
they use a 21-day event window, day -10 to +10.
Day 0 represents the limit-hit day. Then they
calculate volatility of each day for the 21-day period
surrounding the event day 0. However, the empirical
results show: volatility returns to normal level not
that quickly; price still change and even more
frequently; trading volume is larger than before. As
a conclusion, none of them established. Price limits
almost have no effect.
In ‘Price limits and volatility: a new approach
and some new empirical evidence from the Tokyo
stock exchange’, it examines Day-of-the-week effect
of limit hits which is first introduced ever. They use
the data from DataStream. It uses EGARCH model
which allows for the information asymmetry and
parameters to be negative. When seasonally
occurred price limit days is associated with
seasonally occurred high stock returns, it means that
price limit hits are not due to noise trading entirely.
It also shows that high volatility exists when there
are high price limit hits; low volatility exists when
there are low price limit hits.
In ‘The impact of trading halts on liquidity and
price volatility: evidence from the Australian stock
exchange’, it examines the behavior of liquidity and
volatility around trading halts. There contains four
hypothesis: Trading volume for halted stocks is
abnormally high immediately after a trading halt;
Price volatility is also abnormally high after a
trading halt; bid-ask spreads are abnormally wide;
Market depth at the best-quotes is abnormally low
immediately after a trading halt. In order to observe
the behavior of both liquidity and volatility, they set
up a natural experiment: there are two identical
11
Yirui Y.
Daily Equity Returns and Price Limit in China’s Stock Market.
DOI: 10.5220/0006018200110014
In Proceedings of the Information Science and Management Engineer ing III (ISME 2015), pages 11-14
ISBN: 978-989-758-163-2
Copyright
c
2015 by SCITEPRESS – Science and Technology Publications, Lda. All rights reserved
11

firms: one has trading halts, another don’t have.
They want to know the trading behavior after trading
halts by releasing good news and bad news. The
result is that trading behaviors act more abnormally
when bad news are released than good news.
In ‘Characteristics of stocks that frequently hit
price limits: empirical evidence from Taiwan and
Thailand’, They find that volatile stocks, actively
traded stocks and small market capitalization stocks
hit price limits more often than other stocks. The
stocks are all from Taiwan Stock Exchange and the
Stock Exchange of Thailand. It calculates the
number of limit hits by using year, month, day-of-
the week and industry categories. The purpose of
this paper is to find out that if some certain stocks
with certain characteristics hit limits more often than
others. They do this kind of research because that
this area is underdeveloped right now. It examines
four possible factors: beta, residual risk, trading
volume, firm size and the book-to-market value of
equity. Then it calculates the autocorrelation
between limit-hits and the four factors.
In ‘Using American Depository Receipts to
identify the effect of price limits’, it use a natural
experiment: same stock is traded in two different
exchanges. One has price limit and the other does
not have. In this way, we can observe the effect of
price limit very clearly. The conclusion of this paper
stands for the point that price limit does not have
significant effect on means nor variances.
There are some other related literatures I have
not mentioned here, but I will give reference
information at the end of the whole project. To sum
up, most supported opinion in previous years is that
price limits have cooling-off effect. But most recent
empirical work shows that the effect turns to be
heating-up. I will do this empirical work according
to Chinese recent information and status.
The paper is organized as follows: The Data and
Model will be included in Section 2. I will estimate
stocks using normal distribution model in Section 3.
Section 4 will be the conclusion.
2 DATA AND MODEL
The data is from ‘Wind information’. It contains
four stocks from 09/02/2011 to 09/03/2012. We get
the daily stock prices and returns from ‘Wind’.
Next, I calculate the adjusted stock return and use
the +5% and -5% as the upper and down limits and
find out how many times of limit hits. Then I divide
the sample into many subsamples, named Sj, which
contains j+1 day. S0 means there is no limit-hitting
day, and S1 means there is one limit-hitting day and
contains next day just after the hitting day. For
example, there is a return series (0,1,0,1,1,0,1,1,1,0).
0 represents that price doesn’t hit the limit and 1
represents that price dose hit the limit. 1 belongs to
S0 because there is no price limit hits. And 2and3
belong to S1. 4,5 and 6 belong to S2. If there is no
limit hits, I will just use the return data, but if the
return hits the limit, I will use the average return of
this day and next trading day as the adjusted return
of both of them. And sometimes they just hit the
limit in continuous days. The adjusted return will be
the average return of these limit-hitting returns and
the following day’s return. Now I have the adjusted
data.
Table 1: Days that limits are hit.
Sheng run Gan hua Sih uan Guo yao
Up
limit
hits
32 14 13 17
Down
limit
his
23 11 12 11
Total
limit
his
55 25 25 28
There are enough limit hits for me to do the
research and observe the effect of price limits. In
this way, the stock price returns to the equilibrium
on j+1 day and I can get rid of ceiling effect. In this
paper, the purpose is to observe if the price limit has
effect on volatility of stock prices.
Table 2: Frequency of limit hits in continuous days.
Continuous days of limit hits
0 1495
1 111
2 15
3 5
4 2
Total trading days 1628
Percentage of limit hit days 8.17%
rt*means an unobserved return series assuming no
price limit. rt means unobserved return series
assuming only the C-H effect. rt^ will be estimated
rt and rt0 will be the observed return series.
ISME 2015 - Information Science and Management Engineering III
12
ISME 2015 - International Conference on Information System and Management Engineering
12
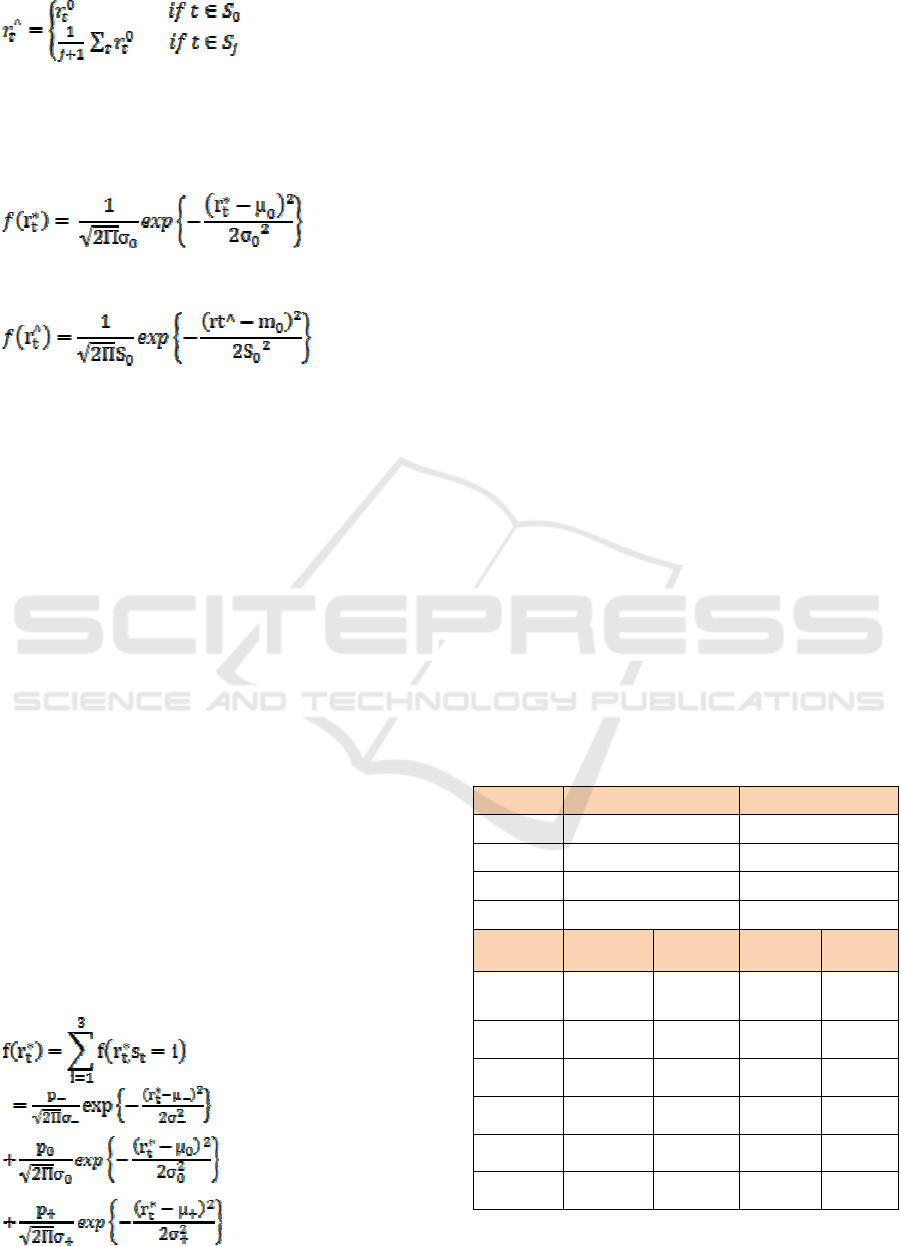
(1)
I use normal distribution to do the research. The
hypothesis is that price limit has a significant effect
on mean and volatility of stock returns.
The model is:
(2)
Now rewrite the function:
(3)
2.1 When the State S Is S
-
, It Means
that Return Hits the Down Limit
m
0
=µ
0
+γ (4)
s
0
2
=σ
0
2
(1+ζ
-
)*(1+j) (5)
2.2 When the State S Is S+, It Means
that Return Hits the Upper Limit
m
0
=µ
0
+γ (6)
s
0
2
=σ
0
2
(1+ζ
-
)*(1+j) (7)
In this rewrite model, (γ-,γ+)and (ζ-,ζ+) two pairs
reflect the effect of price limits on stock returns. I
use the Normal Distribution to run the regression
and see if these parameters are significant or not. If
the (γ-,γ+) are significant, it means that price limits
have effect on mean value. If the (ζ-,ζ+) are
significant, it means that price limits have effect on
variance.
All these parameters are not significant. This
means that price limits barely have. effect on mean
and variance under Normal Distribution Model.
Mixture Normal Distribution Model:
(8)
In this paper, I only use normal density to
estimate stock returns to see if the volatilities
between non-limiting returns and adjusted returns
with price limits change after limit-hitting days.
Mixture Normal Distribution can be used when price
limits are not reached consecutively on more than
one day. It is more difficult.
2.3 MLE Estimates and Effect of Price
Limits
In order to get the conclusion of the effect of price
limits on limit-hitting days, I use Maximum
Likelihood Estimation, which has been introduced in
previous part. Now I use ‘R’ program to do the
estimation. The detailed estimation results are listed
in table 3. I estimated six parameters: mean,
variance, mean effect +, mean effect -, variance
effect + and variance effect -. If I use gragh to
explain the main idea, it would be that observed data
obeys the Normal density and the adjusted data can
be drawd with fatter tails. First, I calculate the mean
and variance of observed stock returns and their
standard error . Second, I estimate the six variables
and their standard errors of adjusted data which
contains price limits. If the parameters are
significant, it means that they should be added into
the model and it also means that price limits have
effect on mean and variance. Third, I can get the
effect by using the formula introduced below. In this
way, the effect of price limits can be calculated and I
can make our conclusion depending on the result.
Table 3: Result of MLE.
mean variance
Shengrun -2.07e-03(1.87e-03) 7.24e-04(8.20e-05)
Ganhua -7.85e-04(1.18e-03) 4.95e-04(5.15e-05)
Sihuan -2.15e-04(4.4e-04) 1.31e-03(5.57e-05)
Guoyao -4.17e-04(4.4e-04) 1.08e-03(4.63e-05)
Stock Shengrun Ganhua Sihuan Guoyao
µ mean -3.7e-03
(2.1e-03)
-8.33e-04
(1.15e-03)
-1.87e-04
(1.37e-03)
-4.7e-04
(1.1e-03)
σ2 variance
7.0e-04
(1.1e-04)
4.78e-04
(5.34e-05)
4.46e-04
(6.4e-05)
4.4e-04
(5.2e-05)
γ-
mean effect
-0.033
(3.7e-03)
-0.0278
(3.4e-03)
-0.032
(2.2e-03)
-0.032
(2.5e-03)
γ+
mean effect
0.042
(2.7e-03)
0.031
(2.8e-03)
0.026
(3.3e-03)
0.027
(1.9e-03)
ζ-
var effect
-0.81
(0.052)
-0.81
(6.37e-02)
-0.94
(0.02)
-0.87
(0.039)
ζ+
var effect
-0.92
(0.020)
-0.86
(4.32e-02)
-0.78
(0.069)
-0.92
(0.020)
Daily Equity Returns and Price Limit in China's Stock Market
13
Daily Equity Returns and Price Limit in China’s Stock Market
13
The data in the brackets is standard error which can
be compared with the p-value to figure out whether
the variable is significant or not. I can conclude from
table 3 that ‘variance effect ‘ is significant. So it
means that price limits have a negative effect on
variance. This is so called cooling-off effect.
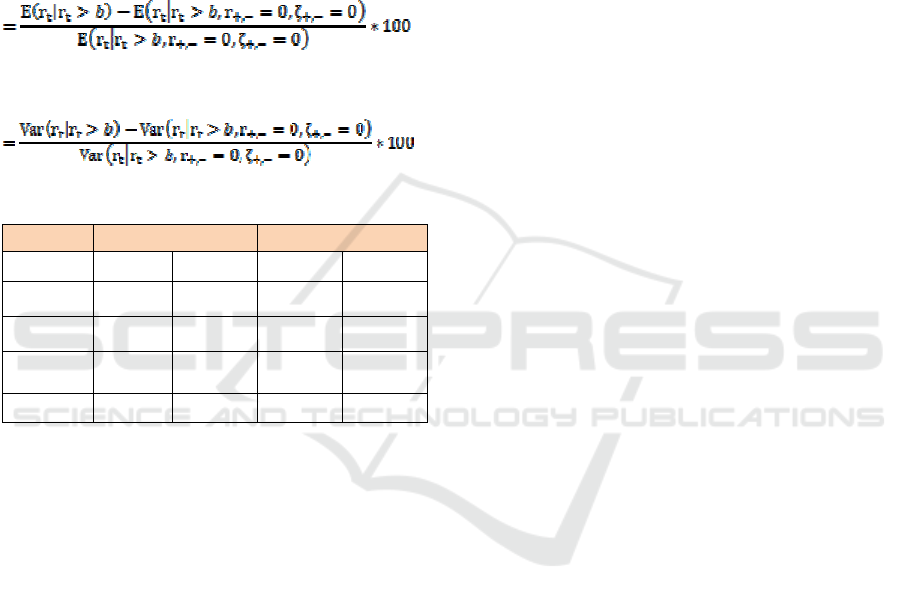
Now I want to know what the particular extent of
effect is. The effect of price limits is the percentage
change of both mean and variance when price hits
the limits.
Mean effect
Variance effect
Table 4: Effect of price limits on limit-hitting days.
Mean Variance
+ - + -
Shengrun 42% 26% -95% -51%
Ganhua 73% 35% -93% -55%
Sihuan 83% 57% -90% -86%
Guoyao 75% 74% -98% -69%
From table 4, we can see that the effects of price
limits in four stocks are similar. Also, it is apparent
that price limits have a positive effect on mean and a
negative effect on variance. This is so called
cooling-off effect which means volatility declines
after price limit hitting days. According to the result,
we can conclude that price limits have cooling-off
effect when using Normal density.
3 CONCLUSION
The main target of this paper is to see whether price
limits have effect or not. As we all know, price
limits have two effects: ceiling effect and C-H
effect. In this paper I only focus on C-H effect.
The sample is divided into many subsamples Sj,
which contains j+1 days. J represents days that hit
price limits. Then take the average of j days’ high
returns and next trading day’s return as the new
returns for j+1 days. The new returns will be the
sample used in the model. Through this way, all
subsamples will not have any ceiling effect. The data
is four ST stocks’ returns. The model I use is
Normal density. After MLE estimation, the results
show that price limits have some cooling-off effect.
Variance declines after price limits are set.
REFERENCES
Chung Jeff and Li Gan, 2005, Estimating the effect of
price limits on limit-hitting days, the econometric
journal Vol.8, No.1
Kenneth A. Kim and S. Ghon Rhee, 1997, Price limit
performance: Evidence from the Tokyo Stock
Exchange, the journal of finance. Vol.LII, No2
Haitham Nobanee, Wasim K. AlShattarat, Ayman E.
Haddad and Maryam AlHajjar, 2010, Price limits and
volatility: a new approach and some new empirical
evidence from the Tokyo stock exchange,
International Research Journal of Finance and
Economics 1450-2887
Alex Frino, Steven Lecce and Reuben Segara, 2011, The
impact of trading halts on liquidity and price
volatility: evidence from the Australian stock
exchange, Pacific-Basin Finance Journal, Volumn 19,
issue 3
Kenneth A. Kim and Piman Limpaphayom, 2000,
Characteristics of stocks that frequently hit price
limits: empirical evidence from Taiwan and Thailand,
Journal of Financial Markets, 315-332
Li Gan and Dong Li, 2001, Using American Depository
Receipts to identify the effect of price limits
ISME 2015 - Information Science and Management Engineering III
14
ISME 2015 - International Conference on Information System and Management Engineering
14
