
Automatic Segmentation of Extensor Tendon of the MCP Joint in
Ultrasound Images
Malik Saad Sultan
1,2
, Nelson Martins
1,3
, Diana Veiga
3,4
, Manuel Ferreira
3,4
and Miguel Coimbra
1,2
1
Instituto de Telecomunicac¸
˜
oes, Porto, Portugal
2
Faculdade de Ci
ˆ
encias, Departamento de Ci
ˆ
encias de Computadores, Universidade do Porto, Porto, Portugal
3
Enermeter, Sistemas de Medic¸
˜
ao, Lda, Parque Industrial de Celeir
´
os, Lugar de Gai
˜
ao, 4705-025, Braga, Portugal
4
University of Minho, Centro Algoritmi, Azur
´
em, 4800-058, Guimar
˜
aes, Portugal
Keywords:
Rheumatoid Arthritis, Ultrasound, Tendon Segmentation, Log-Gabor Filter, MCP joint.
Abstract:
Rheumatoid arthritis (RA) is a chronic inflammatory disease that primarily affects the small joints of the hand.
High frequency ultrasound imaging is used to measure the inflammatory activity in the joint capsule region of
Metacarpophalangeal (MCP) joint. In our previous work, the problem of bones and joint capsule segmentation
was addressed and in this work we aim to automatically identify the tendon using previously segmented struc-
tures. The extensor tendon is located above the metacarpal and phalange bone and the joint capsule. Tendon
and bursal involvement are frequent and often clinically dominant in early RA. Ridge-like structures are en-
hanced and pre-processed to reduce speckle noise using a Log-Gabor filter. These regions are then simplified
using medial axis transform and vertically connected lines are removed. Adjacent lines are connected using
morphological operators and short lines are filtered by thresholding. Physiological information is used to cre-
ate a distance map for all the lines using prior knowledge of the bone and capsule region location. Based on
this distance map, the tendon is finally segmented and its shape refined by using active contours. The segmen-
tation algorithm was tested on 90 images and experimental results demonstrate the accuracy of the proposed
algorithm. The automatic segmentation was compared with an expert manual segmentation, and a mean error
of 3.7 pixels and a standard deviation of 2 pixels were achieved, which are interested results for integration
into future computer-assisted decision systems.
1 INTRODUCTION
Rheumatoid arthritis (RA) is an autoimmune disease
that causes permanent damage to joints and affects
1% of the world population (A. Gibofsky, 2012). It
affects over 1.5 million people in the USA and the es-
timated cost of treatments is 80 billion dollars per year
(SE. Gabriel, 2001). Imaging modalities such as ul-
trasound and MRI are used to assess disease progres-
sion, which helps doctors to respond properly with
adequate treatment. Several studies highlight the in-
volvement of the extensor tendon in RA assessment
and it is widely accepted as one of the first mani-
festations of the disease in RA patients. This early
treatment can prevent permanent damage and disfig-
urement of patients small joints (E. Filippucci et. al,
2012, W. Grassi et. al, 1995 & 2000). Ultrasound
is an inexpensive, reliable, widely used imaging tech-
nique and its use has been increasing in rheumatol-
ogy to analyse extra-articular structures such as the
Metacarpophalangeal (MCP) joint and the tendon in
RA (J. Carr et. al., 2001). In the literature, several au-
thors considered ultrasound as the gold standard tool
for the detection and assessment of this tendon in RA
(L. De Flaviis, 1988).
Although the use of ultrasound imaging tech-
niques has increased recently, mostly due to the avail-
ability of better acquisition equipment, it’s resulting
images are still difficult to interpret because of the
presence of speckle noise, low contrast and interfer-
ence of the surrounding tissues. These issues reduce
the acceptance of ultrasound for the clinical diagnos-
tics of soft tissues. Several preprocessing techniques
were proposed by researchers to enhance ultrasound
image visualization, which is usually the first step in
all image-processing tasks (Oleg V. Michailovich and
Allen Tannenbaum, 2006).
The view of anatomical structures of the MCP
joint region of the index finger is shown in Figure
1. Generically, a tendon is a structure that usually at-
Sultan, M., Martins, N., Veiga, D., Ferreira, M. and Coimbra, M.
Automatic Segmentation of Extensor Tendon of the MCP Joint in Ultrasound Images.
DOI: 10.5220/0005692500710076
In Proceedings of the 9th International Joint Conference on Biomedical Engineering Systems and Technologies (BIOSTEC 2016) - Volume 2: BIOIMAGING, pages 71-76
ISBN: 978-989-758-170-0
Copyright
c
2016 by SCITEPRESS – Science and Technology Publications, Lda. All rights reserved
71
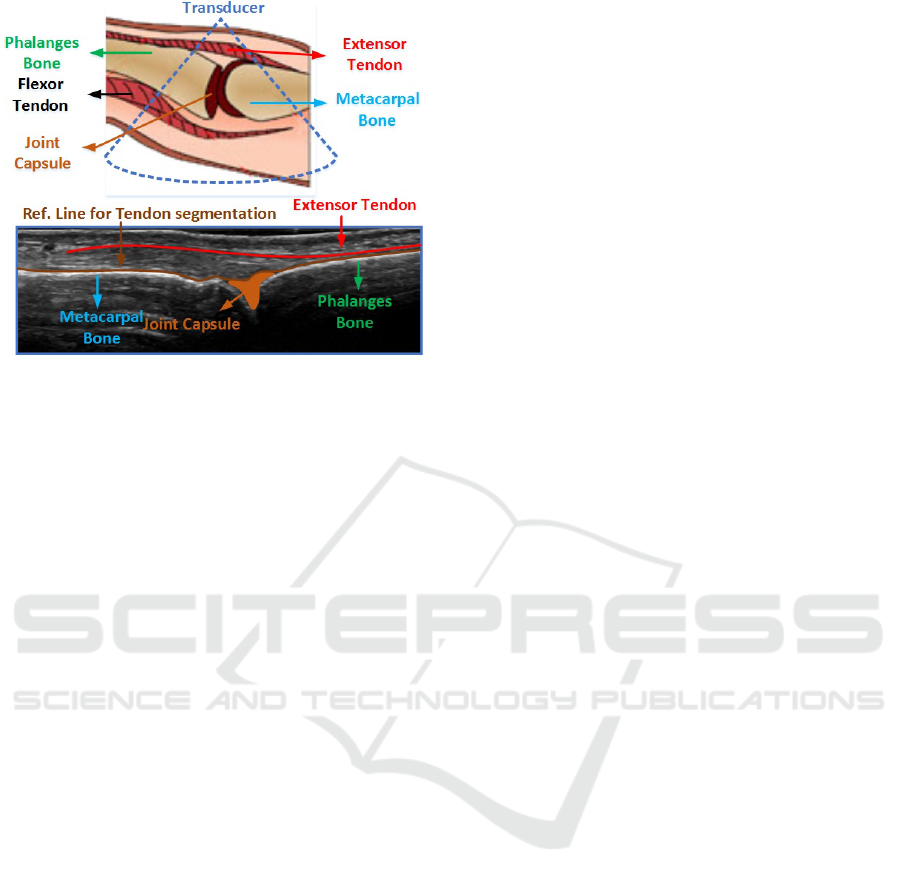
Figure 1: Anatomical structures of MCP joint region of in-
dex finger.
taches muscles to bones and usually slides over bones
(McMinn, 1998).
Several methods were proposed to segment the
extensor tendon in ultrasound images. An adaptive
texture-based active shape model (ATASM) was used
(Bo-I Chuang et. al., 2014), active contours were
used, which automatically initialize and propagate
based on the physiological model of the structure of
interest. The curvelet based supraspinatus tendon seg-
mentation algorithm in ultrasound is proposed by (R.
Gupta et. al, 2014). The supraspinatus tendon is lo-
cated in the rotator cuff and is one of the tendons
that shows early pathological changes. The images
were denoised and were decomposed for energy anal-
ysis by using curvelet transform to select curvelet fea-
tures, followed by morphological operators. He in-
corporated the prior knowledge of the tendon. As
the tendon consists of convex like structure with low
intensity pixels, located between bursae and cortical
that are high intensity structures. The proposed ap-
proach seems very interested. However, not suitable
for longitudinal scan of the MCP joint of index finger.
Because, the extensor tendon is not located between
the two high intensity structures and there are several
other structures in its neighbor that are quite similar
in shape and intensity.
The method proposed in (H.C. Chen et. al., 2011)
segments this tendon in three consecutive steps. The
tendon contour model is initialized in the first step,
followed by the search of most distal image and fi-
nally active contours are used to refine the predefined
model. These methods used axial scan images to seg-
ment elliptic shape tendons. However, in our work we
used longitudinal view images that allow early and ac-
curate detection of tenosynovitis, small joint effusion
and bone erosion (M. Backhaus et. al., 2002).
In (M.S. Sultan et. al., 2015) a new algorithm
was proposed to segment the metacarpal and pha-
lange bone. Since, the MCP joint capsule region is
located between the metacarpal and phalange bone,
seeds points were used to roughly segment the dorsal
triangular joint region.
Following the observations of our rheumatologists
team, the swelling of the joint capsule region that
commonly occurs in RA, forces the tendon to move
away from the metacarpus and phalange bones (F.
McQueen et. al., 2005). This swelling increases the
distance between the bones and tendon, therefore it is
expected that measuring this distance can be useful to
quantify the degree of inflammation.
In this paper, we extend our previous work by
proposing a new segmentation algorithm to segment
the tendon in images of the second MCP joint. To
the best of our knowledge, this is the first work that
addresses the problem of tendon segmentation in lon-
gitudinal scan of the MCP joint of the index finger
in ultrasound images. A new tendon segmentation
algorithm is proposed which might provide doctors
with clues of inflammatory activity, to quantify dis-
ease progression and/or treatment response.
This paper is organized as follows. Section 2 pro-
vides the overview of the methodology adopted in this
paper. Section 3 reports the visual and quantitative re-
sults and finally Section 4 concludes the paper with a
discussion and conclusion.
2 METHODOLOGY
In this work, we propose an algorithm to segment the
extensor tendon in ultrasound images. First, images
are converted to grayscale and then inverted. The ten-
don is a valley-like structure that consists of dark pix-
els. After inversion, the tendon turns into a ridge like
structure with brighter pixels, which although not re-
ally necessary, gives us a more conventional way to
visually understand the obtained results. The second
step is to suppress speckle noise and to enhance ridge-
like structures using Log-Gabor filter. Structures are
then simplified using the iterative thinning process
and pixel deletion criteria while preserving the con-
nectivity of each region. Extracted structures are then
filtered to remove vertical and small regions. Mor-
phological operators are used to connect adjacent re-
gions and then regions are smoothed using a spline
function. At this stage, we used the segmentation al-
gorithm proposed in (M.S. Sultan, 2015), obtaining
the locations of the bones and joint capsule. The ten-
don is then the first ridge-like structure located above
the segmented joint capsule and bone, and a distance
BIOIMAGING 2016 - 3rd International Conference on Bioimaging
72
map is plotted on the smoothed region. The simplified
ridge structure closest to the bone is classified as the
extensor tendon. This segmented region is considered
as an initialization contour for the final shape refine-
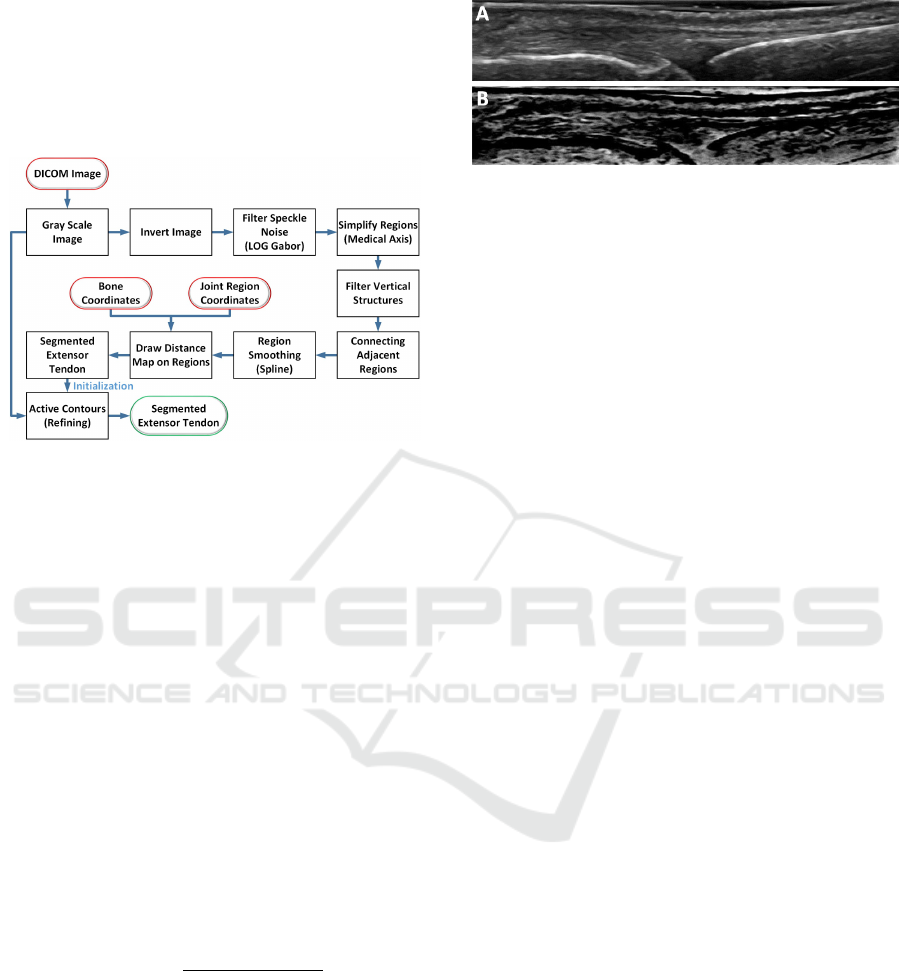
ment stage using active contours. The flow chart of
the algorithm is shown in Figure 2.
Figure 2: Overview of the processing pipeline of the pro-
posed algorithm.
2.1 Pre-processing
The segmentation of the extensor tendon in an ultra-
sound image is a challenging task because several ad-
ditional visual structures are present due to artifacts.
After inversion, a denoising step is required to sup-
press speckle noise from the image. We used the
phase preserving Log-Gabor filter which not only de-
noises the image, but also enhances the region of in-
terest. The Log-Gabor filter removes the DC compo-
nent and its transfer function constructs the filter with
an arbitrary large bandwidth. The Log-Gabor filter
comprises of three main steps. In the first step the
phase and amplitude of the transform are calculated
using the even and odd symmetric wavelets at scale n
forming the response vector (Equation 1 and Equation
2), in which the complex valued frequency compo-
nents consist of real and imaginary parts, E
n
(X) and
O
n
(X) respectively.
A
n
(X) =
q
E
n
(X)
2
+ O
n
(X)
2
(1)
Φ
n
(X) = atan2(O
n
(X), E
n
(X)) (2)
The noise distribution of the amplitude response
is modelled by a Rayleigh distribution since it has
been proven as a popular choice (A. Sarti, 2005).
In the second step, the mean and variance of the
Rayleigh distribution is estimated in the smallest scale
to calculate noise threshold because it has the largest
bandwidth and thus the strongest noise response. Fi-
nally, values which exceed the estimated threshold
Figure 3: A) Original Image B) Inverted, denoised and en-
hanced image.
(see equation 3) are removed from each scale (Fig.
3).
T = E(A
n
) + kσ
r
(3)
Whereas, E(A
n
) is the mean of Rayleigh distribu-
tion, n is the index of smallest scale factor, k is the
constant that typically varies from 2 − 3. After testing
different values of k, we found that k = 2.2 is the bet-
ter choice for our images that remove the noise with-
out affecting the tendon region and σ
r
represent the
variance of Rayleigh distribution.
2.2 Tendon Segmentation
A medial axis transform is used to extract the center-
line from the solid structures and provide more de-
tailed shape information. We used the thinning al-
gorithm since it preserves the topology and shape of
the object. It forces the skeleton layer by layer to-
wards the middle of the object while preserving the
connectivity and produce one pixel width skeleton (L.
Lam et. al, 1992 & Haralik, shapiro, 1992). The
pre-processed images contain several ridge-like struc-
tures, which need to be simplified while preserving
their topological properties. Vertical structures con-
nect the tendon with other irrelevant regions due to the
presence of artifacts. These structures are of bright
intensity pixels and are oriented nearly vertical in the
image. Traditional techniques are not very suitable
here because the noise is quite structured. So we
had used a median filter to get rid of unwanted struc-
tures. Since these structures are very small and many
of them have a width less than or equal to 4 pixels, the
optimal choice is to use a median filter of size (1 ×4).
In case, if we use a filter wider than this, then the im-
portant details in the images are corrupted (blurred).
Small discontinuities of the simplified regions are re-
moved by dilation followed by erosion using (3 × 3)
structuring element and by connecting two nonzero
neighbors pixels (using bridge, diag function), given
their effectiveness in providing cost-effective filtering
without strongly affecting the underlying shapes. The
major axis length is calculated for all the regions in
Automatic Segmentation of Extensor Tendon of the MCP Joint in Ultrasound Images
73
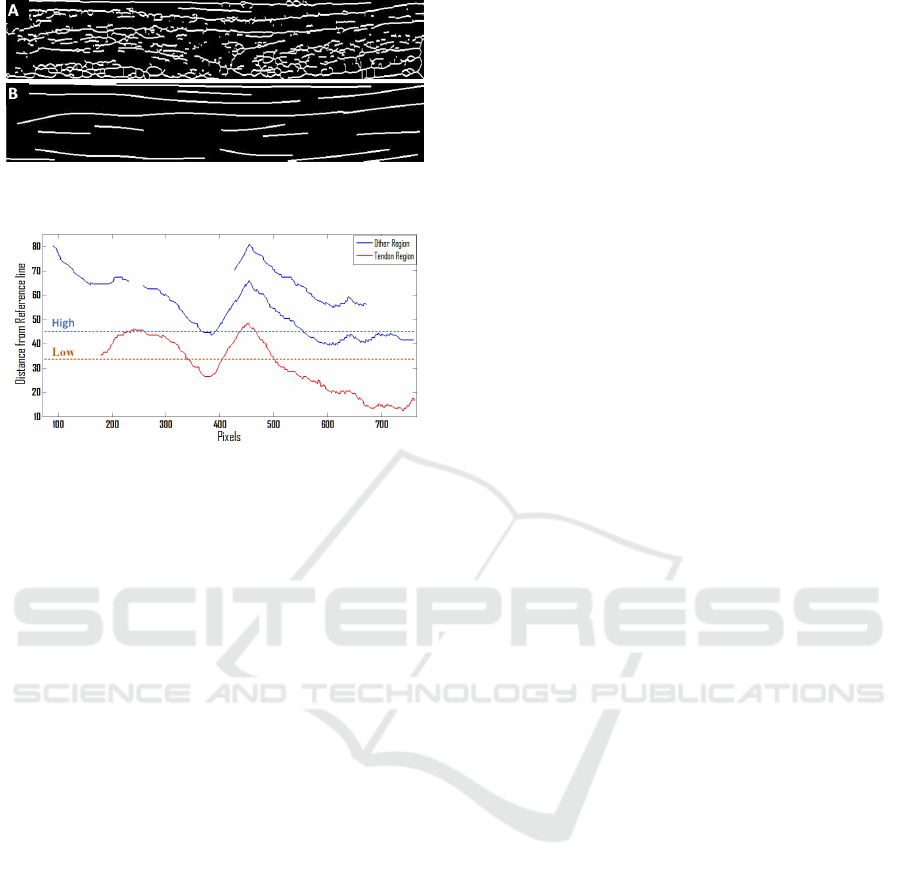
Figure 4: A) Medial axis transform B) Filtered and
smoothed regions.
Figure 5: Distance Map from the reference line.
the image and the regions with small lengths are re-
moved. Before going to the next step all detected re-
gions are smoothed in the y-axis using a spline func-
tion. There are several kinds of splines. In our work
we make use of smoothing spline and the amount of
smoothness is adjusted near zero to get linear poly-
nomial fit. In simple words, we fitted a least square
straight line on a set of noisy detected regions Fig. 4.
The bone segmentation algorithm presented in
(M.S. Sultan, 2015) is now used. The author has used
phase preserved Log-Gabor filter for speckle noise re-
duction and he introduced a new feature, that is the
area covered by the metacarpal and phalange bone.
The algorithm is designed which combine this feature
with previously known features (intensity, shadow),
which is then used for the segmentation of phalange
and metacarpal bones. An algorithm is proposed to
address the intensity drop-off problem at the joint.
Initial seeds were estimated to roughly segment the
MCP joint region. Estimated bone and capsule re-
gion coordinates are used to produce a distance based
model. Following the physiological properties, the
tendon region is located above the bones, above the
joint capsule region and is the closest region from
bone. A reference line (Xi) is obtained from these
structures (Bones and joint capsule region) and is the
base for the distance mapping. The Euclidean dis-
tance is measured between each pixel of the detected
region and the reference line.
Since the probability of finding a tendon below the
reference line is zero, all detected regions in this area
are removed. The tendon is the closest region from
the bone therefore based on the distance map the clos-
est region is selected as the tendon (Figure 5). This
map visually illustrates that selecting a High thresh-
old of the distance map to extract the extensor tendon
from the image can result in the addition of some ad-
joining regions, which are undesirable. Given this, a
small distance map low threshold is used to increase
the probability of selecting only the tendon in an un-
derlying image. The detected tendon region is used as
the base and all the connected regions directly above
low threshold were also considered as a part of the
tendon. The threshold was found robust however, it
requires number of experiments to adjust a suitable
threshold.
In some images, the algorithm missed parts of the
extensor tendon region due to discontinuities at some
points. A final refinement step based on active con-
tours is used to minimize this. The boundaries of the
contour are automatically initialized using the current
tendon segmentation results. By taking into account
the initial mask obtained from the first segmentation
results and the fact that the tendon region is brighter
after inversion than its neighboring regions, we pro-
pose the use of active contours with edges as a mea-
sure of external energy. Since the tendon lies in a hor-
izontal plane, we restricted active contours optimiza-
tion iterations allowing points to converge only in the
vertical directions. The quality of the image is lim-
ited and several artifacts usually merge different soft
tissues, which led to the decision to set a low value
(50) for the maximum number of iterations, to limit
divergence.
3 RESULTS
3.1 Materials
The images used in this work were acquired with
a GE Healthcare LOGIQ-S8 and were saved in DI-
COM format with a size of (488 x 761) and spatial
resolution of 0.0531mm/Pixel. Around 45 patients
were analyzed, two images were acquired from each
patient (one from each MCP joint region of the in-
dex finger). The proposed algorithm was integrated
with (M.S.Sultan, 2015), both algorithms were imple-
mented with MATLAB R2013a, in a Windows 7 envi-
ronment. In order to validate our final results, a doctor
segmented all acquired 90 images. The segmentation
was done with a dedicated program, created specifi-
cally for this problem. The program load images and
then, the doctor only has to input some points in the
image, corresponding to the respective structure.
BIOIMAGING 2016 - 3rd International Conference on Bioimaging
74
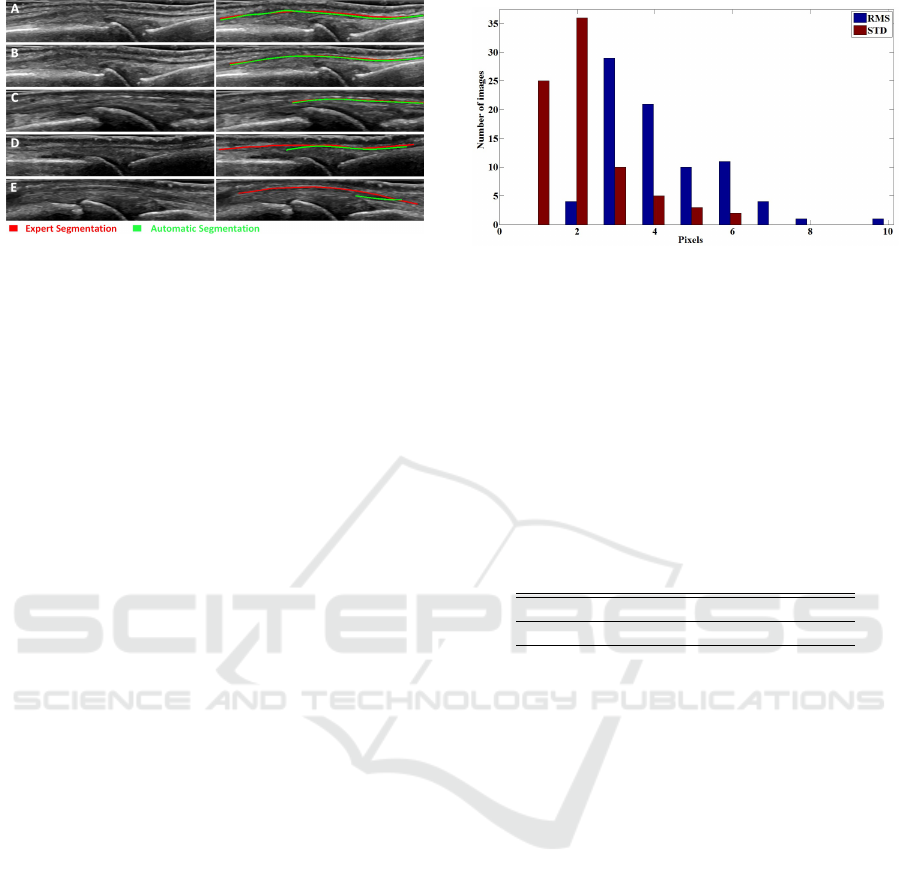
Figure 6: Segmentation results of the full algorithm for five
random cases out of the total 90 used. The left column
shows the original image, while the right shows the expert
and automatic segmentation results.
3.2 Tendon Segmentation
Five images were arbitrarily chosen for a visual in-
spection of the extensor tendon segmentation results
obtained from the proposed algorithm (Figure 6, left
column). Since the probability of finding the tendon
below the image is zero, therefore the lower part of
the images were removed to enhance clarity. Expert
annotation is shown in red, whereas the automatic
segmentation results obtained from our algorithm are
shown in green (Figure 6, right column)
Results hint that the algorithm segmented the ex-
tensor tendon with good precision since the expert an-
notations mostly overlap the automatic segmentation.
Even though we can see that several irrelevant tissues
were present in the image with similar intensity and
shape as the extensor tendon, we obtained satisfac-
tory results. In some images only part of the tendon
is visible (Figure 6E).
A quantitative analysis was performed to compare
the expert annotation (ground truth) with the auto-
matic segmentation. Our algorithm failed to segment
9 images due to the strong blurring that can be ob-
served at the boundaries of a tendon, preventing the
calculation of adequate error metrics for these cases.
The remaining 81 were compared using the root mean
square error (RMSE) and standard deviation (STD)
error metrics between expert and automatic segmen-
tation, measured in pixels and in the vertical direction.
In figure 7 is shown the distribution of the resulting
measures in all images. With an RMS error between
2-6 pixels and an ST D between 1-6 pixels, we con-
cluded that this is a viable approach to segment the
tendon.
Table 1 shows the aggregated mean error, stan-
dard deviation of mean errors (STDM) that measures
the amount of variations in mean error of each im-
age, minimum/maximum error shows the range of
possible errors and mean of standard deviation errors
Figure 7: Histogram, showing root mean square error and
standard deviation between the expert and automatic seg-
mentation of 81 image.
(MSTD) measures the spread of the errors in a set of
images from its mean values. The error matrix is cal-
culated from the expert and automatic segmentation
of all 81 images. For better understanding it is simply
the measure of spread of error that can be presented as
the mean plus/minus the mean of standard deviation
(MSTD) 3.7±2.
Table 1: Aggregated segmentation error for all 81 images
ST DM = Standard deviation of mean error, MS T D = Mean
of standard deviation (Unit: Pixels).
Mean STDM Min/Max MSTD
3.7 2.2 0/23 2
3.2.1 Discussion
A new method for the extensor tendon segmentation
in ultrasound images has been presented. Experimen-
tal results are encouraging, strengthening the poten-
tial of the proposed. The obtained information will
not only be useful to quantify rheumatoid arthritis
progression and/or treatment response, but also show
the potential for quantitative measurement for other
cases, such as tendon injuries, inflammation, erosion.
Only small differences between expert and automatic
segmentation were found, possibly due to the pres-
ence of artifacts and speckle noise.
The final conclusion is that the automatic segmen-
tation is a feasible and reliable approach in ultrasound
images. In future work, we will focus to improve this
approach by adding more a priori physiological fea-
tures and address the more advanced problem of clas-
sifying the patients with rheumatoid arthritis.
ACKNOWLEDGEMENTS
This work is funded by Instituto de Telecomunicac¸
˜
oes
in the scope of Project Rheumus (Projeto QREN no:
Automatic Segmentation of Extensor Tendon of the MCP Joint in Ultrasound Images
75

38505) and by the Fundac¸
˜
ao para a Ci
ˆ
encia e Tec-
nologia (FCT) grant no: PD/BD/105761/2014 and in
the scope of the Project RHDecho (Projeto norte2020
no: 3507), by FEDER funds through Programa Op-
eracional Competitividade e Internacionalizao COM-
PETE2020.
REFERENCES
Gibofsky A, 2012. Overview of epidemiology, patho-
physiology, and diagnosis of rheumatoid arthritis. The
American journal of managed care, Vol. 18, Issue 13,
pp. 295-302.
Gabriel SE, 2001. The epidemiology of rheumatoid arthri-
tis. Rheumatic disease clinics of north America, 27(2),
pp. 269-281
Filippucci E., Gabba A., Di Geso L., Girolimetti R., Salaffi
F., Grassi W., 2012. Hand tendon involvement in
rheumatoid arthritis: an ultrasound study. seminars in
arthritis and rheumatism, Vol. 41, Issue 6, pp. 752-760
Grassi W., Tittarelli E., Blasetti P., Pirani O., Cervini
C., 1995. Finger tendon involvement in rheumatoid
arthritis. Evaluation with high-frequency sonography.
Arthritis and Rheumatism., Vol. 38, issue 6, pp. 786-
94.
Grassi W., Filippucci E., Farina A., Cervini C., 2000. Sono-
graphic imaging of tendons. Arthritis and Rheuma-
tism, Vol. 43, Issue 5, pp. 969-976.
Carr J., Handly S., Griffin J., Gibney R., 2001. Sonogra-
phy of the patellar tendon and adjacent structures in
pediatric and adult patients. AJR American journal of
roentgenology, Vol. 176, Issue 6, pp. 1535-1539
De Flaviis L., Scaglione P., Nessi R., Ventura R., Calori
G., 1988. Ultrasonography of the hand in rheumatoid
arthritis. Acta Radiologica, Vol. 29, Issue 4, pp. 457-
460.
Michailovich, Oleg V. and Tannenbaum, Allen 2006. De-
speckling of Medical Ultrasound Images. IEEE Trans
ultrasonics, Ferroelectrics, and Frequency Control,
Vol. 53, Issue 1, pp. 64-78
Bo-I Chuang, Yung-Nien Sun, Tai-Hwa Yang, Fong-Chin
Su, Li-Chieh Kuo, I-Ming Jou, 2014. Model-
based tendon segmentation from ultrasound images.
40th Annual Northeast Bioengineering Conference
(NEBEC), Bostan, pp. 1-2
H.C. Chen, C.K. Chen, T.H. Yang, L.C. Kuo, I.M. Jou, F.C.
Su, and Y.N. Sun, 2011. Model-based Segmentation
of Flexor Tendons from Magnetic Resonance Images
of Finger Joints. 33rd Annual International Confer-
ence of the IEEE EMBS, Boston, Massachusetts USA,
pp. 8009 - 8012
M. Backhaus, WA. Schmidt, H. Mellerowicz, M. Bohl-
Bhler et al. 2002. Technique and diagnostic value
of musculoskeletal ultrasonography in rheumatology.
Part 6: ultrasonography of the wrist/hand. vol. 61, Is-
sue 6, pp. 674-687
McMinn, 1998. Last’s Anatomy Regional and applied.(9th
ed.), Churchill Livingstone.
Sultan, M.S., Martins, N., Ferreira, M.J., Coimbra,M.T.
2015. Segmentation of bones & MCP joint region of
the hand from ultrasound images. 37th Annual Inter-
national Conference of the IEEE EMBC, Milan-Italy,
pp. 3001 - 3004
A. Sarti, E. Mazzini, C. Corsi, and C. Lamberti, 2005. Max-
imum likelihood segmentation of ultrasound images
with rayleigh distribution. IEEE Transactions on ul-
trasonics, Ferroelectrics and Frequency Control, vol.
52, issue. 6, pp. 974-960.
F. McQueen, V. Beckley, J. Crabbe, E. Robinson, S. Yeo-
man, N. Stewart. 2005. Magnetic resonance imaging
evidence of tendinopathy in early rheumatoid arthritis
predicts tendon rupture at six years. Arthritis Rheum,
vol. 52, issue 3, pp. 744-751.
L. Lam, L. Seong-Whan, Y. S. Ching. Sep 1992. Thin-
ning Methodologies-A Comprehensive Survey. IEEE
Transactions on Pattern Analysis and Machine Intel-
ligence, Vol. 14, issue. 9, pp. 869-885.
R. M. Haralick, L. G. Shapiro, 1992. Computer and Robot
Vision. Vol I, Addison-Wesley Longman Publishing
Co., pp. 170-171.
Gupta R., Elamvazuthi I., Dass SC, et al. 2014. Curvelet
based Automatic segmentation of Supraspinatus ten-
don from Ultrasound Image: A focused assistive diag-
nostic method. BioMedical Engineering OnLine, vol.
13, issue. 157. doi:10.1186/1475-925X-13-157.
BIOIMAGING 2016 - 3rd International Conference on Bioimaging
76
