
Parking Space Occupancy Verification
Improving Robustness using a Convolutional Neural Network
Troels H. P. Jensen
1
, Helge T. Schmidt
1
, Niels D. Bodin
1
, Kamal Nasrollahi
2
and Thomas B. Moeslund
2
Aalborg University, Aalborg, Denmark
{thpj12, hschmi12, nbodin12}@student.aau.dk, {kn, tbm}@create.aau.dk
Keywords:
Computer Vision, Parking, Convolutional Neural Network, Deep Neural Network, Deep Learning.
Abstract:
With the number of privately owned cars increasing, the issue of locating an available parking space becomes
apparant. This paper deals with the problem of verifying if a parking space is vacant, using a vision based
system overlooking parking areas. In particular the paper proposes a binary classifier system, based on a Con-
volutional Neural Network, that is capable of determining if a parking space is occupied or not. A benchmark
database consisting of images captured from different parking areas, under different weather and illumina-
tion conditions, has been used to train and test the system. The system shows promising performance on the
database with an overall accuracy of 99.71 %.
1 INTRODUCTION
In recent years the amount of cars on the roads has
increased, this development not only leads to a higher
demand on the trafic network, but also in the number
of parking spaces.
This is further evidenced by (Shoup, 2006), who
in 2006 researched the cruising time and distance
driven when searching for a curb parking in Los An-
geles. They discovered that the average cruising time
and distance covered was 3.3 minutes and about 0.8
km, respectively. (Shoup, 2006) also argue that the
average search time is 8.1 min. and that the average
share of cars in traffic, searching for a parking space,
was 30 %, these assertions are based on previous re-
search, conducted in business districts between 1927
and 2001.
(Zheng and Geroliminis, 2016) also investigates
the issue of cruising-for-parking and creates corre-
sponding models, while suggesting it can be reduced
by varying the parking price.
The increased strain on the road network, the time
wasted and extra fuel used, makes it interesting to
consider, if all these aspects can be reduced by pro-
viding the drivers with information about the nearest
vacant parking space.
One approach, that is currently being used, is plac-
ing signs at focal points, which indicates the number
of available parking spaces at specific parking areas.
The issue is that the driver is not informed about the
exact location of a vacant parking space. At parking
areas where such specific information is available, the
solution normally is to locate sensors in each parking
space, e.g. infrared sensors, which can be placed both
above of or in the parking space, or magnetometers
buried under the asphalt. Using several, possibly bat-
tery powered, sensors results in increasing price and
maintainance as the size of the parking area increases.
One solution to this, could be to use a vision based
system, where cameras are placed, such that they
monitor a larger parking area, one sensor can thereby
be used to deliver information about several parking
spaces.
2 RELATED WORK
Previous effort have been put into developing vision
based systems, with the intend of determining the va-
cancy of parking spaces.
In (Funck et al., 2004), they used several images
of an empty parking area, under different illumina-
tion conditions, to create an average image. Prin-
cipal Component Analysis (PCA) was used to cre-
ate an eigenspace representation. Reconstructing any
new image from the eigenspace representation, yields
a reference image with the current illumination, any
difference between the new image and its eigenspace
reconstruction is then defined as an object. The sys-
tem only estimates the occupancy of the whole park-
Jensen T., Schmidt H., Bodin N., Nasrollahi K. and Moeslund T.
Parking Space Occupancy Verification - Improving Robustness using a Convolutional Neural Network.
DOI: 10.5220/0006135103110318
In Proceedings of the 12th International Joint Conference on Computer Vision, Imaging and Computer Graphics Theory and Applications (VISIGRAPP 2017), pages 311-318
ISBN: 978-989-758-226-4
Copyright
c
2017 by SCITEPRESS – Science and Technology Publications, Lda. All rights reserved
311

ing area and tests showed an average error rate of 10
%.
(True, 2007) used manually labeled Regions-Of-
Interest (ROI). The system is divided into two parts,
in the first part a color histogram is created for each
parking space and is then classified using either k-
Nearest Neighbour (kNN) or a Support Vector Ma-
chine (SVM). In the second part Harris corner detec-
tion is used on each parking space. A feature vocabu-
lary is then created and classification is done by com-
paring the feature vocabulary from the test image with
the one from the training set. Using colour histogram
and either kNN or SVM they achieved an error rate
around 10 %, while the feature detection had an error
rate of 51 %.
(Bhaskar et al., 2011) combined rectangle detec-
tion and Scale Invariant Feature Transform (SIFT).
They worked with the assumption that a parking space
is a rectangle of pixels in an image, the images used
was captured from an aerial camera. Using a thresh-
old based classifier, they achieved an accuracy of 96.9
%, since the system depends on the lines of the park-
ing space to function, it is affected by partial or full
occlusion of these, while also being dependent on the
parking spaces being rectangular.
In (Masmoudi et al., 2014) a Homography trans-
formation was used to change the point of view of
the parking area, in order to reduce the effect of per-
spective distortion. The parking spaces are defined by
using two corners of the first parking space and defin-
ing a width. A Gaussian Mixture Model (GMM) was
used for background subtraction and they then only
considered objects that overlap with the parking space
model. For feature extraction they achieved the best
results using Speeded Up Robust Features (SURFs),
combined with SVM for classification. Their method
achieved an accuracy above 92 % for all their tests,
but was not robust against occlusion.
(Tschentscher et al., 2015) tested using both var-
ious colour histograms and Difference-of-Gaussian
(DoG) for feature extraction, combining them with
either kNN, Linear Discriminant Analysis (LDA) or
a SVM for classification. They achieved the most ro-
bust results using DoG and SVM, with an average ac-
curacy of 96.42 % on a never seen parking area.
(Huang and Vu, 2015) proposed using a cube
model for each parking space, each of the six surfaces
of the cube is then normalized and the classifier is
trained on all of the patches separately. For feature ex-
traction. They used Histogram of Oriented Gradients
(HOG), LDA for feature reduction and Naive Bayes
Classifier (NBC) for classification. The performance
of the system was tested under various weather con-
ditions and achieved more than 99 % accuracy in all
of them.
(Klosowski et al., 2015) proposed using 2D sep-
arable Discrete Wavelet Transform (DWT) and then
applying morphological operations. Since they don’t
manually mark the parking spaces or automatically
detect them, they count the pixels and thereby calcu-
late the occupied percentage.
In (De Almeida et al., 2015) a database consist-
ing of 12,417 images was introduced, including im-
ages from two different parking areas, one of them
from two different angles. Besides introducing the
database, two systems were also proposed to solve the
issue of vacancy verification. Both systems used tex-
tural descriptors, one Local Binary Pattern (LPB) and
the other Local Phase Quantization (LPQ), both sys-
tems used SVM for classificaton. When training and
testing the system on the same database, they achived
an average error rate around 0.5 %. When testing on
parking areas that was not used for training, the low-
est achieved error rate was 11 %.
(Baroffio et al., 2015) proposed a system using
wireless cameras, connected in a network. The sys-
tem assumes that the region of the parking spaces is
known, these regions are then extracted, converted to
HSV colorspace and the hue is then used to create a
histogram, which is used as local features. For clas-
sification they used a linear SVM, based on normal-
ized histograms. To test the accuracy, the authors used
the PKLot database presented in (De Almeida et al.,
2015), they achieved respective accuracies of 96 % on
UFPR04, 93 % on UFPR05 and 87 % on PUCPR.
In (Masmoudi et al., 2016) a modified 3D model
of the parking spaces was used, where the part in fo-
cus is the surface tangent to the street, in order to solve
the issue of occlusion. They then track the objects
in the scene, using GMM for background subtraction
and the cars are chosen based on their dimensions,
tracking is performed using a Kalman filter. Using
SURFs and SVM, they detect the current state of each
parking space. Combining tracking of the cars and lo-
cal features from SURFs, they use a decision tree to
make the final decision of the occupancy of the park-
ing spaces. They achieved an accuracy of 94.23 % in
the used data.
(Sukhinskiy et al., 2016) applied perspective
transformation on the images and manually marked
the parking spaces. By continously getting a new
frame of the parking area, they were able to compare
the new frame to the old frame and thereby determine
if the state of the parking space had changed. A pre-
trained neural network was used for the final classifi-
cation.
When solving computer vision based problems,
the traditional way is to use handcrafted features, ex-
VISAPP 2017 - International Conference on Computer Vision Theory and Applications
312

tracted from e.g. SIFT, HOG etc., combined with a
classifier, SVM for example. In later years Convolu-
tional Neural Networks (CNN) have gotten more at-
tention, as they have shown great potential in pattern
recognition tasks. An example of the impact CNN’s
have had can be seen in the ImageNet contest, where
the winning system in 2011 had an error rate around
25 % and the year after it was reduced to 16 %, when
AlexNet won (Russakovsky et al., 2015) (Krizhevsky
et al., 2012). Since then, CNNs have become an inte-
gral part in our every day life, used in our Digital Per-
sonal Assistants, auto tagging our photos and translat-
ing languages.
In (Valipour et al., 2016) a pre-trained CNN,
VGGNet-f was used and fine-tuned to work on the
PKLot database presented in (De Almeida et al.,
2015). They used Stochastic Gradient Decent (SGD)
with learning rate and weight decay and a mini-batch
size of 128. They report their results using Area Un-
der Curve (AUC), arguing that their method is 3 to 5
% better than the results in (De Almeida et al., 2015).
(Huang and You, 2016) propose using 3D point
clouds, acquired by a Lidar, segment unwanted in-
formation, buildings, ground and curb and use three
Orthogonal-Views as input to a CNN which test. Us-
ing the method they achieved an accuracy of 83.8 %.
(Ahrnbom et al., 2016) focuses on creating a fast
classifier for detecting vacant parking spaces, which
was tested on the PKLot database. For feature extrac-
tion they use 10 feature channels (LUV color space,
gradient magnitude and quantized gradient channels),
which are used with two classifiers, SVM and Logis-
tic Regression with Elastic Net Regularization (LR).
The best results were achieved using LR, the re-
sults are presented as AUC, with a mean value of
0.98, slightly better than the results from (De Almeida
et al., 2015).
This paper will move away from the feature based
approaches used in most of the work described above,
instead a binary classification system using a CNN
will be presented. Focus will also be put into design-
ing a system, that is capable of delivering robust re-
sults, even on parking spaces that the system has not
been trained to recognize.
In section 3 a short description of CNN will be
presented and focus will then be on the proposed sys-
tem and its elements. Section 4 will describe the re-
sources, database, framework and hardware that was
used to conduct the work presented. Section 5 will de-
scribe the tests conducted and reports corresponding
results, while section 6 will discuss these and further
work that could be looked into.
3 THE PROPOSED SYSTEM
CNNs are effective at processing data in the form of
arrays, e.g. images, which makes it ideal for computer
vision tasks (Lecun et al., 2015). CNNs are based on
Multilayer Perceptrons (MLP), since these consist of
fully connected layers, they do not scale well with im-
age sizes. In contrast a CNN tries to take advantage of
the spatially local correlation in images, by stacking
the feature maps and only connecting each neuron to
a small region of the input volume, this is also called
the receptive field of the convolutional layer. For each
feature map, the weight and bias will be shared, this
is possible by assuming that a feature which is useful
to compute at one position, is also useful to compute
at another spatial position
In general it can be said that the convolutional part
of the method, creates a feature map, based on a fea-
ture extractor and the Neural Network part is the clas-
sifier and is used for updating the systems internal pa-
rameters, based on past experience.
A CNN normally consist of several convolutional
layers, an activation function, pooling layers and
lastly the classification layer, which is normally a
fully connected Neural Network.
Figure 1 shows an overview of the proposed CNN.
64
10
40
32
20
32
20
20
16
40
40
3
dense
64
2
dense
40
20
64
10
10
3x3
10
MaxPooling
PoolSize(2,2)
Strides(2)
MaxPooling
PoolSize(2,2)
Strides(2)
MaxPooling
PoolSize(2,2)
Strides(2)
3x3
3x3
5x5
5x5
7x7
Figure 1: Illustration of the proposed CNN.
The proposed CNN follows a standard simple ar-
chitecture, consisting of an initial convolutional layer,
followed by a max pooling layer and then repeatedly
two convolutional layers, followed by a max pooling
layer. The depth of the feature maps increases after
every max pooling layer, but reduces the spatial size.
The network has a total 198,576 parameters and all
the weights in the network are initialized randomly
while Glorot Uniform is used as initialization in all
layers.
Convolutional Layer. As explained above, each
convolutional layer consist of stacked feature maps,
these are created by convolving a kernel over the in-
put, together with the neurons parameters (weight and
bias). The depth of the convolutional layer is the
amount of feature maps that are stacked. As can be
seen on Fig. 1, the proposed system starts with a con-
volutional layer with an ouput having a depth of 16
Parking Space Occupancy Verification - Improving Robustness using a Convolutional Neural Network
313

and then increases the depth in the later layers, as the
spatial size of the feature map decreases. As the size
of the feature map decrease, the kernel size is also re-
duced, the stride for the kernels is always 1 and 1 pixel
zero-padding is used at each convolutional layer.
In the early layers a CNN normally detects simple
features, such as edges, then corners. In the later lay-
ers, the network starts to learn more complex features,
which might seem abstract to the human eye.
Activation Function. CNNs are constructed of
neurons, these have learnable weights and biases and
can be expressed as the linear function:
y = w · x + b (1)
Where w is the weight, x the input and b is the
bias. The activation function is an optional part of the
nodes, it introduces a non-linearity to the output of
the node, which is important in order to not create a
linear decision boundary. The proposed system uses
Recified Linear Unit (ReLU) as the activation func-
tion, which can be expressed as:
f (x) = max(0, x) (2)
ReLU, is used since it is computational efficient,
resulting in less training time. It doesn’t have an is-
sue with vanishing gradients and has shown to greatly
accelerate convergence (Glorot et al., 2011).
Pooling Layer. A pooling layer is added between
every second convolutional layer. The function of it,
is to reduce the spatial size and thereby reduce the
amount of parameters. This also helps to control over-
fitting. The reasoning behind it, is that the exact po-
sition of a found feature is not as important, as the its
position relative to other features are. The proposed
system uses max pooling with a 2x2 filter and a stride
of 2.
Optimization. The last part of the network, is the
fully connected Neural Network followed by a loss
layer. The fully connected layer performs classifica-
tion while the loss layer tries to find the error. The
idea is that the network learns by its mistake and then
updates the parameters, weights and bias, throughout
the system.
The proposed system uses softmax at the output
layer and Cross-entropy to calculate the error, which
is then used by backpropagation in order to calculate
the gradient for each weight. Lastly gradient descent
is used to compute the changes that needs to be ap-
plied to the weights throughout the network, before
starting over. Choosing a correct learning rate can be
essential, a higher learning rate results in faster learn-
ing, but it might not end up at the ultimate minimal
loss. choosing a too low value can result in very slow
convergence, while a too high value can result in os-
cillation (Wilson and Martinez, 2003).
In this case AdaGrad is used to calculate the gra-
dient descent. AdaGrad is a modified version of
Stochastic Gradient Descent, which updates the pa-
rameters individually by using different learning rates
for every parameter. When using Adagrad the learn-
ing rate needs to be initialized at start, for this system
it has been set at a value of 0.0001. The learning rate
is then updated throughout training at every time step
t and based on the parameters past computed gradient.
The weakness with using AdaGrad is, that since it
automatically updates the learning rate, it continously
becomes smaller and the system might therefore learn
slower or stop learning altogether. Compared to e.g.
AdaDelta it is more robust to the initial learning rate,
while converging is close to the same.
The minibatch size was set to 128, epoch size was
set to all the sample in the training set. In order to val-
idate the system while training, the training set was
split, such that 1/6 of the images was used as a vali-
dation set, the system ran for a total of 500 epochs.
Data augmentation was also introduced, in order
to get more value out of the data and at the same
time introduce a bit of distortion into the data. Data
augmentation can have positive effects on both ac-
curacy and reduce overfitting, as explained in (Glo-
rot et al., 2011) and (Simard et al., 2003). For this
system both horizontal and vertical flipping was in-
troduced, together with both vertical and horizontal
shifting. Some slight rotation of the images was also
used.
4 RESOURCES
This section will look at the resources used in the
project, this involves the database and the framework
used.
4.1 Database
The PKLot database that was introduced by (De
Almeida et al., 2015), will be used for this work. The
reason for this, is that it provides a basis for com-
parison. This database consists of 12.417 images of
the three parking areas, captured at a resolution of
1280x720 px. In total there is 695.900 images of
parking spaces captured throughout the day and in
three weather conditions, sunny, rainy and cloudy.
The ground truth of the parking spaces is available
VISAPP 2017 - International Conference on Computer Vision Theory and Applications
314
as an XML file for each image of the parking area.
It contains information about the state of the parking
spaces and their pixel location and size.
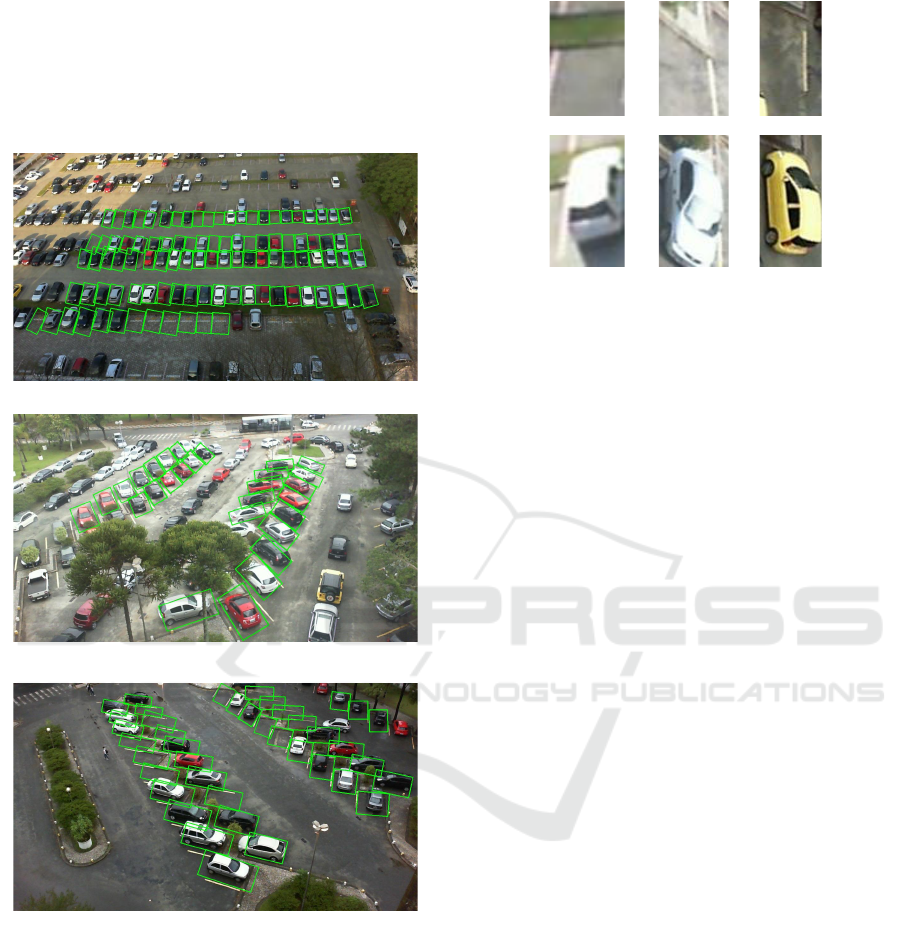
An example of the three parking areas, together
with bounding boxes for the segmented parking
spaces, can be seen in Fig. 2.
(a)
(b)
(c)
Figure 2: The three parking areas and their segmented
spaces shown: a) PUCPR b) UFPR04 and c) UFPR05.
For each image, chosen parking spaces have been
labeled. Each parking space have also been seg-
mented and rotated, such that they match each other.
As the focus of the work presented here, is to ver-
ify the vacancy of the parking spaces and in order to
be able to compare the systems, these images will be
used.
Examples of segmented images, showing both oc-
cupied and vacant parking spaces can be seen in Fig.
3.
Figure 3: Example of the segmented images of both occu-
pied and vacant parking spaces.
Before being fed to the CNN, the segmented im-
ages are all scaled to 40x40 px and normalized, this
is done by simply dividing each RGB pixel value by
255.
Together with the PKLot database follows guide-
lines for how the training- and testing set should be
created, they suggest dividing them 50/50 for each
parking area. They also recommend having images
captured the same day in the same set, such that the
same car is not used for both training and testing.
These guidelines have been followed, such that the
achieved results are comparable to the ones presented
in (De Almeida et al., 2015).
4.2 Framework
As explained earlier, CNNs have become an increas-
ingly popular topic, which have resulted in a plethora
of readily available frameworks. The most popular
include TensorFlow by google, CNTK by Microsoft,
Theano and Keras.
To realize the system described above, it has been
chosen to use Theano combined with Keras as they
support python bindings, allowing for rapid prototyp-
ing (Theano Development Team, 2016). Theano is a
library made for numerical computations and seam-
lessly uses the GPU, while Keras is a Neural Network
library, capable of running on top of both Theano and
TensorFlow which adds support for CNNs in Theano.
4.3 Hardware
The computer used for the tests, described in the next
section, had the following specifications:
• Ubuntu 16.04 LTS
• Intel Core i7-860 @ 3.2 GHz
• NVIDIA GTX 780
• 8 GB RAM
Parking Space Occupancy Verification - Improving Robustness using a Convolutional Neural Network
315
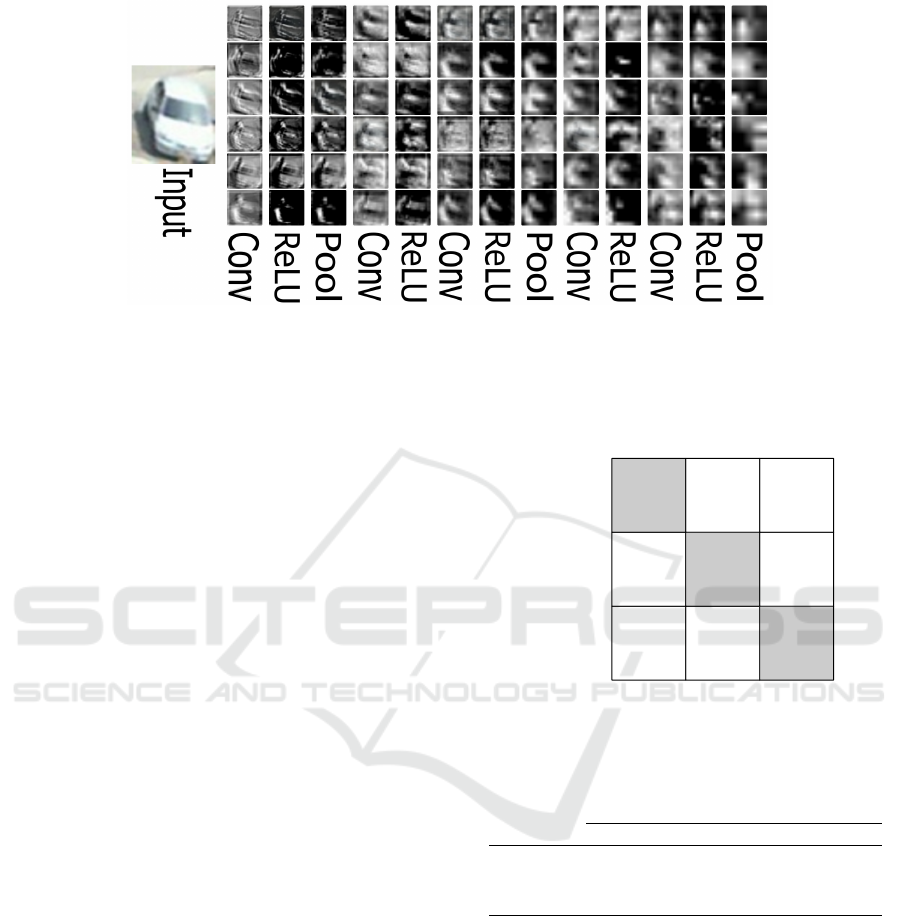
Figure 4: The CNNs activations throughout the system, when given the input image on the left. For each layer the first six
feature maps are illustrated.
5 EXPERIMENTAL RESULTS
As described above the system have been trained and
tested on the PKLot database. This section will look
at the results achieved during testing.
Figure 4 illustrates the activations of the six first
feature maps in each layer throughout the system,
when given the segmented image of an occupied park-
ing space shown on the left as input. As can be seen
the first layers are still recognisable as they work as
an edge detector, while the later layers are hard to in-
terpret.
Robustness of the System. In order to test the ro-
bustness of the system, it have been trained on the
individual parking areas and then tested on both the
same parking area and on parking areas that have not
been seen.
The accuracy can be seen in Fig. 5, as can be seen,
when training and testing on the same parking area,
the accuracy is in all cases above 99.70 %. The lowest
accuracy achieved is 95.45 % when training on the
UFPR05 and testing on UFPR04.
The robustness of the system will be seen as how
well the system performs, when being tested on park-
ing areas that it was not trained on. This means that
a margin will be defined as being the difference be-
tween the accuracy achieved when testing on the same
parking area, and the accuracy when tested on the two
unseen parking areas. The robustness will then be
the average of these margins, with lower percentages
showing a more robust system.
Applying this to the results achieved in (De
Almeida et al., 2015), using the highest accuracy re-
gardless of the method used, reveals an average mar-
gin of 11.95 %.
UFPR04 UFPR05 PUCPR
UFPR04
99.70 % 95.46 % 96.91%
UFPR05
95.96 % 99.76 % 96.72 %
PUCPR
98.70 % 97.30 % 99.90 %
Training
Testing
Figure 5: The results of the test, when training and testing
on separate parking areas.
Table 1: Comparison of error rate, when training and testing
on the same parking area.
P. De Almeida Proposed CNN
PUCPR 0.39 % 0.10 %
UFPR04 0.36 % 0.30 %
UFPR05 0.70 % 0.24 %
Applying the same method on the results achieved
by the proposed system, reveals an average margin of
2.96 %. The system has therefore shown to be signif-
icantly more robust than the competing system.
Table 1 shows a comparison of the error rate be-
tween (De Almeida et al., 2015) and the proposed
system, when they have been trained and tested on
the same parking area. As can be seen, the proposed
system greatly improves the results on especially the
PUCPR and UFPR05 parking area.
Overall Accuracy of the System. In order to get
a feeling of the systems overall performance, it has
VISAPP 2017 - International Conference on Computer Vision Theory and Applications
316
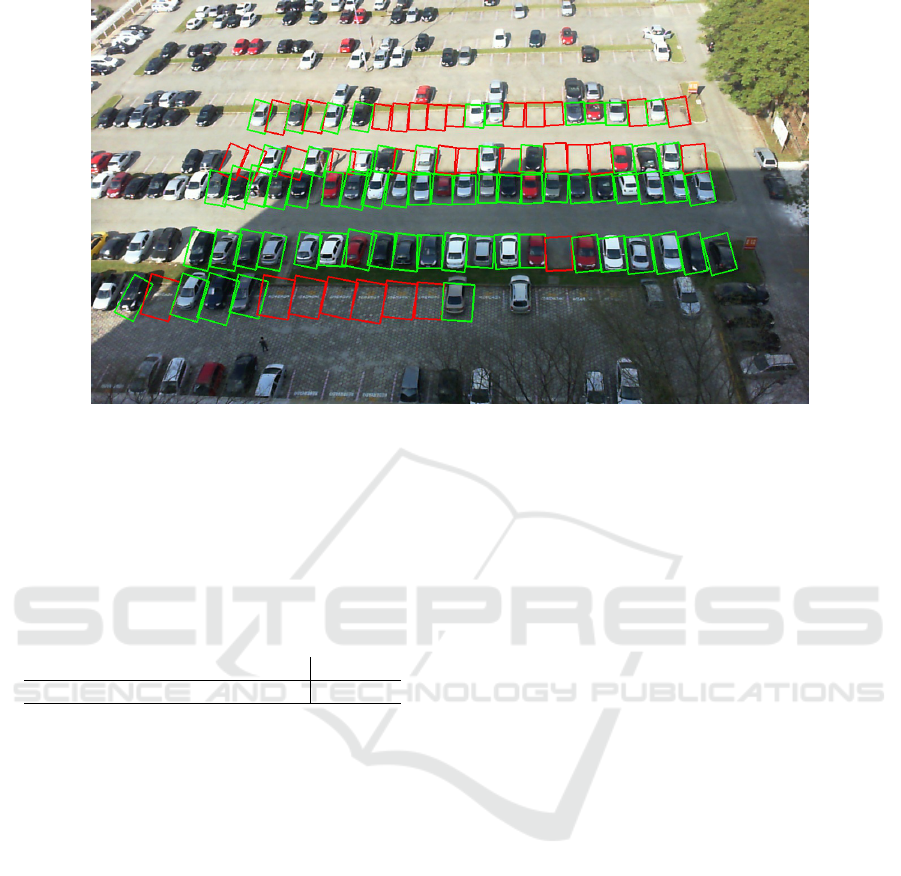
Figure 6: An example of a classification performed on an image from the PUCPR parking area. Green being a occupied
parking space and red a vacant parking space.
been trained on all the available training data. It has
then been tested on the training data from the three
parking areas individually and all the available testing
data.
The result from this test can be seen in table 2.
Table 2: Training on all the parking areas and testing on the
different parking spaces and all of them.
UFPR04 UFPR05 PUCPR All
99.74 % 99.20 % 99.88 % 99.71 %
All of the conducted tests, have an accuracy above
99 %, with the overall accuracy being 99.71 %.
An example of the classification can be seen on
Fig. 6, the example shows the PUCPR parking area
with corresponding bounding boxes, red being vacant
and green occupied parking spaces. Only parking
spaces with metadata created by (De Almeida et al.,
2015) have bounding boxes.
6 DISCUSSION
One of the more difficult tasks in parking space verifi-
cation, is to design a system that is able to perform re-
liably, when shown new parking spaces compared to
what it was trained on. The goal have been to design
a system that is robust and can deliver good perfor-
mance when being tested under there circumstances.
This paper has introduced a system, based on a
Convolutional Neural Network, that is able to verify
the vacancy of a parking space.
The proposed CNN has shown promising perfor-
mance in these cases, with a robustness margin of
2.96 %, which is about 4 times better than previous
efforts. It have other than that, shown high accuracy
when introduced to new parking spaces, with the low-
est accuracy achieved being 95.45 % and the highest
98.70 %.
Besides this the system have shown to perform
well under different illuminations, as the results when
training the system on all of the training data have
shown. During these tests the accuracy was all above
99 %, with an overall accuracy at 99.71 %, when test-
ing on all of the testing data.
6.1 Future Work
The PKLot database used in this work, does not pro-
vide images at dusk or night time and it could be inter-
esting to see how the system would handle these more
extreme situations. One prerequisite for this would
be, that the parking area were lit by e.g. street light
though.
Other improvements to the system could involve
automatic detection of the parking spaces, as this
would ease the process of installing the system at a
new location. One method to do this, could be by
assuming all parking spaces are bound by two easy
identifiable lines and are parallel to each other.
REFERENCES
Ahrnbom, M., Astrom, K., and Nilsson, M. (2016). Fast
classification of empty and occupied parking spaces
using integral channel features. In The IEEE Con-
Parking Space Occupancy Verification - Improving Robustness using a Convolutional Neural Network
317

ference on Computer Vision and Pattern Recognition
(CVPR) Workshops.
Baroffio, L., Bondi, L., Cesana, M., Redondi, A. E., and
Tagliasacchi, M. (2015). A visual sensor network for
parking lot occupancy detection in smart cities. In In-
ternet of Things (WF-IoT), 2015 IEEE 2nd World Fo-
rum on, pages 745–750.
Bhaskar, H., Werghi, N., and Al-Mansoori, S. (2011).
Rectangular empty parking space detection using sift
based classification. In VISAPP, pages 214–220.
De Almeida, P. R. L., Oliveira, L. S., Britto, A. S., Silva,
E. J., and Koerich, A. L. (2015). PKLot-A robust
dataset for parking lot classification. Expert Systems
with Applications, 42(11):4937–4949.
Funck, S., Mohler, N., and Oertel, W. (2004). Determining
Car-Park Occupancy from Single Images. Intelligent
Vehicles Symposium, 2004 IEEE, pages 325–328.
Glorot, X., Bordes, A., and Bengio, Y. (2011). Deep sparse
rectifier neural networks. In Gordon, G. J. and Dun-
son, D. B., editors, Proceedings of the Fourteenth In-
ternational Conference on Artificial Intelligence and
Statistics (AISTATS-11), volume 15, pages 315–323.
Journal of Machine Learning Research - Workshop
and Conference Proceedings.
Huang, C. C. and Vu, H. T. (2015). A multi-layer dis-
criminative framework for parking space detection. In
2015 IEEE 25th International Workshop on Machine
Learning for Signal Processing (MLSP), pages 1–6.
Huang, J. and You, S. (2016). Vehicle detection in urban
point clouds with orthogonal-view convolutional neu-
ral network. In 2016 IEEE International Conference
on Image Processing (ICIP), pages 2593–2597.
Klosowski, M., Wojcikowski, M., and Czyzewski, A.
(2015). Vision-based parking lot occupancy evalua-
tion system using 2D separable discrete wavelet trans-
form. Bull. Polish Acad. Sci. Tech. Sci., 63(3):569–
573.
Krizhevsky, A., Sutskever, I., and Hinton, G. E. (2012). Im-
ageNet Classification with Deep Convolutional Neu-
ral Networks. Adv. Neural Inf. Process. Syst., pages
1–9.
Lecun, Y., Bengio, Y., and Hinton, G. (2015). Deep learn-
ing. Nature, 521(1):436–444.
Masmoudi, I., Wali, A., Jamoussi, A., and Alimi, A. M.
(2014). Vision based system for vacant parking lot de-
tection: Vpld. In Proceedings of the 9th International
Conference on Computer Vision Theory and Applica-
tions (VISIGRAPP 2014), pages 526–533.
Masmoudi, I., Wali, A., Jamoussi, A., and Alimi, M. A.
(2016). Trajectory analysis for parking lot vacancy
detection system. IET Intelligent Transport Systems,
10(7):461–468.
Russakovsky, O., Deng, J., Su, H., Krause, J., Satheesh,
S., Ma, S., Huang, Z., Karpathy, A., Khosla, A.,
Bernstein, M., Berg, A. C., and Fei-Fei, L. (2015).
ImageNet Large Scale Visual Recognition Challenge.
International Journal of Computer Vision (IJCV),
115(3):211–252.
Shoup, D. C. (2006). Cruising for parking. Transport Pol-
icy, 13(6):479–486.
Simard, P., Steinkraus, D., and Platt, J. C. (2003). Best Prac-
tices for Convolutional Neural Networks Applied to
Visual Document Analysis. Proc. 7th Int. Conf. Doc.
Anal. Recognit., pages 958–963.
Sukhinskiy, I. V., Nepovinnykh, E. A., and Radchenko,
G. I. (2016). Developing a parking monitoring sys-
tem based on the analysis of images from an out-
door surveillance camera. In 2016 39th International
Convention on Information and Communication Tech-
nology, Electronics and Microelectronics (MIPRO),
pages 1603–1607.
Theano Development Team (2016). Theano: A Python
framework for fast computation of mathematical ex-
pressions. arXiv e-prints, abs/1605.02688.
True, N. (2007). Vacant parking space detection in static
images. University of California, San Diego.
Tschentscher, M., Koch, C., Konig, M., Salmen, J., and
Schlipsing, M. (2015). Scalable real-time parking lot
classification: An evaluation of image features and su-
pervised learning algorithms. In 2015 International
Joint Conference on Neural Networks (IJCNN), pages
1–8.
Valipour, S., Siam, M., Stroulia, E., and Jagersand, M.
(2016). Parking stall vacancy indicator system based
on deep convolutional neural networks.
Wilson, D. and Martinez, T. R. (2003). The general ineffi-
ciency of batch training for gradient descent learning.
Neural Networks, 16(10):1429 – 1451.
Zheng, N. and Geroliminis, N. (2016). Modeling and op-
timization of multimodal urban networks with lim-
ited parking and dynamic pricing. Transportation Re-
search Part B: Methodological, 83:36 – 58.
VISAPP 2017 - International Conference on Computer Vision Theory and Applications
318
