
Graph Navigation for Exploring Very Large Image Collections
Kai Uwe Barthel and Nico Hezel
Visual Computing Group, HTW Berlin University of Applied Sciences, Wilhelminenhofstraße 75a, 12459 Berlin, Germany
{barthel, hezel}@htw-berlin.de
Keywords: Image Graph, Exploration, Browsing, Visualization, Navigation, Convolutional Neural Networks, CBIR.
Abstract: We present a new approach to visually browse very large sets of untagged images. In this paper we describe
how to generate high quality image descriptors/features using transformed activations of a convolutional
neural network. These features are used to model image similarities, which again are used to build a
hierarchical image graph. We show how such an image graph can be constructed efficiently. After
investigating several browsing and visualization concepts, we found best user experience and ease of usage
is achieved by projecting sub-graphs onto a regular 2D-image map. This allows users to explore the image
graph similar to navigation services.
1 INTRODUCTION
Searching for particular images in very large,
untagged image collections is not trivial and can be
very time consuming. As human perception is limited
to 20 to 50 unsorted images at a time, overview is
quickly lost if more images are shown. Due to this
fact most websites show about 20 images per page.
As most users only look at the first few pages of an
image search result, only a tiny fraction of the entire
search result is viewed. Most image search systems
do not offer the possibility to visually browse or
explore the entire image collection. While there has
been a lot of effort to improve content-based image
retrieval, there is not much support for exploratory
image browsing. This is true for image archives, as
well as for e-commerce applications.
2 RELATED WORK
For the Video Browser Showdown 2016
(Schoeffmann et al., 2014) we have proposed an
interactive video browsing system for finding video-
shots in an archive containing over 200 hours of
various BBC programs (Barthel, Hezel and
Mackowiak, 2016). No keywords were available,
only the usage of automatically generated features
and visual browsing techniques were allowed in this
competition. Our graph-based image browsing
approach obtained the best results in the video search
competition. In this paper we show how this idea can
be extended for exploring very large archives of
(untagged) images.
An overview of various visual browsing models
for image exploration was given by (Heesch, 2008).
If the total number of images is too high, pre-
calculated image similarity or distance tables cannot
be stored and a real time computation will be
impossible. Therefore image browsing techniques for
huge archives require an off-line preparation step.
Some authors use visual attributes to split images into
subsets. Others (Strong et al., 2010; Wang, Jia and
Hua, 2011) use techniques such as ISOMAP or self-
organizing maps to generate visually sorted
arrangements of search results. These approaches
help to get a better overview, but they suffer from
unequally positioned and overlapping images. In all
cases, only few images of the entire image set are
shown and there is no way to experience the rela-
tionships with other images. Graph-based techniques
such as Google Image Swirl are addressing this issue
by using image networks (Jing et al., 2010; Qiu,
Wang and Tang, 2013). However, image navigation
was rather difficult and only a fraction of the available
screen space was used. Meanwhile the Image Swirl
project was stopped. (Chen, Bouman and Dalton,
1999) proposed an image pyramid to explore image
collections. In (Barthel, Hezel and Mackowiak,
2015a) we have described how such an image
pyramid which allows combined image search and
visual navigation can be constructed efficiently even
for very large amounts of images. Our system
Barthel K. and Hezel N.
Graph Navigation for Explor ing Very Large Image Collections.
DOI: 10.5220/0006274804110416
In Proceedings of the 12th International Joint Conference on Computer Vision, Imaging and Computer Graphics Theory and Applications (VISIGRAPP 2017), pages 411-416
ISBN: 978-989-758-226-4
Copyright
c
2017 by SCITEPRESS – Science and Technology Publications, Lda. All rights reserved
411

achieved a superior visual sorting quality than the
other systems described above.
A demonstrator of our system using more than
four million stock images from Fotolia can be found
at www.picsbuffet.com (Figure 1). Image similarities
were calculated with a fused metric using the L1-
distance between the low-level visual feature vectors
and the cosine similarity of the image keywords. The
images were sorted using a hierarchical, torus-
shaped, self-organizing map (SOM), where every
place on a regular rectangular image map could be
taken by only one image.
Figure 1: picsbuffet.com allows users to visually browse
over four million images from the Fotolia stock agency.
SOMs or image pyramids project large amounts of
images onto a plane. With such a two-dimensional
projection, the complex relationships between all
images cannot be preserved. Another important
disadvantage of regular 2D-sortings is their inability
to handle changes of the image collection. Removed
images will result in holes in the image map. If new
images are added, a new sorting becomes necessary
which will change the previous order of the images.
Graph-based approaches are able to better
preserve the image relationships and can handle
changes of the image archive much easier. However
it is not clear how to visualize the “high-dimensional”
graph in such a way that it can easily be perceived and
navigated by the user. In (Barthel, Hezel and
Mackowiak, 2015b) we presented a scheme to
construct hierarchical image graphs. The graph was
constructed in such a way that similar images are
connected by edges and other related images can be
reached by navigating the edges of the graph. In order
to allow an easy visualization and navigation it is
desirable to have a regular graph with a constant
number of connections (edges) per image.
The graph was built in two steps. First all images were
sorted using a 2D-SOM. The positions of the sorted
images served as initial graph in such a way that every
image was connected with its four adjacent
neighbors. In a next step the graph was improved with
an edge swapping optimization.
Figure 2: Top left: the initial image graph is based on the
image position of the 2D-sorting, top right: edges are
swapped if this increases the total similarity.
Bottom: detail of an example of a final image graph.
We swap two non-touching edges if the sum of the
similarities increases with this swap, i.e. if
sim
AX
+ sim
EY
> sim
AE
+ sim
XY
(1)
(see Figure 2 top right). With each swap the total
similarity of the graph (the sum of the similarities of
all edges) increases. To speed up the swapping
procedure, we focus on edges with low similarity
values. The swapping is stopped when the
improvement gets too small.
Figure 3: A hierarchical graph is generated by successively
removing images with high edge similarities. If image A is
removed we reconnect the images B, C, D and E with two
new edges depending on the maximum of sim
BC
+ sim
DE
,
sim
BD
+ sim
CE
and sim
BE
+ sim
CD.
The last step of building the graph consists of
generating hierarchical versions of the lowest level
graph. For very similar images it is not necessary to
VISAPP 2017 - International Conference on Computer Vision Theory and Applications
412

display them all, a single image on a higher level of
the graph can represent the lower level images.
Reducing the graph is achieved by removing vertices
(images) from the graph that are very similar to their
connected neighbors (see Figure 3). For each
hierarchy level we remove three-quarters of the
images, as this corresponds to a resolution reduction
by a factor of two in each direction in the 2D case.
Graph navigation concepts are very challenging,
because they either confront the user with too many
options/dimensions of the graph or confuse the user
with an unclear overlapping 2D-projection. We
present an approach where a subset of images is
successively extracted from the graph and arranged
onto a 2D-surface while preserving the order of the
previously displayed images. This approach creates
“an endless map” and reduces the amount of
dimensions the user has to deal with, but still permits
maintaining the complex inter-image relationships.
3 PROPOSED SYSTEM
As mentioned in the previous section, visual
exploration or visual browsing of images requires
three associated problems to be solved:
1. Semantic Image Features: In order to describe
image similarities well, “high quality” image
features and a suitable metric are crucial. Image
similarities calculated from these features need
to be very close to the similarities the user
perceives. In addition, the features should be
very compact in size to handle very large image
sets.
2. A hierarchical image graph needs to be
constructed. Similar images should be
connected and other images should be
accessible by traversing the graph. Lower layers
of the graph should connect very similar images
while higher layers should connect less related
images. The different hierarchical levels
represent a level of detail mechanism.
3. Graph Visualization and Navigation: The
images of the graph should be displayed in such
a way they can easily recognized by the user.
Navigation to other related images should be
natural and obvious.
3.1 Generating Semantic Features
In (Krizhevsky, Sutskever and Hinton, 2012) it is
shown that convolutional neural networks are not
only able to achieve high accuracy rates regarding
image classification tasks, but also that the produced
activations of a hidden layer can serve as good feature
vectors in the context of image retrieval. Typically,
convolutional neural networks are trained with
example images to predict semantic categories. For a
trained network the different layer activations
represent different abstraction levels, depending on
their depth in the network. Activations produced by
earlier layers mainly contain primitive visual features
such as colors or patterns, while deeper layers
represent semantic information (Razavian et al.,
2014). Comparing the raw image pixels of images
leads to bad image retrieval results. On the other
hand, the output categories of a neural network
trained with a different target set of categories do not
contain the appropriate categories to perform well in
general image retrieval tasks. However, the
intermediate layers of the network can be seen as
abstract representations of the visual content, and are
therefore less dependent on the categories/labels of
the trained network.
Training convolutional neural networks takes a lot
of time, even if powerful computer hardware is used.
However, existing trained networks can be reused for
feature extraction. In order to determine how to
generate good feature vectors, we tested the fully
connected layers of selected state-of-the-art convolu-
tional neural networks regarding their image retrieval
quality. The tested models were chosen by their
classification accuracy and their diversity. The
networks were trained using the ILSVRC2012 data
set (Russakovsky et al., 2015) or the entire ImageNet
dataset. To evaluate the retrieval quality, we have
used a test set with 1000 images and 100 categories.
The images were manually labeled. Neither the ima-
ges nor the categories are part of the ImageNet set.
We obtained best results using the Deep Residual
Learning Networks from (He et al., 2016). The 2048
activations before the fully connected layer of the
ResNet-200-network were taken as initial feature
vectors. By applying a L1-normalization of these
activities followed by a principal component analysis
we could improve the image retrieval quality and
additionally compress the feature vectors to only 64
dimensions. These remaining values were scaled and
stored as 64 byte values. Evaluating different metrics
showed that the simple L1-distance provided the best
mean average precision values.
3.2 Building the Image Graph
Before building an image graph a quality measure of
the graph has to be defined. For a non-hierarchical
Graph Navigation for Exploring Very Large Image Collections
413
graph the following conditions are to be met:
a) The path between any two images should be as
short as possible. (This implies that the graph
needs to be connected.)
b) The number of connections per image should
not be too high or too low.
c) Connected images should be very similar.
As the definition of a general optimization rule is
quite difficult and it is not clear how the requirements
a, b and c should be weighted, we decided to keep the
number of connections per image constant. In
addition, the requirement a) was ignored, however
checks were performed to guarantee that the graph
stays connected.
Compared to the graph-building process
described in (Barthel, Hezel and Mackowiak, 2015b)
we modified the algorithm in three important aspects.
Applying a random edge swapping approach
helps to find suitable image networks. However the
quality of the networks depended very much on the
initial arrangement of the SOM.
A first modification was to omit the initial SOM-
sorting. Instead of building an initial graph according
to the SOM-neighborhoods, we started with a random
graph where every image was connected to four other
images.
Another effect was, that the overall quality of the
image graphs generated by the edge-swapping
algorithm strongly varied depending on the order in
which possible swaps were tested. This signifies that
the optimization process got stuck in local minima.
By modifying equation (1) from
sim
AX
+ sim
EY
- sim
AE
- sim
XY
> 0
to sim
AX
+ sim
EY
- sim
AE
- sim
XY
> -
θ
t
(2)
with
θ
t+1
=
βθ
t
and
β
< 1
we realized a graph-building process which also
allows temporal degradations of the overall graph
quality. The initial value of the swapping threshold
θ
0
was set to the maximum similarity value. During the
optimization process, with each iteration the value of
θ
was gradually decreased to 0 by a factor
β
less than
one. This resulted in a process similar to simulated
annealing, and did lead to much better quality image
networks.
3.3 Visualizing and Navigating the
Graph as a Hierarchical 2D-Map
This section explains the projection of image sub-
graphs onto a 2D map/canvas. As described before, a
projection of the entire graph cannot preserve the
complex image relationships and will result in
similarity discontinuities on the 2D image map.
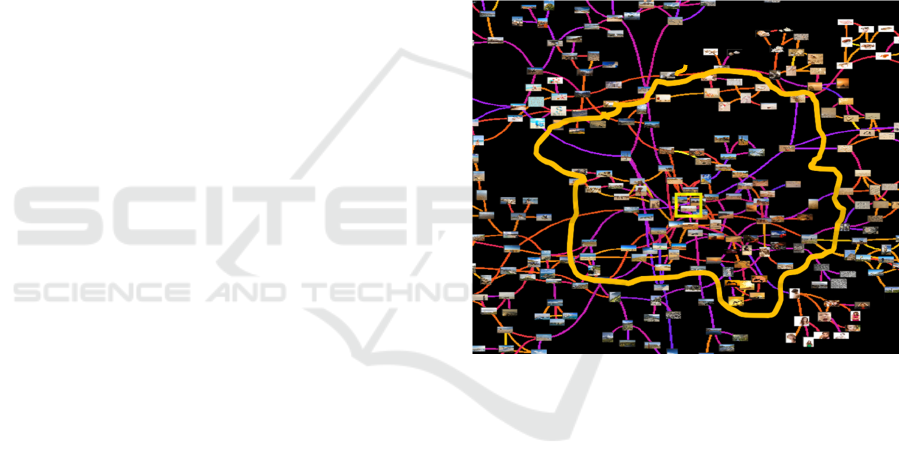
Our approach is to combine the graph navigation
with the 2D projection. By dynamically querying the
previously constructed image graph (Figure 4) and
projecting only the sub-graph, it is possible to
preserve the complex inter-image relationships for
display and navigation. Starting from an image in
focus, the connecting edges of that image are
recursively followed until the desired amount of
neighboring images has been retrieved.
Figure 4: Retrieving a sub-graph from the image graph. All
images within a number of hops from a starting image
(surrounded in yellow) are retrieved.
In a next step these images are sorted with a SOM,
which maps the images according to their similarities
onto a regular 2D image map. The shown images may
not contain the images the user was looking for.
Therefore a user action is necessary to navigate to
other parts of the graph. This is achieved by dragging
the 2D-map such that the region where the searched
images are anticipated becomes visible.
Dragging the map will change the sub-graph to be
displayed (Figure 5 top). Previously displayed images
that remain in the view port keep their position. New
images (neighboring images in the inverse direction
of the dragging) are retrieved and are visually sorted
and added to the map, so that they will be positioned
close to other similar images.
VISAPP 2017 - International Conference on Computer Vision Theory and Applications
414
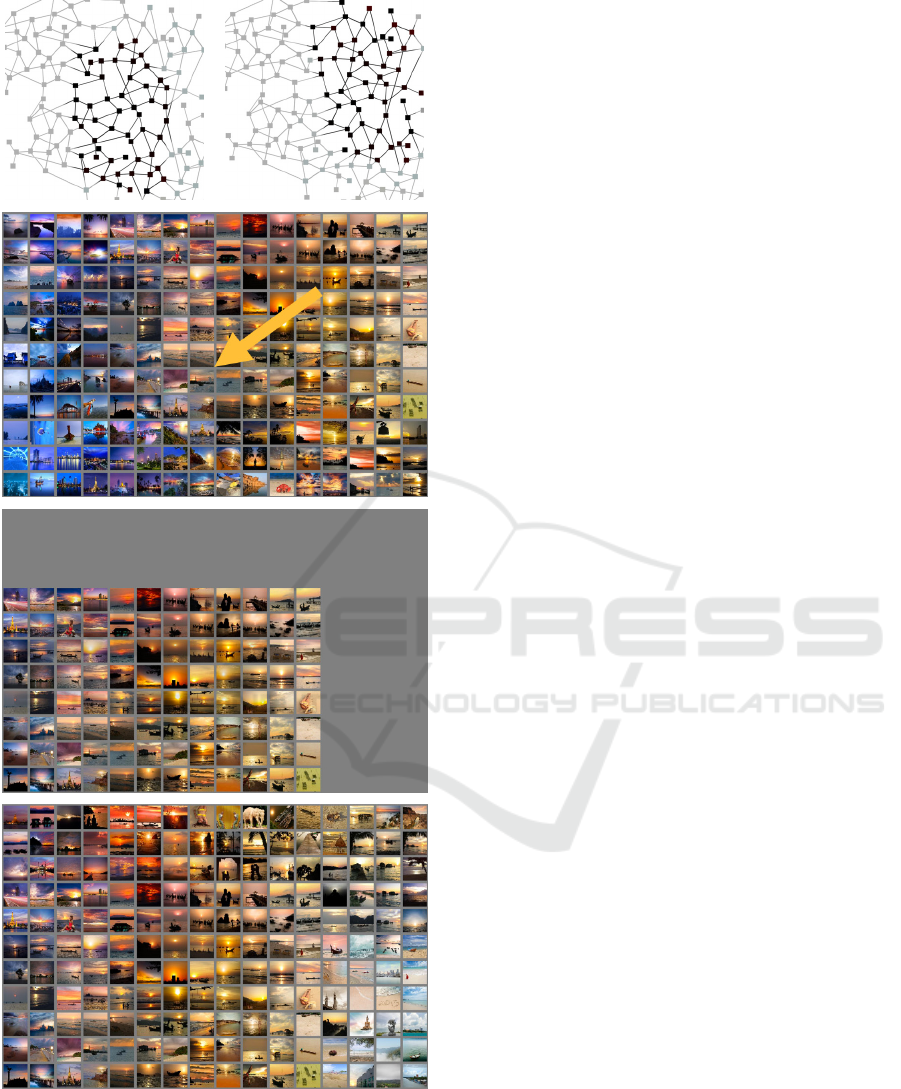
Figure 5: Navigating the graph. Dragging the map
(indicated by the arrow) will change the sub-graph (top) to
be displayed. Previously displayed images that remain in
the view port keep their position. Newly retrieved images
are visually sorted and added to the map, so that they will
be positioned close to other similar images.
The dragging of the map moves some images out of
the viewport and leaves some empty space on the
opposite side. The inverse direction of the drag
movement indicates the images of interest and
instructs the system to retrieve their neighboring
vertices. Images that are already displayed or just
have been moved out of the viewport are ignored.
The sorting of the newly retrieved images is
achieved by mapping the new images to the most
suited empty places, which is defined by the highest
surrounding accumulated image similarities. This
sorting again is performed using a SOM, however the
positions of the previously displayed images remain
unchanged.
Figure 5 shows an example of the graph
navigation by dragging the canvas. If the number of
retrieved images of a sub-graph is chosen to be larger
than the number of images that can be seen in the
viewport, then the “newly” revealed images can be
pre-sorted. This will give the impression as if a large
continuous map was available. If it is not clear in
which direction the searched images may be found,
the user may zoom out to get an overview. In this case
the closest sub-graph of the next hierarchy level needs
to be selected and displayed/mapped. In order for the
user not to get lost, in this case a smooth transition
between the old map and the new map needs to be
shown.
In order to emphasize a realistic navigation
experience, previous arrangements have to be cached
for some time. If a user decides to navigate back to a
previous position, the image arrangement should be
the same as before.
4 EXPERIMENTS AND
CONCLUSION
We have implemented a prototype of the new image
browsing system, which will be demonstrated at the
VISIGRAPP conference. The user interface and
experience is very similar to our picsbuffet image
browser (see Figure 1). However there are much less
abrupt changes of image concepts and the navigation
makes it quite easy to find images by purely browsing
the image graph/map. A demo implementation can be
found at www.visual-computing.com.
As the entire image graph is stored, the adaptation
to a user interaction can be performed very quickly.
The only operations which need to be performed are
the retrieval of the connected images and the partial
sorting of the new images. Both steps can be done
very efficiently in a fraction of a second.
Graph Navigation for Exploring Very Large Image Collections
415

If new images are to be added to the graph, this
can be achieved by searching four very similar
images and connecting them to the new image. This
will change the number of image links for the
connected images, however this does not pose a
severe problem because the visualization process can
cope with varying numbers of connections per image.
This is also true if images are removed from the
collection. For an image which is to be removed, all
its connections have to be removed as well. If the
image collection has undergone substantial changes,
then it might be useful to reorganize/reoptimize the
entire image graph in order to keep the number of
connections per image constant.
Future work will focus on starting the visual
image exploration using keywords. If keywords are
available for the images then it is very easy to use a
keyword search to directly access the most interesting
sub-graph for a particular query. Currently we are
working on enabling a keyword search also for
untagged images by determining representing feature
vectors for typical keywords. These feature vectors
can then be used to find the region of the graph with
the most appropriate images.
REFERENCES
Razavian, A., Azizpour, H., Sullivan J., Carlsson, S., “CNN
Features Off-the-Shelf: An Astounding Baseline for
Recognition.”, In CVPR Workshops 2014, pp.512-519.
Barthel, K. U.; Hezel, N. and Mackowiak, R. (2015),
ImageMap - Visually Browsing Millions of Images.,in
Xiangjian He; Suhuai Luo; Dacheng Tao; Changsheng
Xu; Jie Yang and Muhammad Abul Hasan, ed., MMM
(2) , Springer, , pp. 287-290 .
Barthel, K., Hezel, N., Mackowiak, R., (2015b), “Naviga-
ting a graph of scenes for exploring large video
collections”. In 21st International Conference on Multi-
media Modelling 2015, Part II, Springer, pp. 418-423.
Barthel, K. U.; Hezel, N. and Mackowiak, R. (2015),
Graph-Based Browsing for Large Video Collections in
Xiangjian He; Suhuai Luo; Dacheng Tao; Changsheng
Xu; Jie Yang and Muhammad Abul Hasan, ed., 'MMM
(2)' , Springer, , pp. 237-242.
Chen, J.-Y.; Bouman, C. A. and Dalton, J. C. (1998),
Similarity pyramids for browsing and organization of
large image databases, in Bernice E. Rogowitz and
Thrasyvoulos N. Pappas, ed., 'Human Vision and
Electronic Imaging' , SPIE, pp. 563-575.
He K., Zhang X., Ren S., Sun J. (2016) Identity Mappings
in Deep Residual Networks. In: Leibe B., Matas J., Sebe
N., Welling M. (eds) Computer Vision – ECCV 2016.
ECCV 2016. Lecture Notes in Computer Science, vol.
9908. Springer, Cham.
Heesch, D., (2008), A survey of browsing models for
content based image retrieval. Multimedia Tools and
Applications archive Volume 40 Issue 2, November
2008, pp. 261 - 284.
Jing, Y., Rowley, H., Rosenberg, C., Wang, J., Zhao, M.,
Covell, M., (2010), In: IEEE International Conference
on Multimedia and Expo, 2010, p 267.
Krizhevsky, A.; Sutskever, I. and Hinton, G. E. (2012),
ImageNet Classification with Deep Convolutional
Neural Networks., in Peter L. Bartlett; Fernando C. N.
Pereira; Christopher J. C. Burges; Léon Bottou and
Kilian Q. Weinberger, ed., 'NIPS' , pp. 1106-1114 .
Qiu, S.; Wang, X. and Tang, X. (2013), Visual Semantic
Complex Network for Web Images., in 'ICCV' , IEEE
Computer Society, , pp. 3623-3630 .
Razavian, A. S., Azizpour, H., Sullivan, J., Carlsson, S.,
“CNN Features Off-the-Shelf: An Astounding Baseline
for Recognition.”, CVPR Workshops 2014, pp. 512-
519.
Russakovsky, O.; Deng, J.; Su, H.; Krause, J.; Satheesh, S.;
Ma, S.; Huang, Z.; Karpathy, A.; Khosla, A.; Bernstein,
M. S.; Berg, A. C. and Li, F.-F. (2015), 'ImageNet
Large Scale Visual Recognition Challenge.', Interna-
tional Journal of Computer Vision 115 (3), pp. 211-252.
Schoeffmann, K.; Ahlstroem, D.; Bailer, W. and Cobarzan,
C. (2013), 'The Video Browser Showdown: a live
evaluation of interactive video search tools',
International Journal of Multimedia Information
Retrieval, Springer Verlag London , pp. 1-15.
Strong, G.; Hoque, E.; Gong, M. and Hoeber, O. (2010),
Organizing and Browsing Image Search Results Based
on Conceptual and Visual Similarities.,
in George
Bebis; Richard D. Boyle; Bahram Parvin; Darko
Koracin; Ronald Chung; Riad I. Hammoud;
Muhammad Hussain; Kar-Han Tan; Roger Crawfis;
Daniel Thalmann; David Kao and Lisa Avila, ed., 'ISVC
(2)' , Springer, pp. 481-490 .
Wang, J.; Jia, L. and Hua, X.-S. (2011), 'Interactive
browsing via diversified visual summarization for
image search results.', Multimedia Syst. 17 (5), pp. 379-
391.
VISAPP 2017 - International Conference on Computer Vision Theory and Applications
416
