
Audio-visual Cues for Cloud Service Monitoring
David Bermbach and Jacob Eberhardt
Information Systems Engineering Research Group, Technische Universit
¨
at Berlin, Berlin, Germany
Keywords:
Cloud Services, Monitoring, Quality of Service.
Abstract:
When monitoring their systems’ states, DevOps engineers and operations teams alike, today, have to choose
whether they want to dedicate their full attention to a visual dashboard showing monitoring results or whether
they want to rely on threshold- or algorithm-based alarms which always come with false positive and false
negative signals. In this work, we propose an alternative approach which translates a stream of cloud moni-
toring data into a continuous, normalized stream of score changes. Based on the score level, we propose to
gradually change environment factors, e.g., music output or ambient lighting. We do this with the goal of
enabling developers to subconsciously become aware of changes in monitoring data while dedicating their
full attention to their primary task. We evaluate this approach through our proof-of-concept implementation
AudioCues, which gradually adds dissonances to music output, and an empirical study with said prototype.
1 INTRODUCTION
Modern cloud-based enterprises increasingly follow
the you build it, you run it paradigm where small
teams of software engineers no longer only develop
an application and then hand it over to other teams for
testing and operation. Instead, the developers are also
responsible for running the application, i.e., deploy-
ing and maintaining the system, so that their respon-
sibility shifts from providing a piece of code to pro-
viding a system with strict SLAs to their customers.
This is also referred to as DevOps (Bass et al., 2015).
While this has many advantages, it also confronts
developers with tasks that traditionally never were
theirs to do. A good example for this is monitor-
ing: While a traditional enterprise may have a ded-
icated operations team that devotes its full work-
force to closely observe and, where necessary, man-
age application state, this suddenly becomes a side
task for application developers – a burden they are
ill equipped to handle. Some of this complexity
can be alleviated through automation: threshold-
based mechanisms (e.g., Amazon Autoscaling
1
) or
machine-learning based approaches can take auto-
matic action to resolve issues (e.g., by spawning ad-
ditional VMs) or notify developers through alarms.
Still, automatic action cannot fully replace human
oversight and alarms are inherently limited by their
binary state – on or off – leading to a trade-off be-
1
aws.amazon.com/autoscaling
tween false positive and false negative alarm states.
In this paper, we propose a framework and ap-
proach that leverages the ability of the human subcon-
scious to detect deviations from a “normal” state. For
this purpose, we use cloud monitoring results to con-
trol various aspects of the developers’ environment,
thus, enabling them to subconsciously become aware
of faulty system states, e.g., through color changes
in ambient lighting. In contrast to traditional alarms,
these environment factors can often be changed grad-
ually so that, for lack of a binary decision, false pos-
itives and negatives become a thing of the past. Fur-
thermore, the likelihood of a signal moving from the
subconscious to a state of awareness highly depends
on the intensity and regularity of the signal as well
as the person’s current level of concentration (Vick-
ers, 2011), i.e., developers will in periods of full con-
centration only become aware of critical system states
whereas they will in periods of low concentration also
become aware of smaller issues.
For this purpose, we propose the following contri-
butions:
• MultiSense, a high-level framework and architec-
ture of a system that uses monitoring data to con-
trol environmental parameters.
• AudioCues, as an instantiation of MultiSense that
uses monitoring data to manipulate and create un-
obtrusive music which people may listen to while
working.
This paper is structured as follows: In sect. 2,
Bermbach, D. and Eberhardt, J.
Audio-visual Cues for Cloud Service Monitoring.
DOI: 10.5220/0006301804670474
In Proceedings of the 7th International Conference on Cloud Computing and Services Science (CLOSER 2017), pages 439-446
ISBN: 978-989-758-243-1
Copyright © 2017 by SCITEPRESS – Science and Technology Publications, Lda. All rights reserved
439

we will discuss basic literature on leveraging the sub-
conscious for presenting information to users. Then,
in sect. 3, we present MultiSense and discuss envi-
ronmental factors that could be controlled through it.
Next, in sect. 4, we present AudioCues and its proto-
typical implementation, describe how we use it to cre-
ate lounge-like music, and show up future extensions.
Afterwards, in sect. 5, we describe our evaluation, be-
fore discussing related work in sect. 6.
2 BACKGROUND
In this section, we will discuss based on literature
why audio as a non-disruptive information channel is
a good choice for observing cloud monitoring data as
we did in our AudioCues prototype (sect. 4).
Generally, monitoring of processes
2
can be done
in three distinct ways (Vickers, 2011): Direct moni-
toring (the focus of attention lies on monitoring a pro-
cess), Peripheral monitoring (the focus of attention
lies on another task, monitoring of a process is per-
formed passively and attention shifts in case of critical
system states), and Serendipitous-peripheral monitor-
ing (non-critical information is passively monitored,
the focus is on another task).
Direct monitoring requires the user’s attention at
all times and is thus a pull-based approach. Visual
dashboards and comparable data representations tied
to a screen are examples for technologies of this cat-
egory. Peripheral as well as serendipitous-peripheral
monitoring, in contrast, are push-based approaches,
that draw a user’s attention to the monitored process
only when necessary. Technologies enabling periph-
eral awareness, e.g., ambient lights or AudioCues, are
often referred to as peripheral displays.
Peripheral displays that use audio as primary
transmission mechanism while extending traditional,
non-peripheral monitoring systems, are called audi-
tory displays; the process of translating data into au-
dio signals is called sonification. They provide two
distinct advantages: First, information can be trans-
mitted to users without being disruptive or obtru-
sive (Jenkins, 1985; Weiser and Brown, 1997; Tran
and Mynatt, 2000). Second, auditory displays can in-
crease the bandwidth of computer-human interaction
by providing an additional channel for information
transmission (Vickers, 2011). This can also be seen
in the results of Barra et al. (Barra et al., 2001) who
could show that peripheral audio monitoring allows
users to extract meaningful information while not get-
ting distracted from their primary task as opposed to
2
Not limited to “technical”, OS-like processes.
visual displays where this is not the case (Maglio and
Campbell, 2000).
As auditory display, we can use speech, music,
sound effects, or any combination thereof. Speech, in
most contexts, carries foreground information and re-
quires more attention than non-speech audio (Mynatt
et al., 1998). Sound effects, e.g., traffic noise or bird-
song, are used by various systems (Barra et al., 2001;
Liechti et al., 1999). These sound effects are very
suitable to signal the occurrence of a (binary) event,
e.g., when a server has failed, or to provide unobtru-
sive ambient noise. The main advantage of sound ef-
fects is that users can identify the source of the event
if the acoustic cue is semantically related, e.g., the
sound of pouring a drink instead of a progress bar.
However, mapping a stream of values, e.g., as pro-
vided by cloud monitoring, to sound effects seems to
be difficult
3
. This is why we chose music as a medium
for our initial prototype: It offers more options for
manipulation than sound effects and can still enable
users to recognize the source of the event if an expla-
nation of the mapping of monitoring data to music is
provided (Lucas, 1994).
3 MULTISENSE
In this section, we will briefly recapitulate MultiSense
and its main components (Bermbach and Eberhardt,
2016) as well as discuss which environmental param-
eters can be controlled in which way.
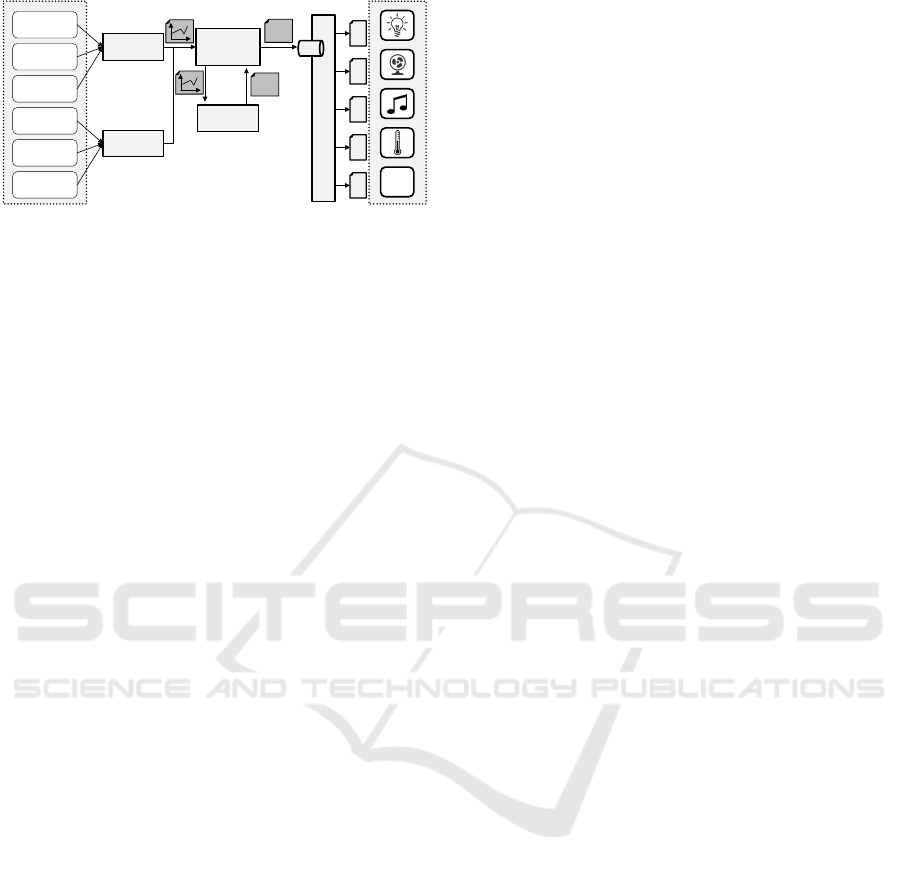
Architecture and Components: Generally, Mul-
tiSense has a sensor-actuator model comprises three
parts, two of which are external services that are inte-
grated through adapter mechanisms.
The first part (fig. 1 on the left) comprises our
metric producers. These can be any monitoring ser-
vices that produces data points for one or more met-
rics. Examples include open source systems, e.g.,
Ganglia
4
, custom solutions, or cloud services,e.g.,
Amazon CloudWatch
5
. Any data source accessible
through pull or push mechanisms can be used.
Within the second part, metric consumers peri-
odically poll their metric producer adapters for re-
cent monitoring data from the underlying services and
transform this stream of data points into a stream of
standard monitoring events. The stream is passed on
to metric monitors
6
which serve as some kind of in-
3
See also our discussion of control targets in sect. 3.
4
ganglia.info
5
aws.amazon.com/cloudwatch
6
Different metric monitors have no interdependencies as
they are each responsible for different metrics and parts of
the monitored system. This allows MultiSense to scale.
CLOSER 2017 - 7th International Conference on Cloud Computing and Services Science
440
Metric
Monitor
Metric
Consumer
Pub/Sub System
Metric
Analyzer
[0;100]
[0;100]
CPU
Utilization
Memory
Utilization
Disk I/O
Request
Latency
Failure Rate
…
Metric
Consumer
…
Metric Producers Control Targets
Figure 1: High-Level Architecture of MultiSense.
formation hub. For each registered metric, they have
a single metric analyzer which normalizes the events
of the stream on a range from 0 (normal) to 100 (crit-
ical). MultiSense does not make any assumptions re-
garding the implementation of metric analyzers – they
may implement everything from linear interpolation
to complex machine learning-based techniques. Nor-
malized scores are then sent to a pub/sub system.
The third part, the control targets, comprise phys-
ical and software systems, which are able to affect the
developer’s environment on a (preferably) continuous
scale, as well as the controllers which register for top-
ics of the pub/sub system and then send control com-
mands to their respective control targets based on re-
ceived events.
Control Targets: All control targets share some
basic commonalities: they do not have a binary state
(in fact, a continuum is preferable) and can be con-
trolled electronically. Furthermore, they all affect
how developers feel due to impressions on different
senses. The for our purposes most important senses
are sight and hearing but the sensory capacity of our
skin and the olfactory sense can also be leveraged. In
the following, we will briefly discuss which control
targets affect which senses in which way.
Hearing: Many people like to listen to music or
ambient noise at work. For music, we can have an
audio stream that we can manipulate, e.g., when lis-
tening to MP3 files, or we may also control the gener-
ation of the music, e.g., via MIDI signals and virtual
instruments as in our AudioCues prototype.
In case of audio streams, there are three basic tun-
ing knobs that we can use: Overall playback volume,
equalizer settings which are basically per-frequency
volumes (a simple way of adjusting would be to
gradually introduce a high-pass or low-pass filter),
and various kinds of audio effects, e.g., reverb, de-
lay, flanger, phaser, distortion, etc., which can be
mixed into the audio signal. The latter are typically
used with a dry/wet parameter which describes the
(volume-based) percentage of the signal that is routed
through the effect generator. In MultiSense, we could
assign a different effect for each input metric so that
developers will not only notice that something is “off”
but also where the problem is coming from.
When generating music through MIDI signals,
there are additional tuning knobs as we actually con-
trol the output signal. As new parameters, we can
introduce dissonances which we can vary in volume,
kind of dissonance (e.g., minor vs. major second),
or the number of concurrent dissonances (e.g., minor
second vs. minor second and tritone). As we control
individual channels, we can also adjust their respec-
tive volume, i.e., change the overall mix, change the
instrumentation, detune channels through pitch bend
signals, or add imprecision by shifting entire channels
or individual notes slightly in time. On a more global
level, we can change the tempo of playback, e.g., in-
crease tempo if the system is in a stress state, or affect
the “style” of music by changing the way in which we
assemble patterns and sounds.
Sight: Usually, people only notice things that they
are looking at. Still, sudden changes in the peripheral
vision, e.g., movement (Weiser and Brown, 1997),
will cause instant awareness as they are still processed
by the unconscious and, thus, move “from the periph-
ery of our attention, to the center, and back.” (Weiser
and Brown, 1997). For our purposes, movement is a
poor control target as there is no continuous “scale”
of movement: we become instantly aware of move-
ments in our peripheral vision or do not notice them
at all. This leaves us with lighting and the look and
feel of what is happening on the developer’s screen:
For lighting, we can adjust brightness, e.g.,
through dimmable lamps. Ambient lighting is par-
ticularly useful where we can control colors of in-
dividual or all lighting modules, the speed of color
changes, or the continuity of color changes (gradually
fading vs. sudden changes). In terms of program look
and feel, we can gradually change background colors
or text color of program windows and their title bars.
Feeling: Modern smart home appliances can eas-
ily be controlled over standard IT protocols. For in-
stance, we can affect temperature, air flow, or humid-
ity through heating systems, air conditioning, or fans;
air can be scented. There are virtually no limitations
to the range of usable devices.
4 AudioCues
In this section, we will give an overview of Au-
dioCues as an instantiation of MultiSense with spe-
cific auditory control targets. We will start by describ-
ing the basic functionality of AudioCues in sect. 4.1
before discussing the state of the implementation and
its limitations in sect. 4.2.
Audio-visual Cues for Cloud Service Monitoring
441
Bridge
Intro Part A Part A
3
Part A
2
Part B Part B
3
Part B
2
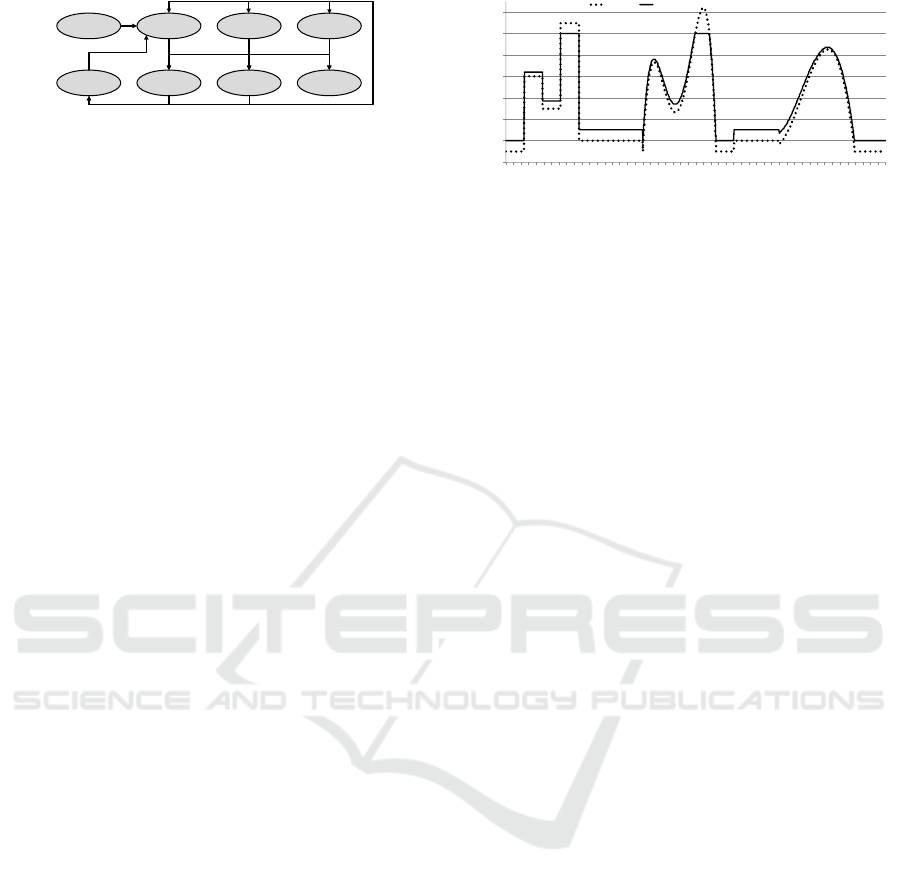
Figure 2: Sample Music Graph for AudioCues.
4.1 Basic Functionality
AudioCues focuses on the sense of hearing and is de-
signed to produce pattern-oriented music – likely can-
didates include lounge or other electronic music but
also Bach-inspired music could be realized. For this
purpose, we use a “music graph”, i.e., a directed graph
where each node contains information on the notes
and their instrumentation for short subsequences (typ-
ically patterns) of a piece of music. A player compo-
nent randomly iterates over the graph and schedules
the contents of the respective nodes for playback at
the appropriate time. To reduce the number of very
similar repetitions, our player implementation avoids
going “backwards”, i.e., playing the node sequence
A-B-A. See fig. 2 for an example of a music graph.
Beyond the information on notes and instrumenta-
tion, each node also contains information on the cor-
responding dissonance sequence. This dissonance se-
quence is scheduled for playback along with all other
entries of the node but a special flag informs the MIDI
scheduler to set its volume based on up-to-date infor-
mation from the corresponding metric monitor.
4.2 Limitation and Discussion
In terms of control targets, we currently support only
the volume changes for dissonances and play MIDI
signals. The same principle (and much of the proto-
type’s code), though, could be used for WAVE-based
signals. Additionally, using any of the discussed
MIDI-based control targets (e.g., instrument changes,
etc. – see sect. 3) should not require adding more than
a few lines of code to our implementation so that we
consider AudioCues a rather complete instantiation of
MultiSense for MIDI-based control targets.
Our implementation comprises all components
listed in figure 1 apart from the pub/sub system. The
prototype currently polls input data from Amazon
CloudWatch or a local generator component for test-
ing purposes; other monitoring solutions like Ganglia
or Nagios could be added by simply implementing a
client stub. We currently have implemented two met-
ric analyzers that are parameterized with maximum
and minimum values which are mapped 0 or 100 re-
spectively and interpolate linearly or quadratically.
The main disadvantage we see in AudioCues is
that building the music graphs necessary for a full
-20
0
20
40
60
80
100
120
50
100
150
200
250
300
350
400
450
Time%[s]
Metric
Score
Figure 3: Generated Metric Data and Resulting Score used
in our Evaluation.
workday, so as to avoid boredom and fatigue, is non-
trivial and time-consuming. Using one of the audio
stream-based control targets instead might be a more
feasible approach. Still, we found the event-based in-
teraction model of MIDI rather convenient and flex-
ible to use so that it is definitely worth a thought to
(mis)use MIDI as communication protocol for non-
MIDI control targets as well. Another solution could
be to analyze existing MIDI files for repetitive se-
quences and to generate the necessary instructions for
building a music graph from that information. Auto-
matically generating the dissonances track would be
relatively easy based on such an analyzed MIDI file.
Furthermore, the system may need to be calibrated
individually – i.e., it is likely to depend on the indi-
viduals where their personal thresholds of awareness
lie. To our knowledge this has not been answered in a
general way yet (Ishii et al., 1998) and, thus, requires
individual adjustments for a production system.
Finally, the metric analyzer components require
some insight into “normal” system states, i.e., what
are the values that correspond to scores of zero and
one hundred for each metric respectively. An estimate
for what is normal can be obtained through bench-
marking, e.g.,(Cooper et al., 2010; Bermbach and Tai,
2014; M
¨
uller et al., 2014), but obviously adds further
effort to the system setup.
5 EVALUATION
Our evaluation comprises three parts: First, we have
implemented AudioCues as a proof-of-concept and
published its code as open source (sect. 5.1). Sec-
ond, we have recorded a sample output of this sys-
tem and published the recording on SoundCloud and
YouTube, so that readers can easily verify themselves
that AudioCues in fact works (sect. 5.2). Third, we
asked a number of people to listen to that recording
and answer a few questions based on that to gain in-
sight into their perception of dissonances while work-
ing on a primary task (sect. 5.3).
CLOSER 2017 - 7th International Conference on Cloud Computing and Services Science
442

5.1 Proof-of-Concept Implementation
We implemented AudioCues as a research prototype
and made it available as open source
7
. Our proto-
type is implemented in Java 8, uses the AWS SDK
to connect to CloudWatch, and creates MIDI signals
through standard Java. AudioCues also plots each
observed metric over time using JFreeChart
8
. This
proof-of-concept implementation shows that it is in-
deed possible to create varying MIDI output based on
the current system state.
5.2 Recorded Output
To create a deterministic sample music output, we
have implemented a music graph where every node
has exactly one follower. Depending on current mon-
itoring state, the sample music adds tritone disso-
nances in different volumes which are easy to notice.
For the recording, we routed the MIDI output signals
of our tool through VST instruments of Cubase 5
9
.
We had already seen in test runs that our sys-
tem works with CloudWatch. To assert reproducibil-
ity in our evaluation, we thus created a stream of
cloud monitoring data artificially with metric values
between −10 and 110 (lower values are better as, e.g.,
in the case latency). These fake metric values were
then translated into normalized scores through linear
interpolation: 100 was mapped to a score of 100, −10
to a score of 0. Fig. 3 shows the created metric stream
and the resulting scores which we used for our eval-
uation. You can find a video with a recording of our
sample music graph based on the metric input from
figure 3 and the corresponding chart on YouTube
10
.
The interested reader can use the video to easily
verify that the output of our research prototype is able
to convey different system states through varying de-
grees of dissonance in its audio output.
5.3 Empirical Study
We did a small empirical study to better understand
whether AudioCues works not only for the authors but
also for other people, and whether the degree of con-
centration of people indeed influences how fast they
become aware of the dissonances in our test music.
For this purpose, we asked a group of 18 col-
leagues to complete a questionnaire on the audio file
from sect. 5.2. Specifically, test persons were given
7
github.com/dbermbach/audiocues
8
www.jfree.org/jfreechart
9
www.steinberg.de/en/products/cubase/start.html
10
youtu.be/gWJtGZOp3K0
the following instructions: Read some basic informa-
tion on the goal of our research project. Start working
on something else while playing the audio file. When-
ever you notice a change in the audio signal, answer
the following three questions: (i) When you noticed
the change, what was your estimated level of concen-
tration on a scale from one (not concentrated at all) to
ten (fully concentrated on something else), (ii) when
did you first notice the change, and (iii) when, in your
opinion, is the system again in a stable state? Test
persons were allowed to pause playback but were ex-
plicitly asked not to fast-forward or rewind the audio
file. We also chose not to tell our test persons that
there would be three “events” in the audio file.
Afterwards, we – who were familiar with the au-
dio file and the shape of figure 3 – also listened to
the audio file to identify the periods during which the
dissonances were hearable. We identified the disso-
nance intervals [25; 97], [183;281], and [368; 451] –
each in seconds of playback. We did this to calcu-
late the “awareness delay”, i.e., the time between the
interval start and the value reported by a test person.
Expected Results. We expected that sudden
changes (e.g., the first event in out test) will have
a lower awareness delay than slower, continuous
changes (e.g., the last two events in our test). We
also expected that the awareness delay for continu-
ous changes highly increases with the test persons’s
level of concentration
11
and that the awareness delay
for sudden changes also increases with the test per-
son’s level of concentration but is affected less than in
the case of continuous changes.
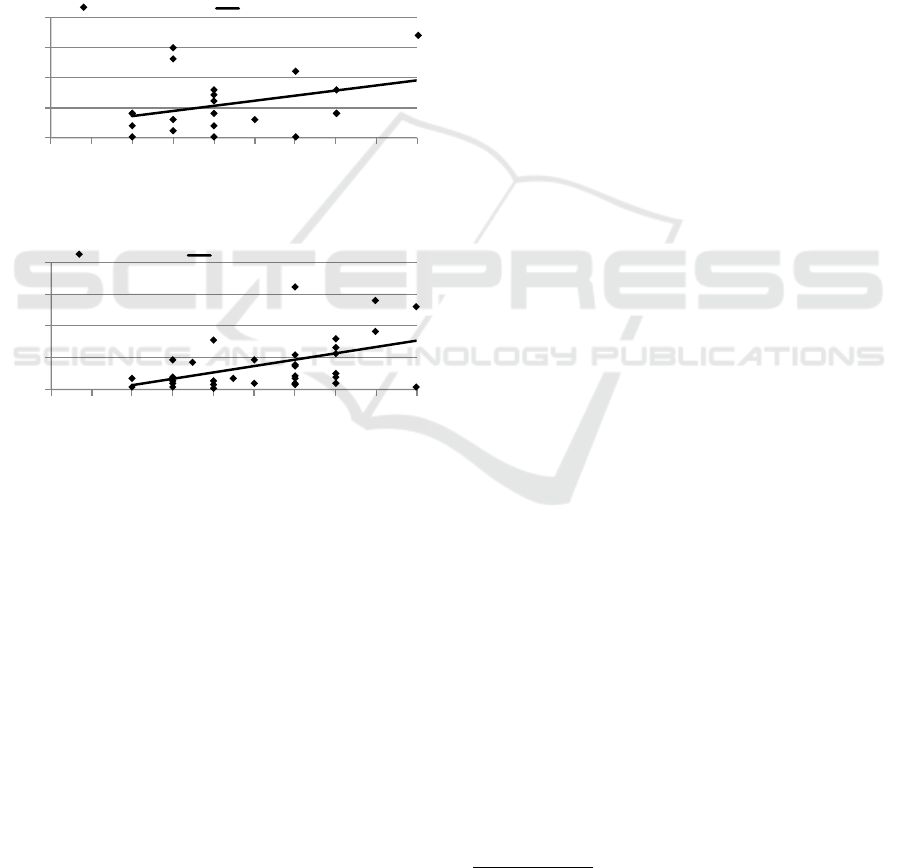
Actual Results. In our study, we could see our
expected results: Indeed, sudden changes had a lower
awareness delay than slower, continuous changes.
The first event had an average awareness delay of 5.5
seconds, whereas the second and third event had an
average awareness delay of 15.7 seconds. Here, we
see the only point for critique in the small sample size
(18 test persons). Regarding our other expectations,
the awareness delay indeed increased with the test
person’s level of concentration on some other task.
We cannot (and do not intend to) quantify this effect
but the results indicate that this seems to be the case.
Figures 4 and 5 show the awareness delay as a func-
tion of the individually estimated level of concentra-
tion for sudden changes (fig. 4) and slow, continuous
changes (fig. 5). We believe that the results are valid
even though the level of concentration was individ-
ually estimated since both full concentration and no
11
To avoid confusion: A high level of concentration
means that the test person is paying no attention to our au-
dio signal, instead devoting her full attention to some other
task.
Audio-visual Cues for Cloud Service Monitoring
443
concentration are individual values as well. This also
conforms to the findings of (Vickers, 2011).
All in all, these findings indicate that AudioCues
in fact works: Depending on the individual level of
concentration, people become aware of changes in
dissonance volumes after different awareness delays
and sudden changes create instant awareness. We be-
lieve that this is very useful in practice as DevOps
engineers will in periods of high concentration only
be interrupted by important events (i.e., sudden or ex-
tensive changes) whereas they are likely to instantly
become aware of small changes during periods of low
concentration. This, of course, needs to further analy-
sis which, however, is beyond the scope of this paper.
!
"
#!
#"
$!
# $ % & " ' ( ) * #!
+,--./0 +12314 56/.2 3073./-
Concentration
Time [s]
Figure 4: Awareness Delay as a Function of Concentration:
Sudden Changes.
0
20
40
60
80
1 2 3 4 5 6 7 8 9 10
Slow/ Starts Linea r/Trend
Concentration
Time [s]
Figure 5: Awareness Delay as a Function of Concentration:
Slow, Continuous Changes.
6 RELATED WORK
In this section, we will discuss related work starting
with approaches that directly relate to AudioCues be-
fore broadening the scope of the discussion.
AudioCues and Sonification: Sonification-based
process monitoring is used in many areas of appli-
cation, e.g., health care, industrial plants, environ-
mental awareness, or home monitoring (Fitch and
Kramer, 1994; Gaver et al., 1991; Rauterberg and
Styger, 1994; Hermann et al., 2003; Bakker et al.,
2010; Schmandt and Vallejo, 2003; Tran and Mynatt,
2000). In the early days of computing, auditory out-
put of computers has also been used for monitoring of
CPU activity (Vickers and Alty, 2003).
Later, some efforts were made to sonify log
data (Dzielak, 2014; Tarbox, 2008) and to enhance
debugging through an acoustic component (Jame-
son, 1994b; Jameson, 1994a; Finlayson and Mellish,
2005). These systems all transform static files, e.g.,
logs or source code, into a sequence of sounds which
does not qualify as background music.
Other approaches focus on live sonification of
data streams comparable to our MultiSense and Au-
dioCues: The ShareMon system (Cohen, 1994) raises
awareness of file sharing by using audio to notify
users of related events. The Peep system (Gilfix and
Couch, 2000) plays natural sounds to sonify network
state; this enables peripheral real-time network mon-
itoring. In the context of web servers, others propose
model-based sonification of HTTP requests using the
SuperCollider programming language (Ballora et al.,
2010; Hermann and Ritter, 1999) or playback user-
defined sound effects to notify web site creators of
visitors (Liechti et al., 1999). All of these approaches
trigger discrete sounds based on discrete input events.
They are disruptive due to their event-based character
and do not support a continuous output “scale”.
More closely related to our approach is Web-
Melody (Barra et al., 2001) which proposes to com-
bine sounds triggered by web server events with user-
selected music to support peripheral monitoring with-
out fatigue. Unlike AudioCues, however, which trans-
lates continuous changes in a data stream into grad-
ual changes of music, the WebMelody system trig-
gers predefined binary sound events and plays them
along with the music stream. WebMelody could en-
hance AudioCues by adding highly noticeable binary
alarms for select critical system states.
All in all, while there are alternative approaches
proposing auditory displays for system monitoring,
neither of these systems uses similar sonification tech-
niques as AudioCues or offers non-binary output.
Furthermore, all other approaches target a very spe-
cific data source for sonification and are, thus, miss-
ing the broader scope proposed through MultiSense.
MultiSense and Peripheral Displays: To our
knowledge, there is no broad platform comparable to
MultiSense
12
– neither as architectural concept and
framework as in MultiSense nor as a prototypical im-
plementation. However, there is some work on pe-
ripheral visual displays which have been proposed to
enable monitoring for a particular use case,e.g., Live
Wire (Weiser and Brown, 1997), Waterland, or Pin-
wheels (Dahley et al., 1998). These could be used as
alternative control targets in MultiSense.
Miscellaneous: There is a lot of ongoing research
on cloud monitoring; the focus, however, seems to be
on collection and analysis of data rather than on pre-
12
Early ideas on the MultiSense architecture have been
published as a poster (Bermbach and Eberhardt, 2016).
CLOSER 2017 - 7th International Conference on Cloud Computing and Services Science
444

senting the information to developers, e.g., (Kanstr
´
en
et al., 2015; Bermbach and Tai, 2014; Alcaraz Calero
and Gutierrez Aguado, 2015). There is a plethora of
real-time dashboards, e.g., Grafana
13
, which require
the user’s attention to observe the graphically pre-
sented data. To our knowledge, there is no dashboard
yet that considers using the subconscious or periph-
eral perception to transmit information to the user.
An alternative to MultiSense are systems that au-
tonomously decide when a alarm should be raised.
Threshold-based approaches, e.g., Amazon Au-
toScale, notify or take action as soon as a metric ex-
ceeds a specified threshold value. More advanced
techniques, e.g., based on machine learning (Islam
et al., 2012) or linear prediction models (Dinda and
O’Hallaron, 2000), reduce false positive or negative
alarms and are better equipped to deal with random
fluctuations around a static threshold. However, all
these approaches still force the developer to trade off
between timeliness of an alarm against the rate of
false negatives due to the binary nature of alarms.
Benchmarking, e.g., (Cooper et al., 2010;
Bermbach and Tai, 2014; M
¨
uller et al., 2014;
Bermbach and Wittern, 2016), can quantify quality of
a cloud system before deployment of an application.
While it cannot replace monitoring, it may be useful
for calibrating MultiSense and AudioCues.
7 CONCLUSION
In this paper, we have proposed a framework and ap-
proach that leverages the ability of the human sub-
conscious to detect deviations from a “normal” state.
To reach this goal, we use cloud monitoring data to
control various aspects of developers’ environments,
thus, enabling them to subconsciously become aware
of faulty system states, e.g., through color changes
in the ambient lighting or dissonances in the music
output. Existing approaches, in contrast, could only
express binary state changes (alarms) or required de-
velopers to dedicate their full attention to observing
monitoring data.
For this purpose, we started with a discussion of
the foundations of sonification, i.e., the process of
translating input data into audible signals, and came
to the conclusion that music is, indeed, a very able
transport medium for our purposes. Next, we intro-
duced MultiSense, a high-level architecture concept
and framework for manipulating various control tar-
gets in the surrounding environment of developers.
We also discussed three groups of different control
13
grafana.org
targets – hearing, sight, and feeling – and the differ-
ent ways in which these can be used to transmit a con-
tinuous stream of information on various cloud mon-
itoring metrics to a DevOps engineer. As the generic
MultiSense is, so far, only an architectural concept
lacking an implementation, we then presented Au-
dioCues. AudioCues is an instantiation of MultiSense
and continuously changes music output based on the
current state of cloud services. We also discussed the
AudioCues prototype which adds dissonances in dif-
ferent volumes to the music output depending on, e.g.,
Amazon CloudWatch data.
Afterwards, we evaluated MultiSense and, espe-
cially, its instantiation AudioCues in three different
ways: First, we demonstrated through our proof-of-
concept implementation that it is indeed possible to
build a system that adds dissonances in different vol-
umes to music output based on monitoring data. This
prototype is available on GitHub. Second, we cre-
ated a sample music track and had it played by our
prototype. Based on artificially injected monitoring
data, we recorded this output for readers to verify
themselves that they can distinguish different volume
settings for the dissonance track and, thus, gradually
become aware of changes in the system state. This
recording is available as an audio file on SoundCloud
and as a video on YouTube. Third, we asked a num-
ber of test persons to listen to this sample recording
while working on something else. Our results show
that people notice dissonances, albeit later if they are
fully concentrated on another task. This demonstrates
that our overall approach works: DevOps engineers
can use AudioCues for background monitoring and
will become aware of severe changes right away while
noticing minor changes only in periods of low con-
centration. Finally, we discussed a comprehensive
list of related approaches, all of which support only
binary event-based output and mostly come from dif-
ferent application domains.
In future work, we aim to extend our AudioCues
prototype to manage additional control targets which
more and more become available through IoT.
REFERENCES
Alcaraz Calero, J. and Gutierrez Aguado, J. (2015). Mon-
paas: An adaptive monitoring platformas a service for
cloud computing infrastructures and services. IEEE
TSC.
Bakker, S., Van Den Hoven, E., and Eggen, B. (2010). Ex-
ploring interactive systems using peripheral sounds.
In Haptic and Audio Interaction Design. Springer.
Ballora, M., Panulla, B., Gourley, M., and Hall, D. L.
(2010). Preliminary steps in sonifying web log data.
Audio-visual Cues for Cloud Service Monitoring
445

International Community for Auditory Display, Wash-
ington, DC.
Barra, M., Cillo, T., De Santis, A., Petrillo, U. F., Negro,
A., Scarano, V., Matlock, T., and Maglio, P. P. (2001).
Personal webmelody: Customized sonification of web
servers. Proc. of ICAD 2001.
Bass, L., Weber, I., and Zhu, L. (2015). DevOps: A Soft-
ware Architect’s Perspective. Addison-Wesley Profes-
sional.
Bermbach, D. and Eberhardt, J. (2016). Towards audio-
visual cues for cloud infrastructure monitoring. In
Proc. of IC2E 2016. IEEE.
Bermbach, D. and Tai, S. (2014). Benchmarking eventual
consistency: Lessons learned from long-term experi-
mental studies. In Proc. of IC2E 2014. IEEE.
Bermbach, D. and Wittern, E. (2016). Benchmarking web
api quality. In Proc. of ICWE. Springer.
Cohen, J. (1994). Monitoring background activities. In
Santa Fe Institute Studies in the Sciences of Complex-
ity Proceedings. Addison-Wesley.
Cooper, B. F., Silberstein, A., Tam, E., Ramakrishnan, R.,
and Sears, R. (2010). Benchmarking cloud serving
systems with ycsb. In Proc. of SOCC, SOCC ’10.
ACM.
Dahley, A., Wisneski, C., and Ishii, H. (1998). Water lamp
and pinwheels: ambient projection of digital infor-
mation into architectural space. In Proc. of CHI 98.
ACM.
Dinda, P. A. and O’Hallaron, D. R. (2000). Host load
prediction using linear models. Cluster Computing,
3(4):265–280.
Dzielak, J. (2014). Listen to your log files with aud.
http://dzello.com/blog/2014/01/10/
listen-to-your-log-files-with-aud/
(accessed Sept 11,2015).
Finlayson, J. L. and Mellish, C. (2005). The audioview-
providing a glance at java source code. In Proc. of
ICAD.
Fitch, W. T. and Kramer, G. (1994). Sonifying the body
electric: Superiority of an auditory over a visual dis-
play in a complex, multivariate system. In Santa Fe
Institute Studies in the Sciences of Complexity Pro-
ceedings. Addison-Wesley.
Gaver, W. W., Smith, R. B., and O’Shea, T. (1991). Effec-
tive sounds in complex systems: The arkola simula-
tion. In Proc. of CHI. ACM.
Gilfix, M. and Couch, A. L. (2000). Peep (the network
auralizer): Monitoring your network with sound. In
LISA, pages 109–117.
Hermann, T., Drees, J. M., and Ritter, H. (2003). Broad-
casting auditory weather reports-a pilot project. Proc.
of ICAD.
Hermann, T. and Ritter, H. (1999). Listen to your data:
Model-based sonification for data analysis. Advances
in intelligent computing and multimedia systems.
Ishii, H., Wisneski, C., Brave, S., Dahley, A., Gorbet, M.,
Ullmer, B., and Yarin, P. (1998). ambientroom: in-
tegrating ambient media with architectural space. In
Proc. of CHI 98, pages 173–174. ACM.
Islam, S., Keung, J., Lee, K., and Liu, A. (2012). Empirical
prediction models for adaptive resource provisioning
in the cloud. Future Generation Computer Systems.
Jameson, D. H. (1994a). The run-time components of son-
nett. Proc. of ICAD 1994.
Jameson, D. H. (1994b). Sonnet: Audio-enhanced moni-
toring and debugging. In Santa Fe Institute Studies
in the Sciences of Complexity Proceedings. Addison-
Wesley.
Jenkins, J. J. (1985). Acoustic information for objects,
places, and events. Persistence and change, pages
115–138.
Kanstr
´
en, T., Lehtonen, S., Savola, R., Kukkohovi, H., and
H
¨
at
¨
onen, K. (2015). Architecture for high confidence
cloud security monitoring. In Proc. of IC2E 2014.
IEEE.
Liechti, O., Sifer, M., and Ichikawa, T. (1999). A non-
obtrusive user interface for increasing social aware-
ness on the world wide web. Personal Technologies,
3(1-2):22–32.
Lucas, P. A. (1994). An evaluation of the communicative
ability of auditory icons and earcons. Proc. of ICAD
1994.
Maglio, P. P. and Campbell, C. S. (2000). Tradeoffs in
displaying peripheral information. In Proc. of CHI.
ACM.
M
¨
uller, S., Bermbach, D., Tai, S., and Pallas, F. (2014).
Benchmarking the performance impact of transport
layer security in cloud database systems. In Proc. of
IC2E 2014. IEEE.
Mynatt, E. D., Back, M., Want, R., Baer, M., and Ellis, J. B.
(1998). Designing audio aura. In Proc. of CHI 1998,
pages 566–573. ACM.
Rauterberg, M. and Styger, E. (1994). Positive effects of
sound feedback during the operation of a plant simu-
lator. In Human-Computer Interaction, pages 35–44.
Springer.
Schmandt, C. and Vallejo, G. (2003). “listening” to do-
mestic environments from remote locations. Proc. of
ICAD.
Tarbox, B. (2008). Log4jfugue. www.log4jfugue.org
(accessed Sept 11,2015).
Tran, Q. T. and Mynatt, E. D. (2000). Music monitor: Am-
bient musical data for the home. Extended Proceed-
ings of the HOIT, pages 85–92.
Vickers, P. (2011). Sonification for process monitoring. In
Hermann, T., Hunt, A., and Neuhoff, J., editors, The
Sonification Handbook, pages 455–492. Logos Ver-
lag, Berlin.
Vickers, P. and Alty, J. L. (2003). Siren songs and swan
songs debugging with music. Communications of the
ACM, 46(7):86–93.
Weiser, M. and Brown, J. S. (1997). The coming age of
calm technology. In Beyond calculation, pages 75–
85. Springer.
CLOSER 2017 - 7th International Conference on Cloud Computing and Services Science
446
