
A Comparative Study on User Characteristics of an E-car Pooling
Service in Universities in Europe
Fivos Galatoulas, Sesil Koutra, Pawel Rycerski,
Luis M. Ibarra Candanedo and Christos S. Ioakimidis
(*)
ERA Chair (*Holder) 'Net-Zero Energy Efficiency on City Districts, NZED' Unit, Research Institute for Energy,
University of Mons, 56 Rue de l’Epargne, Mons, Belgium
Keywords: Case-study, E-carpooling, MaaS (Mobility as a Service), Survey, University.
Abstract: An impactful solution for confronting critical environmental problems may be pursued within the context of
e-carpooling services. Nevertheless, a crucial part in our intervention through the introduction of efficient
carpooling systems is that of the conceptualization of user preferences and attributes. This study presents a
comparison between two surveys focused on a respondent sample consisting mainly of members of a
university community. Specifically, the first survey involved students and employees of a private academic
institution (University of Deusto, Bilbao, Spain) while the second members of a public institution in
(University of Mons, Hainaut, Belgium).
1 INTRODUCTION
The mobility concept of e-carpooling offers not only
an alternative means of covering the increasing
requirements for human mobility, but also a low-cost
measure to alleviate the effects for a number of
problems, including traffic congestion, energy
consumption and environmental degradation, among
others
(Bruglieri et al., 2011) . Generally, carpooling
aims at increasing the vehicle occupancy, focusing on
the transportation of a group of individuals from a
given origin to a specific destination at the same time
(Katzev, 2003). In particular, it refers to the
establishment of agreements between a driver and one
or more passengers to share a ride in a single vehicle,
rather than making the same trip individually
(Dimitrakopoulos et al., 2012). The driver and the
passenger(s), also referred to as “car poolers”, agree
in advance to share the fuel and other relevant costs
(e.g. toll fees) for a specific trip in order to have a
mutual benefit on the transportation costs. Even
though the term car sharing is sometimes used
(mainly in the United Kingdom and to some extent in
Australia and New Zealand) as a substitute for or
interchangeably with what is known as carpooling in
the academic and increasingly popular discourse
(Kent and Dowling, 2013, Stillwater et al., 2009), a
main difference in carpooling is that the individuals
share a common route, not only the car (Katzev,
2003). In the most typical form of carpooling, both
driver and car poolers have the same origin and
destination, while more complex structures occur if
they share only a part of a given trip (Vanoutrive et
al., 2012). The innovative characteristic of e-
carpooling is the combination of carpooling with the
emerging electric vehicle technology.
In addition, transportation is considered as one of
the primary fuel use sectors worldwide, while being
responsible for a significant share of greenhouse gas
(GHG) emissions. Given the imminent depletion of
oil reserves and the resulting volatility of fuel prices
in international markets, the widespread adoption of
electric vehicles is often viewed as a feasible
alternative to vehicles with internal combustion
engines that could contribute, to a significant extent,
to the decarbonisation of the transportation sector
(Chan and Shaheen, 2012).
From the authors’ point of view, the combined use
of car sharing and carpooling services with electric
vehicles can multiply the potential benefits in terms
of reduction on the traffic congestion, air and noise
pollution, as well as dependence on fossil fuels. To
this end, this paper presents the results of two surveys,
the first conducted at the University of Deusto (UD),
Bilbao, Spain and the second at the University of
Mons (UMONS), Belgium in an attempt to identify
differences and similarities between the academic
communities on their perception on the transition to
200
Galatoulas, F., Koutra, S., Rycerski, P., Candanedo, L. and Ioakeimidis, C.
A Comparative Study on User Characteristics of an E-car Pooling Service in Universities in Europe.
DOI: 10.5220/0006302202000207
In Proceedings of the 6th International Conference on Smart Cities and Green ICT Systems (SMARTGREENS 2017), pages 200-207
ISBN: 978-989-758-241-7
Copyright © 2017 by SCITEPRESS – Science and Technology Publications, Lda. All rights reserved
electromobility and alternative modes of transport.
The purpose of this work is twofold, first to record the
everyday practices and preferences of the employees
and students regarding the use of public transport in
different cities-countries, to explore their attitude
towards the use of electric vehicles, including cars,
scooters and bicycles, and the adoption of e-car
sharing/carpooling as a means of transport and finally
to examine the reasons behind the groups choice of
mode of travel depending on the local transportation
framework, national commuting statistics and
possible implicate attributes.
2 METHOD
2.1 Survey Characteristics
A survey questionnaire was prepared and distributed
to members of the university campus at both
occasions via a Google platform. Each participant
was selected randomly but asked to validate his
academic identity. Respondents were explained
broadly the concept of carpooling and were invited to
carefully read questions before answering.
2.2 Description of Samples
Our sample in the first case, the survey conducted in
2014 at the UD, consisted of a representative sample
of 124 students of which 49,2% were women. The
purpose of this survey was to collect information on
the use of public transport and analyze the attitude of
the respondents towards new modes of transport and
use of electric vehicles, including cars, scooters and
bicycles. The questionnaire included an age indicator
in order to divide the respondents into groups by year
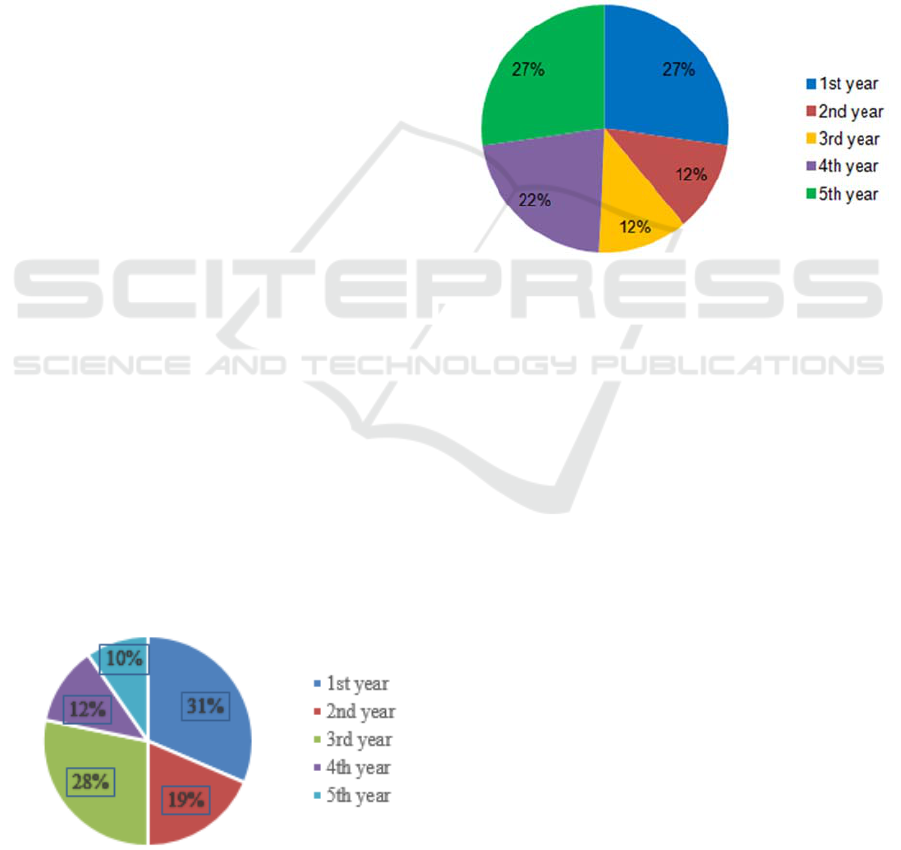
of tuition. The majority of the respondents belongs to
the age group 17-18 years old (1st year), followed by
3rd year students and respondents from the final years
having the lowest percentage, as shown in Fig. 1.
Figure 1: Percentage breakdown by age group of the UD
sample.
The second under study survey (26 questions) was
conducted at the UMONS campus during the period
from 17/6 to 30/7/2015 in a sample of 59 students.
The purpose of the survey was to gather data on the
user preferences and analyse the attitude of the
respondents regarding the concepts of carpooling and
electro-mobility, in order to identify their
characteristics as potential users of a university-based
e-carpooling system in the city of Mons. The survey
was based on a random sample of 59 Bachelor (51%)
and Master (49%) students. More specifically, the
sample consists mainly of students in their 1st (27%),
4th (22%) and 5th (27%) year of studies, as shown in
Fig. 2.
Figure 2: Survey characteristics.
3 RESULTS
In this section, the key results of each survey study
are presented in order to provide the necessary
information for evaluating the extent to which the two
population samples differ in terms of response data.
3.1 Student Survey Study at the
University of Deusto
The UD is located in Northern Spain in the heart of
the economic and cultural capitals of the Basque
Country - Bilbao and San Sebastian. UD was founded
in 1886 due to the Basque community’s desire for
independent education and the Society of Jesus's wish
to move its School of Higher Studies in Laguardia to
a more central place. The university has more than
10.000 students and approximately 600 members of
staff (Morigi and Trombetti, 2006).
3.1.1 Part I: Driving Profile
The first query of the survey aimed to determine the
percentage of the respondents that hold a driving
license, with percentages of possession increasing
A Comparative Study on User Characteristics of an E-car Pooling Service in Universities in Europe
201
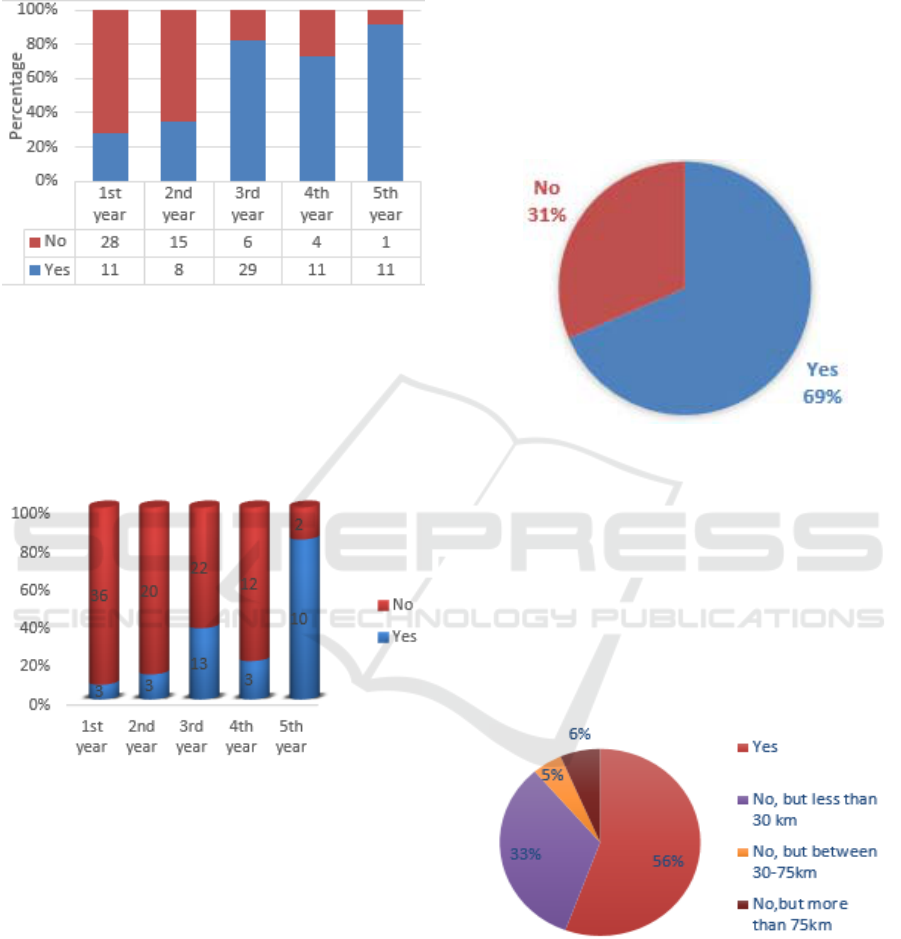
accordingly to year of tuition. Fig. 3 presents the
percentage share of driving license holders per age
group.
Figure 3: Percentage share of respondents holding a driving
license.
The next query referred to private vehicle ownership.
Of the respondents holding a driving license, a
percentage of 45,7% owns a car. Accordingly, Fig. 4
illustrates the percentage of survey respondents that
own a car in each age group.
Figure 4: Percentage of total respondents owning a car.
3.1.2 Part II: Use of Public Transportation
Nearly a percentage of 80% of the respondents use
public transport in Bilbao, most of which belong to
freshman years, while more experienced students are
ranked lower in terms of public transport use. The
overwhelming majority of the respondents (95%)
reported the use of the subway, because of the
geographical coverage, with bus transport being also
a widely used means of transport (65% of the
respondents), given the good connections between
buses and the fact that there are some areas not served
by the Metro service. Most of the younger
respondents (1
st
-2
nd
year) use it on a daily basis, while
the rest use it at most twice a week
3.1.3 Part III: Use of New Technologies
Regarding the possession and use of new
technologies in the form of a smart phone with
internet access, a percentage of 70% of the
respondents answered affirmatively (Fig. 5), with
people in earlier years of their tuition stating that it is
one of the primary means of communication, while
the other groups mentioned having the basic skills to
send emails and/or open files.
Figure 5: Percentage of Smartphone users.
3.1.4 Part IV: Residential Distribution
In terms of sociodemographic and transportation
accessibility, the results of the survey also show that
only 5% of the people interviewed reside between 30
and 75 km from Bilbao, while a percentage of 33%
resides outside the city center but within a distance of
30 km. Fig. 6 presents the distribution of respondents
following the query of the distance of their residence
from the center of the city of Bilbao.
Figure 6: Distance of residence from the city centre.
3.1.5 Part V: Attitude towards
Electromobility/ Carpooling
A key finding of this survey was that most of the
respondents opt for an electric vehicle to move
around Bilbao or within 30 km, while the order of
preference is electric car, electric scooter and electric
SMARTGREENS 2017 - 6th International Conference on Smart Cities and Green ICT Systems
202

bicycle with percentages of 53%, 37% and 10%
respectively. Moreover, a percentage of 60% of our
sample considers electric vehicles as an economic and
environmental option, while the rest 40% stated that
it is not only economic and environmental, but also
offers quick access. Regarding the perception of the
electric vehicle concept from the respondents,
approximately 85% of them believe that an electric
car has a single electric motor, while the remaining
15% reported that electric cars have both an electric
motor and a gasoline engine.
In addition, the survey included a set of queries to
identify the attitude towards electromobility and the
willingness to use non-traditional modes of transport.
Remarkably, only 35% of the people interviewed are
not willing to rent an electric means of transport,
while of the remaining 65%, a share of 75% would
rent an electric car and the rest 25% would rent an
electric scooter. A percentage of 85% of the
participants in the survey reported that they would
share a car to go to work or to the same destination
with the same schedule. Equally important, a share of
73% of the respondents stated that, for electric
transport services, they would pay the same amount
with the daily cost of public transport, while the rest
27% is willing to pay 10% more.
In the last part of the survey, the participants were
asked to express their opinion about the electric
means of transport, specifically for the electric car. In
general, the respondents believe that it is an expensive
option, because of the cost of charging, and that there
is a lack of the required infrastructure, as there are
only a few charging points in the city. Furthermore,
the survey participants note that electromobility will
eventually be the most viable way for transportation
purposes, a fact that should be also taken into account
in the public sector. Regarding their opinion for
MaaS, thus, car sharing and carpooling as alternative
modes of transport, the participants consider this as
an opportunity to save costs, prevent traffic
congestions, meet new people, and in general they
would share a car to go to their work with their
colleagues or people that wish to move to the same
place with the same schedule.
3.2 Student Survey Study at the
University of Mons
This section presents the results of the survey
conducted at UMONS, which is a French-speaking
public university in the Hainaut province of Belgium,
near the French-Belgian border and it is situated
approximately 50 km from Brussels. UMONS was
created in 2009 following the merger between the
University of Mons-Hainaut and the Faculty of
Engineering of Mons. Today, the university has more
than 6.000 students and more than 1.000 employees
(Ioakimidis et al, 2016).
3.2.1 Part I: Driving Profile
Framing their profile, the first query aimed to
determine the respondents that hold a driving license
and it was answered affirmatively by the majority of
them (66.1%). With respect to the number of years
holding a license as an indicator of the driving
experience, more than 40% of the relevant
respondents have held their license for 1-3 years,
more than 30% of them have possessed their license
for a longer period of 3-7 years, while significant is
also the percentage of respondents with a driving
license for more than 7 years (23.1%), as shown in
Fig. 7.
Figure 7: Time distribution of driving licence possession.
3.2.2 Part II: Use of Public Transportation
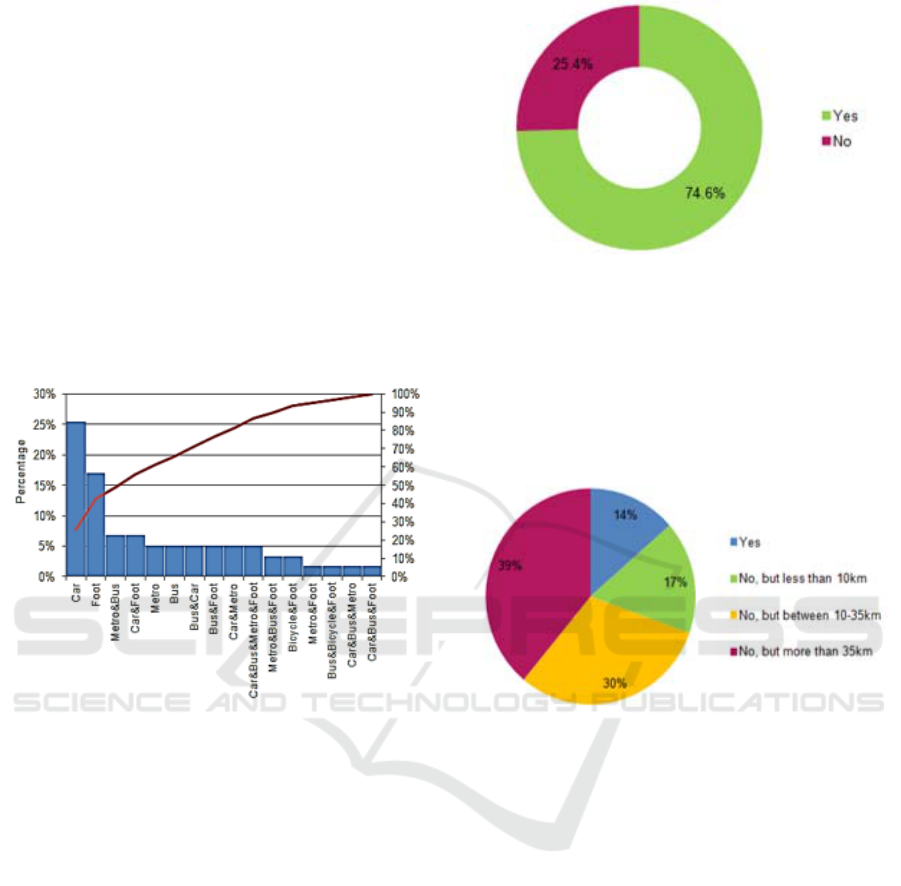
A high share of the interviewed persons uses only the
car for daily commuting to the university (25%),
while interesting is also the number of users that
prefer going on foot to their destination (17%).
However, a significant part of the respondents
combines public transportation (car-metro, bus-car,
bus-foot, etc.) to cover the daily transport needs. Fig.
8 presents graphically the results discussed. In
general, the overwhelming majority of survey
participants makes use of public transportation (not
necessarily for commuting to the university only) on
a daily basis (86%), while only 7% of them once per
week. Obviously, the good connections between the
various means of transportation encourage the
frequent use by commuters; however, the percentage
of car use for commuting to the university still
remains high (25%).
Two important issues regarding the use of public
transportation are: (i) the estimated time from their
home to the university, and (ii) the monthly expenses.
A Comparative Study on User Characteristics of an E-car Pooling Service in Universities in Europe
203
With respect to the estimated trip time, more than
30% of the interviewees need between 15-30 min for
a single trip, while approximately 30% of them
estimate 30-60 min per trip. Less than 5% of them
need only 5 min (residence in Mons) and more than
10% take more than 60 min to arrive at the university
(due to inadequate geographical coverage of public
transportation, long distances, bad connections, etc.).
The second key factor and incentive for the
encouragement of public transportation use is the
indicator of monthly expenses. The majority of the
respondents (more than 40%) spend less than 25€ per
month for daily commuting to the university
(obviously using public transportation), while a
significant percentage of 17.4% of them spend more
than 65€ monthly (possible car use).
Figure 8: Use of means of transportation for commuting to
the University.
3.2.3 Part III: Use of New Technologies
Regarding the possession and use of new
technologies in the form of a smart phone with
Internet access, a percentage of approximately 75%
of the respondents answered affirmatively (Fig. 9),
while more than 95% of them possess a personal
computer with Internet access, considering them as
primary means of communication.
Figure 9: Possession of smart phone with Internet access.
3.2.4 Part IV: Residential Distribution
The results show that only 14% of the respondents
reside in the city, while the rest of them prefer
commuting as they reside in a distance between 10-
35 km (30%) or in a distance of more than 35 km
(approximately 40%) from the city centre (Fig. 10).
Figure 10: Residence in the city of Mons and distance from
city centre.
3.2.5 Part V: Attitude towards
Electromobility/ Carpooling
In addition, the survey included a set of queries to
identify the willingness to use non-traditional
mobility concepts. It is interesting to note that a
remarkably high percentage of the respondents
answer affirmatively to the idea of carpooling with
one or more persons (almost 80%), while only 13.6%
of them show no interest in this mobility concept, as
depicted in Figure 11.
Following the willingness for carpooling, the
respondents were asked for their potential
participation in carpooling if financial or ecological
criteria are promoted. Approximately 60% of the
interviewees would opt for carpooling for financial
reasons, while more than 50% of them are encouraged
by ecological initiatives. It is interesting to note that
more than 40% of them support the concept of
carpooling even if they are not the drivers.
SMARTGREENS 2017 - 6th International Conference on Smart Cities and Green ICT Systems
204
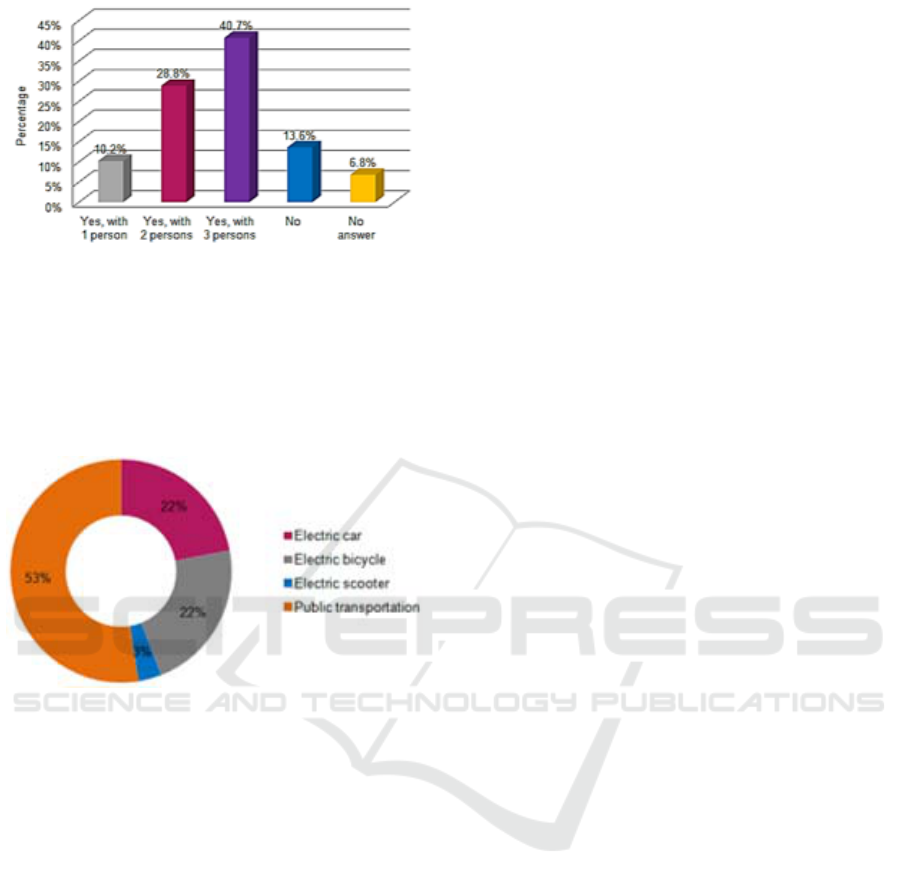
Figure 11: Willingness to carpool.
Another finding of the survey is that more than a half
of the respondents (53%) opt for public transportation
to move around Mons or within 30 km compared to
EVs, while the preference for the latter is electric car
(22%), electric bicycle (22%) and electric scooter
(only 3%), as shown in Fig. 12.
Figure 12: Preferable means of transportation in the city of
Mons.
The main reasons for the users’ preferences on the
means of transportation for the trips in the city of
Mons are a combination of ecological, financial and
time criteria (roughly 30%), while the combination of
ecological and financial criteria is also crucial for the
interviewees (approximately 24%). Moreover, the
estimated time for quick access per se is also
considered as important factor for the users’ choice.
In the last part of the survey, the participants were
asked to express their opinion about the electric
means of transportation and their willingness to use
them for daily commuting. Despite the fact that 1 out
of 2 participants shows no interest in renting an EV
for commuting to the university, an additional key
finding regarding this part of the survey is that
approximately 30% of them would prefer to rent an
electric bicycle and roughly 20% would prefer an
electric car.At a first glance, this finding indicates that
the users are cautious about electro-mobility,
considering EVs as an expensive or not an
appropriate option for their daily commuting to the
university. A main reason for this perception can be
attributed to the complex infrastructure required to
support electro-mobility. On the other hand, almost
30% of the survey participants would share their
rented EV in order to commute to the university,
while 25% of them show no willingness for such a
concept (the rest survey participants gave no answer).
The last predictors examined the users’ willingness to
be charged with extra fees for renting an EV
compared to a conventional one. Specifically, a share
of 54% of interviewees would not pay more to benefit
from the use of an EV, while 19% of them could
afford additional fees of more than 10% (only 3%
report more than 25% for the possession and use of
an EV).
4 DISCUSSION
Despite the numerous environmental benefits
deriving from the adoption of e-carpooling as a mode
of transportation (reduction of air pollution, fuel
consumption savings, cost-effectiveness and higher
vehicular occupancy leading to a subsequent decrease
of cars on highways), it has not yet sufficiently
outspread in European cities. In our study, an attempt
to identify the differences in motivation and
preferences of students, belonging to two different
University settings, concerning urban solutions on
transportation was performed through the assessment
of factual data and survey responses.
Both student population samples were similar in
transportation accessibility, age distribution and
agglomeration size. However, students in Bilbao
reside closer to the center of the city than their fellow
students in Mons.
Importantly, an impactful fact is Belgium’s high
rate of daily commuters, claiming first place in the
EU. On average, Belgians commute 53.2 minutes a
day, compared to the European average of just less
than 45 minutes. One in five Belgians spend two
hours a day commuting. The time Belgians spend
commuting scores to an average of nearly seven full
days a year (Eurostat, 2016). On average, Europeans
spend 45 minutes a day on public transport with the
Spanish dedicating 51.6 minutes per day to
commuting. From an unexperienced point of view
these numbers would assimilate the mobility
perspective of both regions, nonetheless one must
take account of the average commuting distance per
country, with Belgians topping cross-border rate of
commuting in 2015 where more than one in five
(21.9 %) persons commuted to work in a different
region. This fact can explain the difference observed
A Comparative Study on User Characteristics of an E-car Pooling Service in Universities in Europe
205

in the query regarding preferable means of transport
in the city, with public transportation gathering higher
percentages in the UMONS student sample, while on
the contrary students of the Basque institution
selected the EV car as their optimal mean.
In addition, this can be explained to a great extent
if viewed in the context of the economic incentives
for the promotion of electric vehicles provided by the
Governments of Spain and the Basque Country, given
that they can be combined cumulatively in order to
increase the total amount of subsidy. Recently, the
Spanish Government approved the new program for
subsidizing the purchase of battery electric vehicles
with at least 4 wheels, depending on the range and the
type of vehicle (Spanish Ministry of Industry, 2013).
In the Basque Country in particular, the local
Government provides subsidies for the purchase of a
wider range of vehicles, including a maximum
amount of 5000 € for a plug-in hybrid or a pure
electric vehicle, as well as for an electric vehicle with
range extender, 750 € for an electric motorbike and
400 € for an electric moped. Moreover, a gradually
increasing per vehicle subsidy applies to the case of
multiple vehicles (of the same category) purchase.
Regarding the charging infrastructure, there is a
subsidy of up to 40% of the cost of the complete
installation (excluding IVA). For residential parking
lots or fleets of electric vehicles, the maximum
amount cannot exceed 500 € per charging point, while
for public-use charging points the maximum
economic assistance depends on the type of the
installation, with a maximum amount of 2000 € for
mode 3 charging and 5000 € for mode 4 (fast DC)
charging (EVE, 2013).
In contrast, the results retrieved from the survey
in UMONS, imply that electro-mobility has not
spread to the full extent of its potential, but still from
the user’s perspective there are two major barriers in
owning and/or using an electric car: (i) it costs more
than a car with an internal combustion engine, and (ii)
it has in general a limited range compared to a
conventional vehicle It is important to note that the
total amount of the economic aid cannot exceed the
20% of the total eligible cost of the vehicle.
Similar acceptance rates were recorded in
identifying the key factors that could assist in
predicting the willingness to carpool. Specifically, the
findings of the UMONS survey indicate that 4 out of
5 survey respondents would participate in carpools
(80% for the first sample), while almost 3 out of 10
participants would rent and share (carpool) an EV in
order to commute to the university, conflicting with
the high EV acceptance rates scored in the Basque
study. The reasons for carpooling in both targeted
samples recognized as incentives, financial gains,
environmental awareness and time-saving. The
findings of the first survey also include that 2 out of 3
respondents are willing to rent an electric means of
transport, while a percentage of 85% of the
respondents would share a car to go to work or to the
same destination with the same schedule.
Furthermore, this preliminary approach reveals that 1
out of 4 respondents is willing to pay a premium of
10% of the daily transportation cost with public
means in order to use electric transport services in
Bilbao.
The final aim of this study was to evaluate the
level of acceptance and attitude towards the transition
to electromobility. Initially, this work considers the
geographical distribution of residence for the
population under study, given that almost 9 out of 10
individuals reside close to the city of Bilbao. This
implies that a significant part of the sample
potentially combines different modes of transport in
order to commute to and from the university. The
results of the survey show that at least 4 out of 5
respondents use public means of transport to cover
their transportation needs.
Figure 13: Comparative representation of preferable mode
of transport per study group linked to distance from city
centre.
Remarkably, most of the respondents from the
UMONS study use a private vehicle (25%) with
second preferred way of transfer being by foot, a fact
connected to the short range distances a student must
cover for inter-campus transport within the scale of
Mons. The electric car is considered as the most
popular choice, with electric scooters and bicycles
being secondary options for students of UD when at
the same time students in UMONS tend to be cautious
with the concept of electromobility, as depicted in
Fig.13.
SMARTGREENS 2017 - 6th International Conference on Smart Cities and Green ICT Systems
206

5 CONCLUSIONS
The findings of this work indicate that both survey
respondents are in support of public transportation,
while the users’ acceptance on renting an electric car
in order to commute to the university is relatively low
yet encouraging in the case of UMONS. Therefore, a
university-based MaaS e-carpooling concept can be a
promising solution as the total costs of owning and/or
using an EV spread among many users and it becomes
part of the public transportation system for
complementing both local and long-distance trips.
To conclude, the results obtained within the frame
of this work reveal that the members of the first case
study show a positive attitude towards using both car
sharing/carpooling services and electric vehicles.
Future work includes a comprehensive study for
examining the case of implementing a car
sharing/carpooling service with electric vehicles
within universities, addressing these issues by
enlarging the sample base and recording preferences
with objective measures.
ACKNOWLEDGEMENTS
This research was funded by the EC under the FP7
RE-SIZED 621408 (Research Excellence for
Solutions and Implementation of Net-Zero Energy
City Districts) project.
REFERENCES
Bruglieri M., Ciccarelli D., Colornia A. and Luè A., 2011.
PoliUniPool: A carpooling system for universities,
Procedia - Social and Behavioral Sci., vol. 20, pp. 558–
567.
Chan N. D. and Shaheen S. A., 2012 Ridesharing in North
America: Past, Present, and Future, Transport Reviews,
vol. 32, no. 1, pp. 93–112.
Dimitrakopoulos G., Demestichas P. and Koutra V., 2012.
Intelligent management functionality for improving
transportation efficiency by means of the carpooling
concept, IEEE Trans. Intell. Transp. Syst., vol. 13, no.
2, pp. 424–436.
Ente Vasco de la Energía (EVE) / Departamento Desarrollo
Económico y Competitividad / Gobierno Vasco, 2013.
Programa de ayudas en transporte y movilidad
eficiente, Condiciones Generales (Año 2013).
Available:
http://www.eve.es/CMSPages/GetFile.aspx?guid=ad7
80aa5-abdb-4bbd-bafd-00e5a0b60da3.
Eurostat, 2016. Europe in Figures: Eurostat Yearbook 2016.
Publications Office of the European Union.
Ioakimidis C. S., Koutra S., Rycerski P. and Genikomsakis
K. N., 2016. User characteristics of an electric bike
sharing system at UMONS as part of a smart district
concept, in Proc. 2016 IEEE Int. Energy Conf.
(ENERGYCON), Leuven, Belgium.
Katzev R., 2003. Car Sharing: A New Approach to Urban
Transportation Problems, Anal. of Social Issues and
Public Policy, vol. 3, no. 1, pp. 65–86.
Kent J. L. and Dowling R., 2013.Puncturing automobility?
Car sharing practices, J. of Transport Geography, vol.
32, pp. 86–92.
Ministerio de Industria, 2013. BOE-A-2013-4461, Boletín
Oficial Del Estado. Núm. 101. Sábado 27 de abril de
2013. Sec. I. Pág. 32072. I.
Morigi, L. and Trombetti F., 2006. Quality assurance in
higher education. A case study: the Deusto University
in Bilbao. Assessing Quality in European Higher
Education Institutions. Physica-Verlag HD, 133-146.
Stillwater T., Mokhtarian P. L. and Shaheen S. A., 2009.
Car sharing and the built environment: Geographic
information system based study of one U.S. operator,
Transportation Research Record, vol. 2110, pp. 27–34.
Vanoutrive T., Van De Vijver E., Van Malderen L.,
Jourquin B., Thomas I., Verhetsel A. and Witlox F.,
2012. What determines carpooling to workplaces in
Belgium: Location, organisation, or promotion? , J. of
Transport Geography, vol. 22, pp. 77–86.
A Comparative Study on User Characteristics of an E-car Pooling Service in Universities in Europe
207
