
Identifying Points of Interest for Elderly in Singapore through Mobile
Crowdsensing
Marakkalage Sumudu Hasala
1
, Billy Pik Lik Lau
1
, Viswanath Sanjana Kadaba
1
, Balasubramaniam
Thirunavukarasu
3
, Chau Yuen
1
, Belinda Yuen
2
and Richi Nayak
3
1
Engineering Product Development, Singapore University of Technology and Design, Singapore
2
Lee Kuan Yew Centre for Innovative Cities, Singapore University of Technology and Design, Singapore
3
School of Electrical Engineering and Computer Science, Queensland University of Technology, Australia
Keywords:
Big Data, Crowdsensing, POI, Voronoi Diagrams, Heat Maps.
Abstract:
This paper introduces a crowdsensing approach to identify the points of interest (POI) among the elderly
population in Singapore. We have developed a smartphone application, which passively collects sensors’
information (e.g. GPS location) on users’ mobile devices. Using such information, we can identify popular
regions and places among the elderly that could be useful for city planner in preparation for aging population.
Our results demonstrate different check-in patterns of various POI, and the elderly spend nearly 70% of non-
home duration around their neighborhood.
1 INTRODUCTION
Elderly population is a key component in any soci-
ety. In Singapore, the number of citizens aged 65 and
above is increasing rapidly. In fact, the resident Old-
Age Support Ratio (persons aged 20 − 64 years per
elderly aged 65 years and over) has significantly re-
duced from 9 to 5.7 over the years of 2000 to 2015
respectively (Department of Statistics, 2016). Rising
elderly population is a challenge to address since their
requirements and interests should be understood in or-
der to provide them a better quality of life. According
to (Capella and Greco, 1987), elderly have tendency
of travelling around in their leisure time, which leads
to the thinking that it is important to identify their
preference of places to visit. In order to achieve such
information we need to reach the elderly and com-
municate to gather required information from them.
Rather than conducting verbal or written surveys, the
more convenient approach is to utilize the ubiquitous
nature of smartphones among the elderly as a resource
to collect data from heterogeneous sensors available
in smartphones. According to study in (Pang et al.,
2014), elderly in Singapore have positive attitude to-
wards smartphones and have found them to be use-
ful and entertaining. Hence, a smartphone applica-
tion based approach has the potential in quantitatively
identifying elderly lifestyle. The work presented in
this paper, adopts a smartphone based mobile applica-
tion as the tool to better understand the daily activity
of an elderly. Using the smartphone sensor informa-
tion collected through mobile application, we prove
that it is possible to identify the Regions of Interest
(ROI) and Points of Interest (POI) of elderly in Sin-
gapore.
The remaining sections of this paper are structured
as follows. Section 2, discusses the literature review
and related work done previously. Next, Section 3
discusses the methodology which is used to collect
and analyse data from elderly. Section 4 describes the
insights about ROI from the analysed data. Section 5
presents POI extracted from each ROI. Finally, Sec-
tion 6, concludes the paper with a summary of find-
ings, and possible future work.
2 LITERATURE REVIEW
There has been previous research done to track user
locations using mobile applications. Tourist tracking
through smartphone location data (Viswanath et al.,
2014) has been done in order to identify travel sites
of tourists and to rate tourist sites based on user sur-
veys conducted through the mobile application. In
the context of smart homes, previous work has been
carried out for proactive environment change for el-
derly (Helal et al., 2003), cloud based real-time activ-
60
Hasala, M., Lau, B., Kadaba, V., Thirunavukarasu, B., Yuen, C., Yuen, B. and Nayak, R.
Identifying Points of Interest for Elderly in Singapore through Mobile Crowdsensing.
DOI: 10.5220/0006309300600066
In Proceedings of the 6th International Conference on Smart Cities and Green ICT Systems (SMARTGREENS 2017), pages 60-66
ISBN: 978-989-758-241-7
Copyright © 2017 by SCITEPRESS – Science and Technology Publications, Lda. All rights reserved

ity tracking in home (Fahim et al., 2012) which helps
to remotely monitor elderly who stay at home (Yassin
et al., 2017), and RFID based location tracking (Kim
et al., 2013) (Liu et al., 2015). An adaptable interface
for smartphones which is customized to the elderly
has been developed in (Arab et al., 2013). Helping
people with limited mobility (e.g. elderly) by sug-
gesting accessible urban paths using crowdsourced
data has been done in (Mirri et al., 2014). A pas-
sive information gathering system using mobile ter-
minals such as smartphone applications, emails, and
phonecalls, has been done to gather knowledge and
experience from elderly and transfer to younger gen-
eration (Hiyama et al., 2013). In (Ghiani et al., 2013),
a platform has been developed to support elderly to
stay active in life in order to improve their healthy
living.
To the best of our knowledge, there is no previous
work done to identify the ROI and POI of elderly, us-
ing smartphone based mobile applications. Our focus
is not only for the elderly who stay at home, but also
for the elderly who prefer to travel around their neigh-
bourhood or further. Therefore, this paper presents an
approach to understand lifestyle of elderly, using the
data collected through smartphone applications, and
analysing them.
3 METHODOLOGY
A user-friendly smartphone application that runs on
Android platform, is designed and developed (SUT-
DDev, 2015) to collect data from elderly. More than
100 people, the majority aged 50 and above, who re-
side in Bukit Panjang area of Singapore participated
in the study by installing the application on their mo-
bile phones. In this paper, we reported only the data
from 50 participants, whose collected data is consis-
tent throughout the study period. There are 3 ma-
jor stages in the approach of identifying ROI and
POI, namely, Mobile Application Development, El-
derly Data Collection, and Big Data Analysis.
3.1 Mobile Application Development
The smartphone application, which is used to collect
data from participants is an improved version of the
application introduced in (Viswanath et al., 2014).
The application collects data such as GPS location
(including latitude, longitude, and accuracy), activity
data from Google API, noise level of the environment,
device battery level, and light sensor values. In the
process of identifying ROI and POI, in this paper, we
utilized only the location related data. In future work,
our intention is to utilize all the collected information
in order to extract deep insights about user behaviour.
3.2 Elderly Data Collection
The recruitment of target participant group for the
study (elderly who use Android smartphones and re-
side in Bukit Panjang area of Singapore) was done
in public locations around Bukit Panjang. All the
data were collected for one month of minimum pe-
riod with the written consent from every participant in
the study. Participants’ personal identity is used only
during registration. The data collection and analysis
is done through a unique auto-generated device ID to
ensure privacy of the participants. Figure 1 shows the
flow of elderly data collection.
Figure 1: Elderly Data Collection.
3.3 Big Data Analysis
Aquired data from the mobile phones of the elderly
need to be analysed in order to gather meaningful in-
sights. Data analysis was done using back-end Java
application and MATLAB software package. Af-
ter the data is analysed, tools such as Google Maps,
Voronoi Diagrams, and Heat Maps are used to visual-
ize the gathered insights, so that it is possible to iden-
tify the ROI and POI.
Data pre-processing is done in 2 major stages such
as (1) Denoise which removes duplicate data records
and anomalies occured due to location accuracies, and
(2) Time sync which aligns data from different tables
in relevant time slots.
After pre-processing stage, the raw location data
were clustered using k-means clustering technique
(Lau et al., 2017) and generated a summary database
for each user, which contains the parameters as shown
in Table 1. A total 1781 number of clusters were gen-
erated from raw data of all 50 users.
Identifying Points of Interest for Elderly in Singapore through Mobile Crowdsensing
61
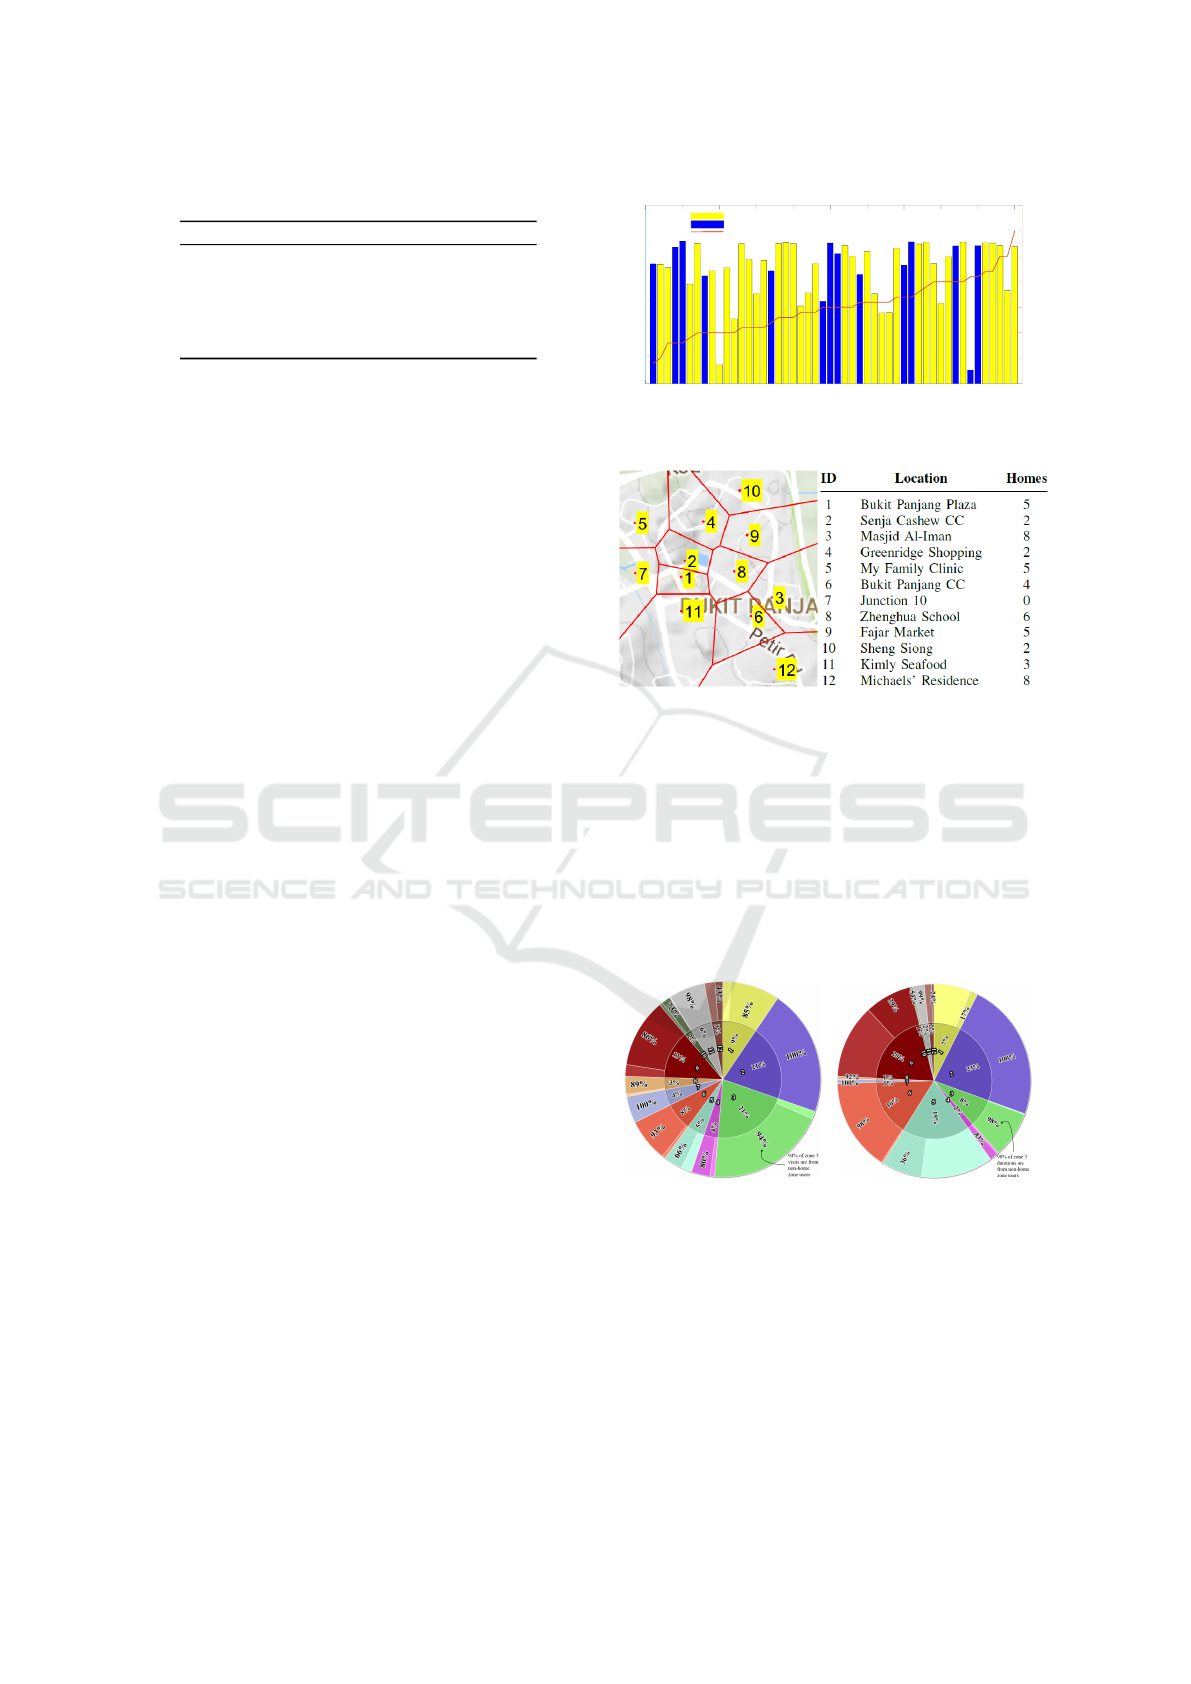
Table 1: Parameters in the summary database.
Parameter Remarks
ID Unique user ID
Gender Male/Female
Age User’s age
Location Latitude and Longitude of cluster location
Purpose Purpose of visit (e.g. H-Home, G-Grocery, W-Work)
Duration Time spent in particular cluster
Visits Number of visits to particular cluster
Total Time Duration of first and last record from user
4 REGIONS OF INTEREST
ROI analysis is done in three categories. First, we
identify the percentage of home stay duration of each
user out of their total participation time. Next we
identify the ROI across user neighbourhood, which
is Bukit Panjang, Singapore. Further, an analysis is
done across Singapore to identify islandwide ROI.
ROI are analysed using a technique called Voronoi
Diagrams. In a Voronoi diagram, a plane is parti-
tioned into n points such that each polygon contains
one seed and every point in each polygon is closer to
the seed inside each polygon than to any other one.
These polygons are called Voronoi zones (Aurenham-
mer, 1991).
4.1 Home Stay Duration
Figure 2 shows the percentage of time each partici-
pant spent at home, out of his/her total participation
duration for data collection. It also shows the age and
gender of each of the participant. The oldest partici-
pant is 75 years old, and the average age for partici-
pants is 60 years. There are 28% of male, and 72% of
female participants. It can be seen that a large num-
ber of participants spend a large amount of their time
at home, in particular 44% of participants stayed at
their homes for more than 21.6 hours a day on av-
erage, 22% of participants stayed at their homes be-
tween 19.2 and 21.6 hours a day on average, 8% of
participants stayed at their homes between 16.8 and
19.2 hours a day on average, 10% of participants stay
at their homes between 14.4 and 16.8 hours a day
on average, and 16% of participants stayed at their
homes less than 14.4 hours a day on average. It can
be noticed that participant IDs 10 and 44, have sub-
stantially lower home stay duration, when compared
to others. One possible reason for such a result is they
switch off their mobile phones at night.
0 5 10 15 20 25 30 35 40 45 50
Users
0
20
40
60
80
100
120
Percentage
45
50
55
60
65
70
75
80
Age (Years)
Percentage Home Stay Duration and Ages of Users
Female
Male
Age
Figure 2: Percentage of home stay duration, gender, and age
of each user.
Figure 3: Voronoi zones and the number of participant
homes in each Voronoi zone across Bukit Panjang.
4.2 Across Neighbourhood
We divided Bukit Panjang area into 12 Voronoi
Zones, in order to get an understanding about partici-
pants’ home region since all of them are residents of
Bukit Panjang. The Voronoi zone distibution, zone
number, and number of participant homes in each
Voronoi zone is shown in Figure 3.
(a) Percentage of visits. (b) Percentage of durations.
Figure 4: Voronoi zones in Bukig Panjang area and percent-
ages of non-home zone visit and durations.
Figure 4a shows the percentage of visits in each
region and Figure 4b shows the percentage of dura-
tions in each region. In both Figures, the inner cir-
cles display the Voronoi zone number and percentage
of visits/duration accordingly. The outer rings show
the percentages of aforementioned percentages con-
tributed by non-home zone participants.
SMARTGREENS 2017 - 6th International Conference on Smart Cities and Green ICT Systems
62
From the Figures, it can be observed that visits and
durations in zone number 2 (Senja Cashew CC) and
zone number 7 (Junction 10) have 100% of non-home
zone participants, which means, all the participants
who visit and spend time in those two zones are resid-
ing outside them. Especially, none of the participant
homes are located in zone number 7. Zone number
2 also shows the highest percentage duration, while
zone number 3 (Masjid Al-Iman) shows the highest
percentage of visits.
Another interesting observation is that, zone num-
ber 3 has higher percentage of visits when compared
to percentage of duration of the same. The reason for
such a result is, because the Bangkit LRT station is
located inside zone number 3. In terms of percentage
duration, zones 2 and 6 are popular among non-home
zone participants. Zones 5 and 9 are popular among
home zone participants. The reason for such popular-
ity is because those zones include POI such as Bukit
Panjang CC (zone 6), Senja Cashew CC (zone 2), and
Fajar Market (zone 9).
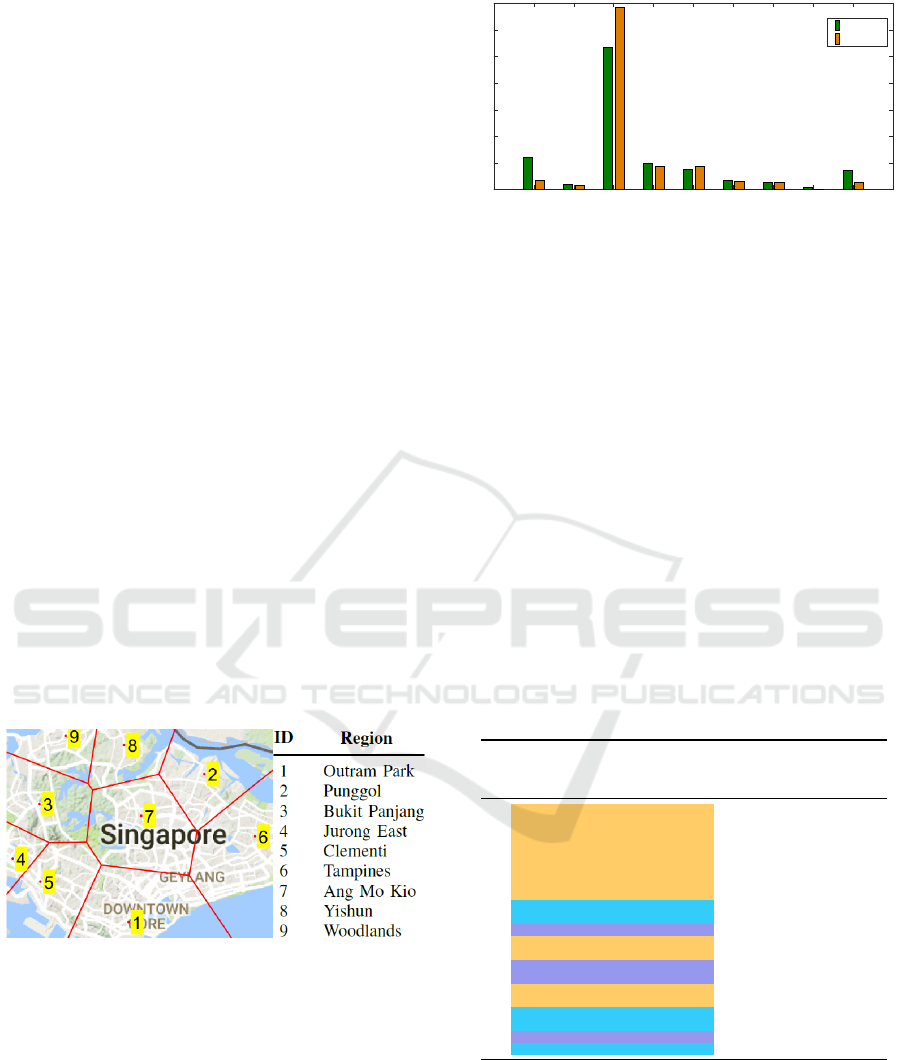
4.3 Across Singapore
The map of Singapore is divided into 9 Voronoi zones
in order to understand what regions across Singapore
are in interest of users in terms of number of visits and
duration of time spent. The Voronoi seeds are selected
to cover the main regions of entire Singapore. The
Voronoi zone distibution and zone names are shown
in Figure 5.
Figure 5: Voronoi zones across Singapore.
Figure 6 shows the percentage number of visits
and durations for each region across Singapore. It
can be observed from the Figure that region number
3 (Bukit Panjang) is the most popular among partic-
ipants, in terms of both visits and duration. In fact,
53.5% of visits and 68.6% of durations belong to that
region. The reason for such popularity is because all
the participants are residing in Bukit Panjang area and
they tend to visit places nearby their homes. Apart
from that, regions 1, 4, 5, and 9 are popular regions.
However, regions 1 and 9 tend to have shorter dura-
tion than visits.
1 2 3 4 5 6 7 8 9
Regions
0
10
20
30
40
50
60
70
Percentage
Visits
Duration
Figure 6: Percentage of number of visits and duration across
regions in Singapore.
5 POINTS OF INTEREST
Next, we analyze in deeper details for each specific
POI, we have performed POI extraction and ranked it
according the number of participant and time stayed.
For privacy reason, we have removed participants’
home and work places. Later, we have clustered com-
mon POI among the participant using density based
clustering with radius of 100m (hence the POI indi-
cated later on include also nearby related POI). After
clustering process done, we have obtained 980 POIs
from the collected data.
5.1 POI Correlates with Number of
Participants and Stay Time
Table 2: POI Ranking based on Number of participants
Checked In.
No. Point of Interest
Percentage of
Participants
visit
Average Hours
Spent Per
Participant
Per Visit
1 Bukit Panjang Hawker Center 68% 3.7
2 Bukit Panjang Plaza 56% 2.9
3 Bukit Panjang Community Center 34% 1.9
4 Fajar Shopping Centre 30% 2.5
5 Senja Cashew Community Club 28% 4.4
6 Holland Bukit Panjang Town Council 28% 2.2
7 Block 125 Neighborhood Stores 26% 3.0
8 Lot One Shopping Mall 24% 1.7
9
National Healthcare
Group Pharmacy - Choa Chu Kang
22% 1.7
10 Chinese Temple at Bencoolen Link 22% 0.9
11 Greenridge Shopping Centre 20% 2.5
12 Ten Mile Junction Mall 20% 2.2
13 Plaza Singapura 18% 2.6
14 Causeway Point 18% 1.6
15 Block 172 Neighborhood Stores 16% 2.4
16 Zheng hua Community Club 16% 2.0
18
Teck Whye Ave
Neighborhood Stores
16% 1.3
19 Temple Street at China Town 16% 1.2
20 Phoenix Road Shop Lots 14% 2.6
Orange - Within Bukit Panjang Area, Blue - Within 5KM range of Bukit Panjang, Purple
- 5KM away from Bukit Panjang
We have plotted the heat maps for the participants’
based on the number of check in across Singapore as
displayed in Figure 7. The heat zones are shown in red
color, where the yellow color indicates the places, that
less participants visited. High heat area are circled
and pointed out int the maps, and we do not include
Identifying Points of Interest for Elderly in Singapore through Mobile Crowdsensing
63

Histogram on Check In Hours Total Time Spent on Day of Week
(a-1)Bukit Panjang Community Center
1AM 6AM 12PM 6PM 12AM
Time, from 0000 to 2359 Hours
0
10
20
30
40
50
60
70
Number of Check Ins
(b-1)Senja Cashew Community Center
1AM 6AM 12PM 6PM 12AM
Time, from 0000 to 2359 Hours
0
10
20
30
40
50
60
70
Number of Check Ins
(a-2)Bukit Panjang Community Center
SUN MON TUE WED THU FRI SAT
Day of Week
0
10
20
30
40
50
Total Time Spent (Hours)
(b-2)Senja Cashew Community Center
SUN MON TUE WED THU FRI SAT
Day of Week
0
10
20
30
40
50
Total Time Spent (Hours)
(c-1)Bukit Panjang Plaza
1AM 6AM 12PM 6PM 12AM
Time, from 0000 to 2359 Hours
0
20
40
60
80
100
Number of Check Ins
(d-1)Fajar Shopping Center
1AM 6AM 12PM 6PM 12AM
Time, from 0000 to 2359 Hours
0
20
40
60
80
100
Number of Check Ins
(c-2)Bukit Panjang Plaza
SUN MON TUE WED THU FRI SAT
Day of Week
0
10
20
30
40
50
Total Time Spent (Hours)
(d-2)Fajar Shopping Center
SUN MON TUE WED THU FRI SAT
Day of week
0
10
20
30
40
50
Total Time Spent (Hours)
(e-1)Bukit Panjang Hawker Center and Market
1AM 6AM 12PM 6PM 12AM
Hours, from 0000 to 2359 Hours
0
50
100
150
200
250
Number of Check Ins
(e-2)Bukit Panjang Hawker Center and Market
SUN MON TUE WED THU FRI SAT
Day of Week
0
20
40
60
80
100
Total Time Spent (Hours)
Note:
Fig. 8(a-1), (a-2), (b-1), and (b-2) - Similar Pattern, the difference is time spent on Sunday and Monday.
Fig. 8(c-1) is Gaussian shape histogram, while Fig. 8(c-2) is two peaks histogram; both have one or two fixed participants, who always visit those POI.
Fig. 8(e-1) and (e-2) - morning place, and Monday no market so less, other days balanced
Figure 8: Check In Time and Time Spent for the following POI (Top to Bottom, Left to Right): (a) Bukit Panjang Community
Center, (b) Senja Cashew Community Center, (c) Bukit Panjang Plaza, (d) Fajar Shopping Center, and (e) Bukit Panjang
Hawker Center and Market.
Bukit Panjang Area as it is nearby to the home of par-
ticipants. We have highlighted a few high heat zone
area using circle and labeled it accordingly. We pre-
sented in Table 2 the top POI and time spent per visit
for the elderly, which the ranking is evaluated based
on the number of participants checked in. The POI
highlighted in orange indicates the POIs are located
within the Bukit Panjang area, where the blue color
indicates POI are within the 5 kilometers of the Bukit
Panjang area (nearby POI). Lastly, the purple color
indicates the POI, that are located outside of Bukit
Panjang area.
Based on observation, we noticed the top POI con-
sists of locations from Bukit Panjang area. Hawker
center and community center are the most common
China Town
Bugis
Lot One
Shopping Mall /
Chua Chu Kang MRT
Teck Whye Ave /
Chua Chu Kang
Community Club
Marina Square
City Plaza /
One KM Mall
Buono Vista
MRT Station
Jurong East,
J-Walk Area
Marsiling MRT
Shopping District
Woodlands MRT
Jurong Point
Clementi
MRT Station
Ikea
Alexandra
Ochard
Road
Limbang Park /
Choa Chu Kang
Sports Hall
Sembawang
God of Wealth
Temple
Figure 7: POI heat maps across Singapore.
places among the participants, where at least 1 hour
55 minutes per visit time spent is recorded. Then
the ranking followed by the shopping mall and neigh-
bourhood stores. Note that, a high density block
(HDB) can be a multi purposes places such as Rank
7, Block 125, which have grocery store and traditional
medical center at first storey of the building. So, it is
not a uncommon situation in Singapore’s highly den-
sity new town area development. Participants have
spent an average of 2.5 hours in the Bukit Panjang
shopping mall area (Bukit Panjang Plaza, Fajar Shop-
ping Centre, Greenridge Shopping Centre, and Ten
Milt Junction Mall) per visit.
Next, we discuss the POI, located outside Bukit
Panjang area. As shown in Figure 7, there are a
handful of location outside of Bukit Panjang area dis-
tributed across central area (China Town and Bugis),
west south area(Jurong and Clementi), Bukit Panjang
nearby area, and north area (Woodlands). A top com-
mon area among the elderly is National Healthcare
Group Pharmacy, where it is located 2 kilometers
away from Bukit Panjang area. Other POI area are
mostly shopping malls and temples, which can be re-
lated to local cultures and religion.
In a nutshell, participants have the tendency to
visit nearby amenities for daily convenience. It can be
highly related to the transportation accessibility and
SMARTGREENS 2017 - 6th International Conference on Smart Cities and Green ICT Systems
64

travel time. However, when it comes to shopping, re-
ligious, and medical purposes, participants are more
likely to travel further.
5.2 POI Correlates with Check In Time
and Time Spent
After obtaining the POI ranking, we investigate the
check in time and time spent for each POI and the
results are displayed in Figure 8. We have divided the
analyzed data into two categories, which are check
in time according to hour of the day and time spent
according to the day of the week.
First, we analyzed the top POI from previous sec-
tion, which are Bukit Panjang Hawker Center and
Market. Based on the observation, we can consider
it as a morning place, where morning (8am - 10am)
have a lot check in compared to other hours. By com-
bining the day spent for different time of the week
reveals that Monday have less time spent there com-
pared to other days. The main reason is the operating
commercial hour of local market, where Monday is
the rest day. By compiling the information collected,
it implies Bukit Panjang Hawker Center is a place,
where most elderly would go to either secure their
grocery or other personal purposes. Note that, partici-
pants could have go the Bukit Panjang Hawker Center
for different purposes, and we only consider majority
purpose collected from the survey.
Next, we discuss about the shopping complex,
that majority elderly have checked in during the data
collection subsequently after Bukit Panjang Hawker
Center. There are two shopping complexs studied
here, which are Bukit Panjang Plaza and Fajar Shop-
ping Center. The pattern for both shopping complex
is diverse, that for Bukit Panjang Plaza is in Gaussian
distribution shape and Fajar Shopping Center is in two
peaks shape. It shows checked in time might highly
correlate with the location of the shopping mall. For
example, Bukit Panjang Plaza is Mass Rapid Transit
interchange, which is presumably have more checked
in compared to Fajar Shopping Center. We noticed
one or two participants that frequently spend their
time there and contribute a lot of hours.
Another common POI for the participants would
be community center. It is observed that both Bukit
Panjang and Senja Cashew Community center have
similar check in patterns, where morning and evening
are the high checked in time for the elderly. How-
ever, by comparing the number of hours spent for in
a week, there is a significant variance between Bukit
Panjang Community center and Senja Cashew Com-
munity club. Bukit Panjang Community center has
more check in in Monday and Sunday and we believe
the reason could be linked with the activity a commu-
nity center offered and transportation accessibility to
reach there.
In conclusion, we noticed participants are likely to
go to Bukit Panjang Hawker Center and Community
Center in the morning. Such pattern can be differ-
ent subject to commercial operating hours and activ-
ities offered. However, contrast to community center
and hawker center, the visit pattern of participants on
shopping mall is highly correlates with the location of
the mall itself.
5.3 POI Correlates with Gender and
Working Type
The heatmaps according to different gender and
working type are presented in Figure 9. The highly
active gender corresponding to the working type are
highlighted with red bold boxes.
Working - female
Working - male
Non working - female
Non working - male
Figure 9: working type w.r.t. gender (a) Non working fe-
male, (b) Non Working male, (c) Working female, and (d)
Working male. (Top to bottom and Left to right).
First, we observed non working female are more
active than non working male elderly. A lot non work-
ing female elderly went to the center area for shop-
ping purposes. To name a few common spot for the
female participants are Bugis, Marina Square, China
Town, Orchard Road, and etc. Based on previous
data, we can draw a conclusion that majority of the
POI in central area are highly consists of shopping
malls etc. Contrast to female participants, non work-
ing male participants travel less and mostly spend
their time in Bukit Panjang nearby POI. However, we
noticed participants are willing travel more than 10
kilometers for religious purposes.
In contrast, working male participants are more
active that the female participants in term of traveling
around Singapore when they are working. It might be
correlates to the work nature and we yet to investigate
such occurrence. As for female participants, the heat
of maps is shift towards central and bottom part of
Identifying Points of Interest for Elderly in Singapore through Mobile Crowdsensing
65

the Singapore, where the male participants are spread
evenly.
Lastly, non working female and working male are
most active categories compared to working female
and non working male participants. It is hard to de-
termine what is the main factor that segregate the be-
havior of male and female according to their working
type. One things can be studied in our future works
maybe can correlates their age and their hobby to de-
termine the actual factor of separation.
6 CONCLUSIONS
In conclusion, this paper introduces an approach to
identify ROI and POI where elderly in Singapore pre-
fer to visit and spend their time. Using smartphone
based mobile application, it is possible to collect de-
tailed information with quantitative measurement.
In future, our intention is to identify the trans-
portation mode (e.g. walking, taking bus, taking train)
of the users, and profile each user by creating a user
mobility profile. The multi-sensor data collected from
smartphones make it possible to implement sensor fu-
sion techniques to determine high level information
about user behavior.
ACKNOWLEDGMENTS
Authors would like to express their sincere gratitude
to all the participants in the study who allowed us to
collect their location information. We would like to
thank everyone who spared their time to help us in
the process of elderly recruitment. This research is
supported by the Lee Kuan Yew Centre for Innova-
tive Cities under Lee Li Ming Programme in Aging
Urbanism.
REFERENCES
Arab, F., Malik, Y., and Abdulrazak, B. (2013). Evalu-
ation of phonage: an adapted smartphone interface
for elderly people. In IFIP Conference on Human-
Computer Interaction, pages 547–554. Springer.
Aurenhammer, F. (1991). Voronoi diagrams a survey of a
fundamental geometric data structure. ACM Comput-
ing Surveys (CSUR), 23(3):345–405.
Capella, L. M. and Greco, A. J. (1987). Information sources
of elderly for vacation decisions. Annals of Tourism
Research, 14(1):148–151.
Department of Statistics, S. (2016). In Statistics Singapore
- Resident Old-Age Support Ratio. Sing Stat.
Fahim, M., Fatima, I., Lee, S., and Lee, Y.-K. (2012). Daily
life activity tracking application for smart homes us-
ing android smartphone. In Advanced Communication
Technology (ICACT), 2012 14th International Confer-
ence on, pages 241–245. IEEE.
Ghiani, G., Manca, M., Patern
`
o, F., and Santoro, C. (2013).
Towards an architecture supporting social, adaptive
and persuasive services for active elderly. In CASFE,
pages 36–41.
Helal, S., Winkler, B., Lee, C., Kaddoura, Y., Ran, L.,
Giraldo, C., Kuchibhotla, S., and Mann, W. (2003).
Enabling location-aware pervasive computing appli-
cations for the elderly. In Pervasive Computing and
Communications, 2003.(PerCom 2003). Proceedings
of the First IEEE International Conference on, pages
531–536. IEEE.
Hiyama, A., Nagai, Y., Hirose, M., Kobayashi, M., and
Takagi, H. (2013). Question first: Passive interaction
model for gathering experience and knowledge from
the elderly. In Pervasive Computing and Communica-
tions Workshops (PERCOM Workshops), 2013 IEEE
International Conference on, pages 151–156. IEEE.
Kim, S.-C., Jeong, Y.-S., and Park, S.-O. (2013). Rfid-based
indoor location tracking to ensure the safety of the el-
derly in smart home environments. Personal and ubiq-
uitous computing, 17(8):1699–1707.
Lau, B. P. L., Hasala, M. S., Viswanath, S. K.,
Thirunavukarasu, B., Yuen, C., Yuen, B., and Nayak,
R. (2017). Extracting point of interest and classifying
environment for low sampling crowd sensing smart-
phone sensor data. CoRR, abs/1701.03379.
Liu, R., Huski
´
c, G., and Zell, A. (2015). On tracking dy-
namic objects with long range passive uhf rfid using a
mobile robot. Int. J. Distrib. Sen. Netw., 2015.
Mirri, S., Prandi, C., Salomoni, P., Callegati, F., and Campi,
A. (2014). On combining crowdsourcing, sensing
and open data for an accessible smart city. In 2014
Eighth International Conference on Next Generation
Mobile Apps, Services and Technologies, pages 294–
299. IEEE.
Pang, N., Zhang, X., Vu, S., and Foo, S. (2014). Smart-
phone use by older adults in singapore. Gerontech-
nology, 13(2):270.
SUTDDev (2015). In City - Location tracking application.
Google Play.
Viswanath, S. K., Yuen, C., Ku, X., and Liu, X. (2014).
Smart tourist-passive mobility tracking through mo-
bile application. In International Internet of Things
Summit, pages 183–191. Springer.
Yassin, A., Nasser, Y., Awad, M., Al-Dubai, A., Liu, R.,
Yuen, C., Raulefs, R., and Aboutanios, E. (2017). Re-
cent advances in indoor localization: A survey on the-
oretical approaches and applications. IEEE Commu-
nications Surveys Tutorials, PP(99):1–1.
SMARTGREENS 2017 - 6th International Conference on Smart Cities and Green ICT Systems
66
