
Model Validation of an Open-source Framework for Post-processing
INS/GNSS Systems
Rodrigo Gonzalez
1
, Carlos A. Catania
2
, Paolo Dabove
3
, Juan Carlos Taffernaberry
1
and Marco Piras
3
1
GridTICs, National University of Technology, Mendoza, Argentina
2
ITIC, FCEyN, National University of Cuyo, Mendoza, Argentina
3
Department of Environmental, Land and Infrastructure Engineering (DIATI), Politecnico di Torino, Torino, Italy
Keywords:
GIS, Post-processing, INS, GNSS, Allan Variance, Model Validation, MATLAB, Navigation Systems.
Abstract:
The development of new approaches in the GIS research community may require the use of a computational
tool to post-process GNSS and inertial sensors data in order to get more accurate position, velocity, and orien-
tation angles (attitude) information. An open-source framework for simulating integrated navigation systems
(INS/GNSS) called NaveGo has been developed using MATLAB/GNU Octave and is freely available on-line.
Although preliminary tests have shown that NaveGo appears to work properly, a deep examination must be
carried out to confirm that this framework is an adequate tool for post-processing INS/GNSS information.
The main goal of this work is to produce a validation methodology to show that NaveGo mathematical model
works within its specifications. Firstly, static measurements from inertial sensors are processed and analysed
by NaveGo applying the Allan variance for profiling typical errors. Some details of Allan variance procedure
are exhibited. Then, performances of NaveGo and Inertial Explorer, a closed-source commercial package
software for INS/GNSS integration, are compared for a real-world trajectory. It is statistically concluded that
NaveGo presents close accuracy to Inertial Explorer for attitude and position. Consequently, it is demonstrated
that NaveGo is an useful INS/GNSS post-processing framework that can be used in GIS applications.
1 INTRODUCTION
An integrated navigation system is an electronic de-
vice comprised of several types of sensors that takes
advantage of the strengths of each sensor so that to
get better estimates of position, velocity, and attitude
(PVA), where the latter is defined as the orientation
of an object with respect to a particular frame of ref-
erence. Typically, an integrated navigation system
fusions the information provided by an inertial nav-
igation system (INS), which in turn is compounded
by an inertial measurement unit (IMU), and one or
more aiding sensors, commonly just a GNSS receiver
(GPS, GLONASS, etc.). This particular system is
known as an INS/GNSS system.
An INS provides PVA information with high rates
but with unbounded errors since its operation is based
on the integration of noisy inertial measurements. On
the other hand, a GNSS receiver gives position and
velocity with bounded errors but at a lower frequency
(Dabove et al., 2011). The fusion of observations in
the INS/GPS system is carried out by an extended
Kalman filter (EKF), which is a well-known algo-
rithm for moderate nonlinear systems that operates
recursively on both noisy input and output data to sta-
tistically produce optimal estimates of the EKF states
(Groves, 2008).
Prior to process IMU data in an INS/GNSS sys-
tem, it is mandatory to analyse and to measure the
inaccuracies that a particular IMU displays. Then,
the EKF can be configured with an accurate IMU
profile to get a more precise PVA solution from the
INS/GNSS system. The Allan variance (Allan, 1966)
is a technique that has demonstrated to be useful
to identify and to quantify IMU noise processes, as
quantisation noise, angle random walk, and bias in-
stability, among others (IEEE-SA Standards Board,
1998; El-Sheimy et al., 2008). This procedure is one
of the most used for profiling IMU imprecisions.
Recently, INS/GNSS systems have gained re-
searchers’ attention from the GIS community for the
potential this technology has in certain GIS disci-
plines (Dabove et al., 2017). For example, land and
airborne mobile mapping are fields where INS/GNSS
systems offer more precise (sub-centimetre-level ac-
curacy) and reliable data than a GNSS-only solution
Gonzalez, R., Catania, C., Dabove, P., Taffernaberry, J. and Piras, M.
Model Validation of an Open-source Framework for Post-processing INS/GNSS Systems.
DOI: 10.5220/0006313902010208
In Proceedings of the 3rd International Conference on Geographical Information Systems Theory, Applications and Management (GISTAM 2017), pages 201-208
ISBN: 978-989-758-252-3
Copyright © 2017 by SCITEPRESS – Science and Technology Publications, Lda. All rights reserved
201

(Navidi and Landry, 2015). Besides, orientation of
the camera in the mobile mapping system is needed to
correctly superpose images and this information can-
not be provided by a GNSS receiver.
In the development of new research methodolo-
gies in GIS, it may be convenient to have at hand
a computational tool to post-process GNSS and INS
data from different sensors vendors. Some commer-
cial, closed-source software can be found in the mar-
ket for this purpose as TerraPos by TerraTec AS (Ter-
raTec AS, 2017), POINT by the University of Can-
terbury (Spatial Engineering Research Centre, Uni-
versity of Canterbury, 2017), Inertial Explorer by
NovAtel Inc. (NovAtel Inc., 2013), and Kinemat-
ica by Advanced Navigation (Advanced Navigation,
2016). According to the provided vendors’ informa-
tion, none of these software packages applies Allan
variance analysis. The license cost for these programs
ranges from USD 2,000 per year (Advanced Naviga-
tion, 2016) to USD 13,000 for a full, non-time limited
license (NovAtel Inc., 2013). This expense could be
prohibited for some research groups which are giving
their first steps in Geomatics or GIS.
An open-source INS/GNSS simulation framework
could be a zero-cost alternative to commercial soft-
ware. In addition, an open-source software may let
some new ideas in the GIS community be rapidly
proved, but also enable other researchers to compare
their new approaches against already proposed GIS
solutions in a fairly and repeatability way, both cen-
tral aspects of the scientific method, by using the same
computational tool. Additionally, it could be inter-
esting that this open-source tool to offer a procedure
to apply the Allan variance to IMU measurements in
order to profile the device intrinsic noises (Piras and
Dabove, 2016).
NaveGo is an open-source framework for simulat-
ing loosely-coupled INS/GNSS systems that is freely
available on-line (Gonzalez, 2016). It is developed
using MATLAB/GNU Octave due to this program-
ming language has become a de facto standard for
simulation and mathematical computing. Previous
publications have exposed its complete mathematical
model (Gonzalez et al., 2015a) and how inertial sen-
sors and GPS receiver can be simulated in a simpli-
fied way (Gonzalez et al., 2015b). NaveGo has been
tested by processing real-world data from a real tra-
jectory (Toth et al., 2011). Results from that test have
been around expected values (Gonzalez et al., 2015a).
Although NaveGo has shown to work properly, a
more thoroughly examination must be carry out to
confirm that this framework can be considered a se-
rious tool for post-processing INS/GNSS data. Thus,
the main goal of this paper is to successfully produce
an empirical model validation methodology that en-
sures that NaveGo conforms to its specification. In
doing so, it is proposed to validate NaveGo model
by comparison to another reference model (Sargent,
2013), in particular to Inertial Explorer, a mature and
well-known commercial software for INS/GNSS in-
tegration. Model validation is done by comparison
of the results of both INS/GNSS solutions by pro-
cessing field data sets. It is worth mentioning that
after an exhaustive search in the existing literature, it
has not been found previous works related to compare
INS/GNSS computational models.
In spite of the fact that some few another
INS/GNSS data processing software have been pro-
posed in the literature (Giroux et al., 2003; Niu et al.,
2015), these tools are neither open source nor freely
available. It is the authors’ believe that NaveGo
is the first coordinated academic effort to develop
an open-source INS/GNSS processing framework for
both navigation and GIS communities.
The rest of this paper is organised as follows. In
Section 2, Allan variance procedure performed by
NaveGo is shown by processing static measurements
from the same IMU unit that will be used to validate
NaveGo mathematical model. Section 3 details the
kinematic data set that is used to validate NaveGo,
and presents the comparison method to analyse the
uncertainties from both NaveGo and a Inertial Ex-
plorer. Finally, Section 4 completes this paper com-
menting results and providing conclusions.
2 ALLAN VARIANCE
PROCEDURE
The Allan variance (AV) is a widely known tech-
nique to estimate particular inaccuracies in inertial
sensors. Though IMU manufacturers provide sensors
characterisation information, these are average val-
ues among several units from a particular production
batch. Often, a more precise inertial sensor profile
may be needed to improve the PVA solution. Theo-
retical foundations about the AV can be found in the
literature (Allan, 1966; El-Sheimy et al., 2008; IEEE-
SA Standards Board, 1998) and are out of the scope
of this paper.
2.1 Static Data Set Description
AV analysis is performed by using data from an
Ekinox-D IMU which is a tactical-grade IMU from
SBG Systems (SBG Systems, 2016). This same IMU
will be used in Section 3 for processing a kinematic
solution with NaveGo.
GISTAM 2017 - 3rd International Conference on Geographical Information Systems Theory, Applications and Management
202

In applying the AV technique, it is mandatory
to only process static measurements (IEEE-SA Stan-
dards Board, 1998). Accordingly, a six-faces static
test is performed fixing the Ekinox-D IMU on a non-
magnetic plate, and aligning the device by the y-axis
to exclude errors due to orientation. IMU data is ac-
quired about 6 hours at 200 Hz sampling rate in an
undisturbed environment. Complete procedure took
place at one of DIATI’s laboratories.
Statistical information obtained for each sensor
from static measurements are static bias, which is the
mean, and standard deviation. The latter is related to
the level of white noise presented in the sensor. Val-
ues of these two errors from the six Ekinox-D IMU
sensors in the three body axes XYZ are shown in Ta-
ble 1.
Table 1: Static biases and standard deviations from static
analysis of Ekinox-D inertial sensors.
Sensor Static bias Standard deviation
(rad/s) (m/s
2
) (rad/s) (m/s
2
)
Gyro X -0.2449E-3 1.0395E-2
Gyro Y 0.1287E-3 0.9951E-2
Gyro Z 0.1513E-3 0.9740E-2
Acc’r X -0.0117 2.7147E-3
Acc’r Y 0.0251 3.2494E-3
Acc’r Z 9.8051 2.5079E-3
2.2 Allan Variance Analysis under
NaveGo
The Allan variance estimator used in NaveGo is the
overlapping Allan variance (Howe et al., 1981). Eq.
1 shows the overlapping AV of a discrete time series,
σ
2
(T ) =
1
2n
2
T
2
(N −2n)
N−2n
∑
k=1
(θ
k+2n
−2θ
k+n
+ θ
k
)
2
,
(1)
where N is the number of consecutive data points
sampled at t
0
seconds, T is the fixed length in time
of N, n is a group of consecutive data points forming
a cluster with n < N/2, and θ is the angle or velocity
measurements made at discrete times given by τ = kt
0
,
k = 1,2,3,...,N. Finally, the square-root of the Allan
variance σ(T ) is represented in a log-log plot versus
τ. This figure will show a curve with different slopes
that are associated to specific types of errors.
Something important to bear in mind is that ev-
ery error found in the AV plot has an intrinsic value
of dispersion due to the finiteness of the number of
clusters, given by the following formula,
σ(δ) =
1
q
2(
N
n
−1)
. (2)
Equation 2 shows that the computed error in a re-
gion of an AV plot is small if the number of data
points in a cluster n is low when compared to the total
number of data points N. Thus, it is important how
these regions are previously defined and, as a conse-
quence, how the time vector τ(kt
0
) is built to get the
smallest σ(δ).
Since AV analysis is based on creating a log-log
plot, it makes sense that time vector τ(kt
0
) has a loga-
rithmic arrangement. Thus, τ(kt
0
) is built in NaveGo
according to Algorithm 1. Variable t0 is the period of
time vector, tM is the maximum value of time, and tm
is the minimum value of time. Pseudo code in Algo-
rithm 1 is similar to MATLAB code for convenience.
In the particular case of the static data set exposed
Algorithm 1: Procedure for creating time vector τ(kt
0
) for
AV analysis.
1: exp_min = log10(t0);
2: exp_max = log10(tM - tm)/2;
3: tau_v = 10ˆ(exp_min:exp_max);
4: for i from 1 to length(tau_v)-1 do
5: tau = [tau tau_v(i):tau_v(i):tau_v(i+1)];
6: end
in Sec. 2.1, time vector spans in a logarithmic fash-
ion from values greater than the minimum time be-
tween samples (0.005 s) to less than a half of total
time (11,044 s).
Figures 1 and 2 expose the square-root overlap-
ping Allan variances for Ekinox-D gyroscopes and
accelerometers, respectively.
Finally, Table 2 exhibits the values found by ap-
plying NaveGo AV method of dynamic biases (bias
instability) and angle random walks and velocity an-
gle random walks, respectively for gyroscopes and ac-
celerometers.
3 NAVEGO MODEL VALIDATION
In this section, NaveGo is validated by comparing its
performance for a real trajectory against a commer-
cial package software for INS/GNSS post-processing.
Testing and reference data sets are described. Then,
results from both frameworks are exposed. Finally, a
detailed statistical comparison of both performances
is carried out.
Model Validation of an Open-source Framework for Post-processing INS/GNSS Systems
203

Table 2: Dynamic biases and random walks from static analysis of Ekinox-D inertial sensors.
Sensor
Dynamic bias Error Random walk Error Correlation
(rad/s) σ(δ) (rad/s/
√
Hz) σ(δ) time (s)
(m/s
2
) (m/s
2
/
√
Hz)
Gyro X 1.5157E-4 ± 7.2115E-8 1.1450E-5 ± 5.5231E-9 300
Gyro Y 1.6544E-4 ± 7.8715E-8 1.1479E-5 ± 5.5119E-9 200
Gyro Z 1.7746E-4 ± 8.4438E-8 1.3313E-5 ± 6.3924E-9 200
Acc’r X 1.8686E-4 ± 8.8907E-8 9.6088E-5 ± 4.5758E-8 20
Acc’r Y 1.8301E-4 ± 8.7076E-8 7.3059E-5 ± 3.4918E-8 100
Acc’r Z 1.8593E-4 ± 8.8467E-8 7.4684E-5 ± 3.5597E-8 40
10
−2
10
0
10
2
10
−5
10
−4
10
−3
10
−2
τ (s)
σ (rad/s)
Gyro X
Gyro Y
Gyro Z
Figure 1: Square-root overlapping Allan variance for
Ekinox-D IMU gyroscopes.
10
−2
10
0
10
2
10
−4
10
−3
τ (s)
σ (m/s
2
)
Acc X
Acc Y
Acc Z
Figure 2: Square-root overlapping Allan variance for
Ekinox-D IMU accelerometers.
3.1 Kinematic Data Set Description
The kinematic data set was generated in the city of
Turin by the DIATI group. Several sensors were in-
stalled on a crosswise aluminium bar mounted on the
roof of a vehicle, as shown in Fig. 3. Two GNSS
geodetic antennas (yellow circles in Fig. 3) were in-
stalled at the opposite ends of the bar in the direction
of motion. Then, they were connected to the Ekinox-
D platform (blue circle in Fig. 3). The Ekinox-D unit
was inserted into an aluminium skeleton on which a
third geodetic antenna was placed using a plate, cen-
tred exactly on the source of the reference system of
the inertial sensor (XY centre).
Figure 3: Instruments located on the crosswise bar of a ve-
hicle.
The positions of both antennas and sensors are cal-
culated in planimetry and altimetry by a small net-
work of distances using StarNet 7.0 software (Mi-
croSurvey, 2016), following a least-squares approach,
and reaching a maximum root-mean square error of
about 2 mm. This enables the lever arm of the system
to be obtained with high accuracy.
This system was registered in a stretch of the Turin
road network. This trajectory is shown in Figure
4, being an urban section with minor obstruction in
terms of buildings. It presents full GPS-signal avail-
ability for the entire trajectory. This path covers about
2 kilometres and takes about 10 minutes. The Ekinox-
D IMU was configured with a sampling rate of 200
Hz, while internal Ekinox-D GNSS receiver was con-
figured to operate at 5 Hz.
Although various sensors are part of this data
set, in this work only measurements from Ekinox-D
device by SBG Systems (SBG Systems, 2016) are
GISTAM 2017 - 3rd International Conference on Geographical Information Systems Theory, Applications and Management
204

Figure 4: The kinematic trajectory in the city of Turin (cour-
tesy of Google Earth (Google Earth, 2016)).
taken into account. Ekinox-D equipment consists
of a tactical-grade IMU and an internal dual-antenna
GNSS receiver (GPS + GLONASS).
Before the logging of measurements, inertial in-
strumentation needs to be calibrated. This step allows
the Ekinox-D system to calculate the approximate
values of the types of biases that vary at each switch
(run-to-run biases). Calibration of IMU is mandatory
in order to get usable information in a post-processing
stage. The calibration phase consists of a path of at
least ten minutes during which it is performed accel-
erations and braking at an average speed of at least 30
km/h, while performing some curves in both clock-
wise and anticlockwise directions. This procedure is
inconvenient to take place in an ordinary street and
was run at an empty parking, as shown in Figure 5.
After the calibration phase, the entire trajectory
was logged without any stop, except of the common
stoppage due to traffic. As seen in the top part of Fig-
ure 4, the kinematic trajectory also includes the final
part of the calibration phase.
Figure 5: Calibration path at an empty parking.
3.2 Kinematic Reference Data Set
A reference data set is formed by processing
the Ekinox-D measurements using IE with tightly-
coupled integration with backward processing. GPS
data is corrected by using the TORI permanent sta-
tion (GNSS Positioning Service of Regione Piemonte
and Regione Lombardia, 2017) as a master GNSS sta-
tion, composed by a multi-constellation and multi-
frequency receiver. Its coordinates have millimetre
accuracy. This is the best possible PVA solution
that can be obtained by using effectively all available
hardware and software resources. The reference data
set comprises attitude and position variables. It has a
sampling frequency of 1 Hz. Table 3 shows the av-
erage standard deviations for each variable from the
kinematic trajectory of Figure 4.
Table 3: Average standard deviations from the reference
data set.
Average standard
deviation
Roll 1.429E-2 deg
Pitch 1.468E-2 deg
Yaw 5.765E-2 deg
Latitude 5.674 mm
Longitude 5.743 mm
Altitude 10.087 mm
3.3 Comparison between NaveGo
Model and Inertial Explorer
The performances of NaveGo and Inertial Explorer
(IE) are compared using the kinematic trajectory de-
scribed in Section 3.1.
Model Validation of an Open-source Framework for Post-processing INS/GNSS Systems
205

IE is a closed-source, commercial software devel-
oped by NovAtel Inc. (NovAtel Inc., 2013), a Cana-
dian firm better known for manufacturing GNSS and
GPS receivers. IE is targeted for integration of IMU
sensors data with GNSS information. IE implements
both loosely-coupled (LC) and tightly-coupled (TC)
integrations. In turn, each integration mode can be
combined with forward or backward (smoothing) pro-
cessing. It is worth mentioning that this tool does not
provide any routine to analyse IMU errors by apply-
ing the Allan variance.
Since NaveGo only supports forward, loosely-
coupled integration, the kinematic data set is also pro-
cessed in IE with this type of solution. For the sake of
a fair comparison, the same values are input to both
frameworks before INS/GPS processing. These in-
put data are IMU errors (specified in Tables 1 and
2), GPS errors, initial position, initial velocity, initial
IMU alignment, and lever arm.
After IMU and GPS data are processed, NaveGo,
IE and GPS estimates are linear-interpolated accord-
ing to the reference time vector (Sec. 3.2). Table
4 shows the root-mean-squared errors (RMSE) from
NaveGo and IE both compared against the reference
data set. RMSE from GPS-only solution are also pro-
vided for analysing INS/GPS improvements in posi-
tion.
Table 4: RMSE from NaveGo, IE, and GPS-only against
the reference data set.
NaveGo Inertial GPS-only
Explorer
Roll 1.34E-01 6.66E-02 − deg
Pitch 3.42E-01 8.54E-02 − deg
Yaw 9.10E-01 2.36E-01 − deg
Latitude 0.877 1.014 0.906 m
Longitude 1.071 0.531 0.782 m
Altitude 1.035 0.932 1.175 m
It can be seen from Table 4 that efficiencies from
both frameworks are close. Nevertheless, IE presents
better performance in attitude. IE also presents bet-
ter estimates in longitude and altitude, but NaveGo
shows better accuracy in latitude. Finally, as observed
in the third column of Table 4, none of the two pack-
ages provides a notably higher performance in posi-
tion when compared with the GPS-only solution.
Since RMSE is an average on the squared dif-
ferences between measurements of interest and ref-
erence values on an entire data set, it can be consid-
ered as a coarse, preliminary performance examina-
tion. Consequently, it is important to make a more
detailed analysis and to verify from a statistical point
of view the results obtained from just one data set.
For statistically evaluating the differences of the
generated navigation estimates from both software
packages, a set of 100 uniformly and randomly sam-
ples is created, with the same pattern for the three
data sets, i.e., interpolated IE, interpolated NaveGo,
and reference. Each sample consists of a fixed-length
window encompassing the same stretch on the three
data sets. The size of each selected stretch is 55 for
this test, which is around the 10% of the size of each
data set. Then, RMSE is calculated for each window.
The sampling distribution of the RMSE for each nav-
igation output is shown in box plots from Figures 6 to
8 for attitude, and from Figures 9 to 11 for position.
IE NaveGo
0
1
2
3
4
5
6
7
RMSE (deg)
#10
-3
Figure 6: Roll RMSE distribution over 100 samples.
IE NaveGo
0
2
4
6
8
10
RMSE (deg)
#10
-3
Figure 7: Pitch RMSE distribution over 100 samples.
In general, IE framework shows one-magnitude
lower RMSE values when compared with NaveGo, a
situation that it is consequent with the results already
observed in Table 4. In particular, the IE RMSE distri-
bution is more concentrated around the median for at-
GISTAM 2017 - 3rd International Conference on Geographical Information Systems Theory, Applications and Management
206
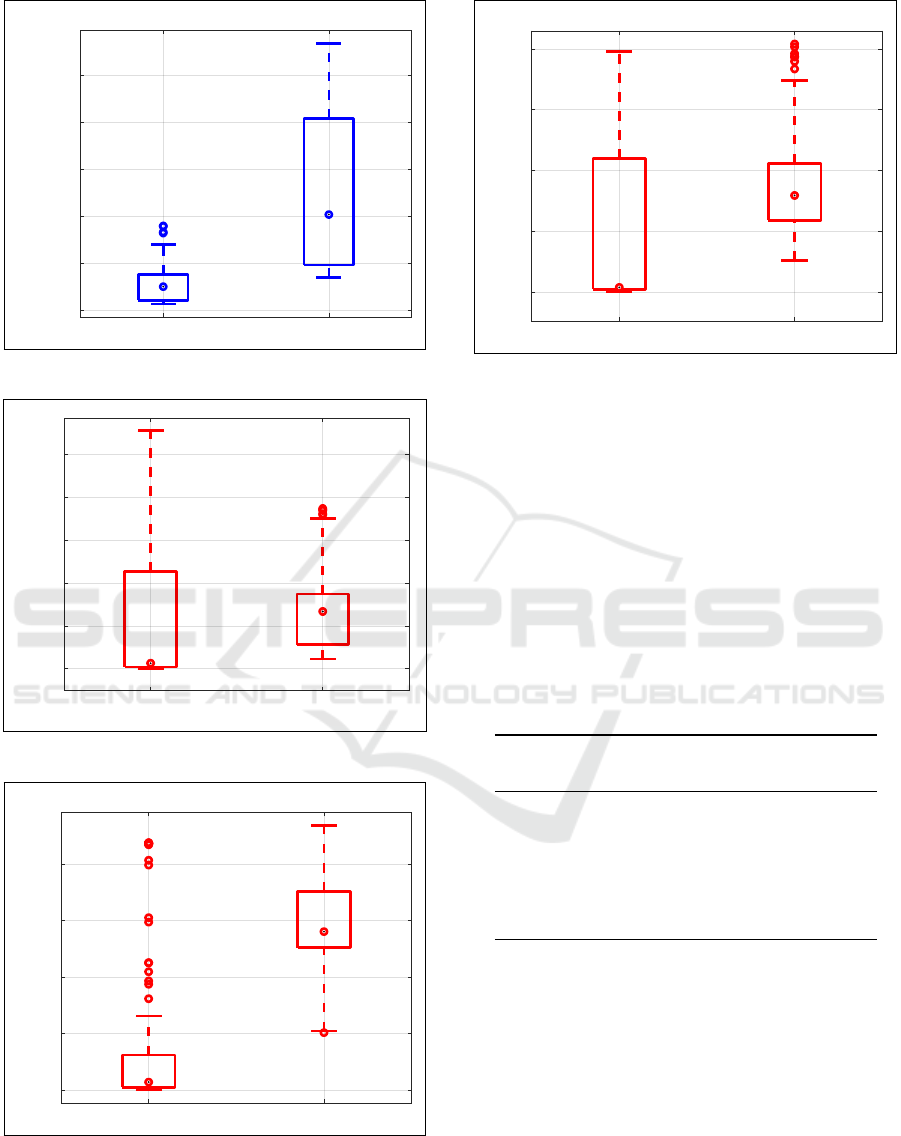
IE NaveGo
0
0.005
0.01
0.015
0.02
0.025
RMSE (deg)
Figure 8: Yaw RMSE distribution over 100 samples.
IE NaveGo
0
0.5
1
1.5
2
2.5
RMSE (m)
Figure 9: Latitude RMSE distribution over 100 samples.
IE NaveGo
0
0.5
1
1.5
2
RMSE (m)
Figure 10: Longitude RMSE distribution over 100 samples.
titude (roll, pitch, and yaw). Such behaviour is not ob-
servable for the remaining three RMSE, latitude, lon-
gitude, and altitude, where IE shows more dispersion
IE NaveGo
0
0.5
1
1.5
2
RMSE (m)
Figure 11: Altitude RMSE distribution over 100 samples.
when compared to the position provided by NaveGo.
For statistically confirming the differences shown
in Figures 6 to 11, a Student’s t-test is applied on the
sampled data. The Student’s t-test checks the null
hypothesis that both framework estimates have equal
means, i.e., no differences exist between them from
a statistical perspective. A p-value lower than 0.05
implies the rejection of the null hypothesis and gives
more confidence on the results.
Table 5 shows the RMSE averages over 100 sam-
ples for both frameworks and the p-values for the six
navigation outputs.
Table 5: RMSE averages for 100 samples and p-values from
the Student’s t-test.
NaveGo Inertial P-value
Explorer
Roll 0.0016 0.0004 1.9E-13
Pitch 0.0054 0.0008 < 2.2E-16
Yaw 0.0132 0.0026 < 2.2E-16
Latitude 1.0E-07 9.3E-08 0.3471
Longitude 2.2E-07 6.4E-08 < 2.2E-16
Altitude 0.8741 0.5380 6.4E-05
With p-values considerably lower than 0.055, the
test concludes with a confidence of 95% that a statis-
tical significant difference between NaveGo and Iner-
tial Explorer is observable for all the navigation out-
puts except in the case of the latitude (highlighted in
bold font). In such case, a p-value of 0.3471 indi-
cates that it is not possible to conclude that a differ-
ence exists between both latitudes. To sum up, the
test results prove to be consistent with the differences
observables in Table 4 and the box plot figures.
Model Validation of an Open-source Framework for Post-processing INS/GNSS Systems
207

4 CONCLUSIONS
In this work, the performance of NaveGo mathemat-
ical model, an open-source MATLAB/GNU Octave
toolbox for Allan variance analysis and INS/GNSS
integration, is contrasted with Inertial Explorer, a
closed-source, commercial software package.
Firstly, Allan variance procedure by NaveGo is
exposed for characterising the errors of a tactical-
grade IMU. It is explained how the time vector for
Allan variance analysis is formed.
Then, performances of NaveGo and Inertial Ex-
plorer are compared for a real-world trajectory. It is
concluded that NaveGo presents similar accuracy to
Inertial Explorer, although the later has better preci-
sion in attitude. On the other hand, a detailed sta-
tistical analysis reveals that NaveGo presents a more
uniform distribution of RMSE in position.
Finally, the validation methodology unfolded in
this work points out that NaveGo algorithms for at-
titude estimation still have some room for improve-
ment, and some software development effort has to
be put into this direction for future work.
REFERENCES
Advanced Navigation (2016). Kinematica reference man-
ual, v1.2 edition.
Allan, D. W. (1966). Statistics of atomic frequency stan-
dards. Proceedings of the IEEE, 54(2):221–230.
Dabove, P., De Agostino, M., and Manzino, A. M. (2011).
Mass-market L1 GPS receivers for mobile mapping
applications: A novel approach. In Proceedings of
the 24th International Technical Meeting of The Satel-
lite Division of the Institute of Navigation (ION GNSS
2011), pages 1068–1074. ION.
Dabove, P., Gonzalez, R., Catania, C., and Piras, M.
(2017). NaveGo: an open-source software for inte-
grated GPS/IMU positioning (in Italian). In Confer-
ence on free open-source software and geographical
data (FOSS4G-IT), Genoa, Italy.
El-Sheimy, N., Hou, H., and Niu, X. (2008). Analysis
and modeling of inertial sensors using Allan variance.
IEEE Transactions on instrumentation and measure-
ment, 57(1):140–149.
Giroux, R., Landry, R. J., Leach, B., and Gourdeau, R.
(2003). Validation and performance evaluation of a
Simulink inertial navigation system simulator. Cana-
dian Aeronautics and Space Journal, 49(4):149–161.
GNSS Positioning Service of Regione Piemonte and
Regione Lombardia (2017). Network stations.
http://www.spingnss.it/spiderweb/frmIndex.aspx.
Gonzalez, R. (2016). NaveGo: an open-source MAT-
LAB/GNU Octave toolbox for simulating integrated
navigation systems and performing Allan variance
analysis. URL: www.github.com/rodralez/NaveGo/.
Gonzalez, R., Giribet, J. I., and Pati
˜
no, H. D. (2015a). An
approach to benchmarking of loosely coupled low-
cost navigation systems. Mathematical and Computer
Modelling of Dynamical Systems, 21(3):272–287.
Gonzalez, R., Giribet, J. I., and Pati
˜
no, H. D. (2015b).
Navego: a simulation framework for low-cost inte-
grated navigation systems. Journal of Control Engi-
neering and Applied Informatics, 17(2):110–120.
Google Earth (2016). Politecnico di Torino, Italy.
45.0625673187 N, 7.6574702408 W. Date of original
imagery: 8/6/2016. Date accessed: 12/18/2016.
Groves, P. D. (2008). Principles of GNSS, Inertial, and
Multisensor Integrated Navigation Systems. Artech
House, USA.
Howe, D. A., Allan, D., and Barnes, J. (1981). Proper-
ties of signal sources and measurement methods. In
Thirty Fifth Annual Frequency Control Symposium.
1981, pages 669–716. IEEE.
IEEE-SA Standards Board (1998). IEEE Standard Specifi-
cation Format Guide and Test Procedure for Single-
Axis Interferometric Fiber Optic Gyros. IEEE Std
952TM-1997 (R2008). IEEE, 2008 edition.
MicroSurvey (2016). Startnet website. URL:
http://www.microsurvey.com/products/starnet/.
Navidi, N. and Landry, R. J. (2015). A new survey on
self-tuning integrated low-cost GPS/INS vehicle nav-
igation system in harsh environment. The Interna-
tional Archives of Photogrammetry, Remote Sensing
and Spatial Information Sciences, 40(1):75.
Niu, X.-j., Zhang, Q., Gong, L.-l., Liu, C., Zhang, H., Shi,
C., Wang, J., and Coleman, M. (2015). Development
and evaluation of GNSS/INS data processing software
for position and orientation systems. Survey Review,
47(341):87–98.
NovAtel Inc. (2013). Inertial Explorer
R
User Guide ver-
sion 8.50, OM-20000106, Rev 9. Canada.
Piras, M. and Dabove, P. (2016). Comparison of two differ-
ent mass-market imu generations: bias analyses and
real time applications. In 2016 IEEE/ION Position,
Location and Navigation Symposium (PLANS), pages
34–41.
Sargent, R. G. (2013). Verification and validation of simu-
lation models. Journal of Simulation, 7(1):12–24.
SBG Systems (2016). Ekinox-D: Dual GPS INS leaflet, v1.2
edition.
Spatial Engineering Research Centre, University of Canter-
bury (2017). POINT software leaflet.
TerraTec AS (2017). TerraPos website. URL:
www.terratec.se/terrapos/cms/125.
Toth, C., Brzezinska, D., Politi, N., and Kealy, A. (2011).
Reference data set for performance evaluation of
MEMS-based integrated navigation solutions. In FIG
Working Week 2011, Marrakech, Morocco.
GISTAM 2017 - 3rd International Conference on Geographical Information Systems Theory, Applications and Management
208
