
A Course Recommender System based on Graduating Attributes
Behdad Bakhshinategh
1
, Gerasimos Spanakis
2
, Osmar Zaiane
1
and Samira ElAtia
1
1
University of Alberta, Edmonton, Canada
2
Maastricht University, Maastricht, The Netherlands
Keywords:
Course Recommender Systems, Graduating Attributes, Collaborative Filtering, Multicriteria Ratings.
Abstract:
Assessing learning outcomes for students in higher education institutes is an interesting task with many po-
tential applications for all involved stakeholders (students, administrators, potential employers, etc.). In this
paper, we propose a course recommendation system for students based on the assessment of their “graduate
attributes” (i.e. attributes that describe the developing values of students). Students rate the improvement in
their graduating attributes after a course is finished and a collaborative filtering algorithm is utilized in order
to suggest courses that were taken by fellow students and rated in a similar way. An extension to weigh the
most recent ratings as more important is included in the algorithm which is shown to have better accuracy
than the baseline approach. Experimental results using correlation thresholding and the nearest neighbors
approach show that such a recommendation system can be effective when an active neighborhood of 10-15
students is used and show that the numbers of users used can be decreased effectively to one fourth of the
whole population for improving the performance of the algorithm.
1 INTRODUCTION
Across institutions of higher education around the
world, one of the topics of research that there is
much focus on is about ensuring the students achieve-
ment of the intended learning outcomes (ILO) set
by various programs. These ILOs are linked to
“competencies” required within programs to perform
specific tasks. Competencies are the ability to do
something successfully or efficiently [Oxford dictio-
nary]. Within academia, competencies are “multidi-
mensional construct composed of the skills, attitudes,
and behaviors of a learner that contribute to academic
success in the classroom” (DiPerna and Elliott, 1999).
It is not necessarily limited to classroom, it encloses
programs and the whole university experience. When
it touches on the latter, these competences lead to at-
tributes that are linked directly to the overall vision
and mission of a specific institution.
The University of Alberta’s provost office in 2011
, undertook a task of identifying its 7 graduate at-
tributes with their 28 sub-attributes (Provost office,
2011). These are proposed to describe the qualities,
values and dispositions that students are develop dur-
ing their time at the university. Graduate Attributes
have been taking momentum since the early 20th cen-
tury. One of the most commonly used definitions of
Graduating attributes (GAs) suggested by Bowden et
al. says:
“Graduate attributes are the qualities, skills and
understandings a university community agrees its stu-
dents should develop during their time with the in-
stitution. These attributes include but go beyond
the disciplinary expertise or technical knowledge that
has traditionally formed the core of most university
courses. They are qualities that also prepare gradu-
ates as agents of social good in an unknown future.”
(Bowden et al., 2000)
In the last two decades, universities have identi-
fied their respective GAs, but ensuring that actually
the acquisition of GAs does happen, has been elusive.
Ipperciel and ElAtia proposed a dynamic model for
assessing the GAs (Ipperciel and ElAtia, 2014). This
model is based on rubrics that are linked to can-do
statement where they introduced a 1 to 5 likert scales
for assessing each of the Graduate Attributes and their
sub-attributes. The 5 levels scale range from emer-
gent, basic, adequate, superior to exceptional. This
model of assessment is based on an interaction from
teachers and students with specific courses and their
ILOs. The model allows students and teachers to
carry out self-assessment based on their own expe-
rience and interaction with course materials. For the
students part, as the assessment progresses, they are
Bakhshinategh B., Spanakis G., Zaiane O. and ElAtia S.
A Course Recommender System based on Graduating Attributes.
DOI: 10.5220/0006318803470354
In Proceedings of the 9th International Conference on Computer Supported Education (CSEDU 2017), pages 347-354
ISBN: 978-989-758-239-4
Copyright
c
2017 by SCITEPRESS – Science and Technology Publications, Lda. All rights reserved

providing more input and the model adjusts to their
profiles using the background survey that they ini-
tially fill. The model for the assessment of the GAs
is longitudinal and is built upon the following trian-
gulation: awareness, motivation and engagement.
In our work, we have adopted this assessment
model of GAs and designed within it a recommender
system that would use the data supplied by the stu-
dents and would recommend courses to students
based on their self-assessment. Although we have im-
plemented a platform for gathering the data needed,
we were not able to gather sufficient amount of data
for the evaluation of a course recommender system.
As a result, for training and testing our model we
needed to generate synthetic data based on the ex-
pected structure of data. We will use this synthetic
data for training and evaluation of our course recom-
mender system.
In this paper, we are describing how the assess-
ment of the GAs can be used to generate course rec-
ommendation. The overall goal of the system is to
recommend to students courses that will improve ei-
ther their average competence profile or specific com-
petences that students would target, for instance, what
courses are recommended for a student in engineer-
ing to take if s/he want to go from an adequate level
to a superior level in critical thinking. The algorithm
relies on assessments date provided by the students
and works in a collaborative filtering context taking
into account the time factor (i.e. recent student as-
sessments add more value to the recommendation).
The rest of the paper is organized as follows: Sec-
tion 2 presents related work in the field. Data used in
the current paper as well as the algorithm framework
of recommendation are presented in Section 3. Exper-
iments are described in Section 4 and finally Section
5 concludes the paper and presents future work direc-
tions.
2 RELATED WORK
There have been many data mining systems devel-
oped in education (Romero and Ventura, 2010) and
especially on how recommender systems can be uti-
lized for suggesting courses (O’Mahony and Smyth,
2007) or master programs (Surpatean et al., 2012).
Most of them use only the actual course content or the
curriculum connections (Lee and Cho, 2011) or the
performance of students based on their grades (Goga
et al., 2015) or past selections of student courses (Chu
et al., 2003) but there is no research work on suggest-
ing courses based on the developing attributes of stu-
dents.
Such a direction would require to go beyond the
traditional recommendation representation of users ×
ratings and adopt a “multicriteria rating” approach
(Adomavicius and Tuzhilin, 2005). In this direction,
there have only been a few attempts in the course rec-
ommendation concept (Le Roux et al., 2007) but none
takes into account graduating attributes.
Finally, new approaches have emerged that take
into account the dynamical nature of ratings data (i.e.
introduce the time dimension) (Vinagre, ), which is
also a direction not yet studied in educational sys-
tems. Given the fact that educational data are also
spread across different time units (e.g. semesters,
years, etc.), a direction that would assign decreasing
weights to older data (Ding and Li, 2005) would pro-
vide more accurate results.
Our approach in this paper introduces a time-
aware course recommendation system based on the
graduating attributes of students (and is not based on
the course content or students’ grades) and provides
interesting avenues for future work.
3 ALGORITHM DESCRIPTION
3.1 Data Generation
There can be various ways for gathering data regard-
ing the graduating attributes. One way is by self-
assessment of students in each semester. In this self-
assessment, students can report the courses they rec-
ognize impactfull in improving their GAs. These im-
pacts then can be used as ratings in the context of
recommender systems. In case of not having a self-
assessment for GAs and courses, we can recognize
the impact-full attributes of each course by the in-
structor’s assessment, and then use the performance
of student’s as a rating for all the attributes.
The tool for collecting data based on the scenario
of self-assessment has been implemented at the Uni-
versity of Alberta; however, data collection for the
purpose of training and testing of a recommender sys-
tem may need years to accomplish. In this paper we
have generated synthetic data based on the scenario
of using self-assessment and the implemented tool.
For the purpose of data generation, we first need to
recognize the list of attributes which will be assessed
(rated) and the values which can be assigned to each
of the attributes. In our tool we have 28 sub-attributes
which can be assessed by student by assigning a value
between 1 and 5 to each of them. We have used the
same numbers for our synthetic data. We have also
simulated the list of courses which will be available
for the students. Each of the courses would be de-
scribed by instructors in terms of GAs, meaning by
which degrees each attribute will be improved. Each
student will also be described by the list of values as-
signed to the GAs. In each semester each student will
participate in some of the existing courses and those
courses will improve the values of attributes. Based
on how impactfull the course have been in increasing
the value of each attribute the student will rate it. By
having these data our application will generate rec-
ommendation for courses in the next semesters.
To generate realistic data for the use of our appli-
cations, we need to consider how the real data would
look like. We have formulated the following list of
assumptions and we have considered them in our data
synthesis. The list of assumptions we have used is as
follows:
• Students may start with different values for at-
tributes as a baseline (they may not be similar),
so we can not start all from the lowest value for
all attributes. The random value assigned to each
attribute for each student is independent of other
values.
• Personality of students is a factor in the assess-
ment of competencies (some may report most of
the courses as major impact and some the oppo-
site). Students’ capacity of learning each attribute
is also different from other attributes. Students’
personality is independent and constant over time.
• The probability of values assigned to Graduat-
ing attributes for each course is not uniform. It
is more likely to have lower values compared to
higher values.
• In the updating of the values of competencies, all
the courses taken in the semester have impact. We
assume that the students spend equal time on each
course, so we sum the impact of all courses and
we divide it by the number of courses.
• The number of courses taken by a student in
each semester is not constant. We have assumed
that students will take randomly between 4 to 6
courses per semester.
For this study we have assumed having 100 stu-
dents, 100 courses and 28 attributes (competences).
Each of the attributes can have a value between 1 and
5. Each course needs a list of values to describe the
amount of focus on each of the attributes (C
k
j
). As
we are assuming that it is more likely to have lower
values compared to higher values in each course; each
value has been assigned randomly with more focus on
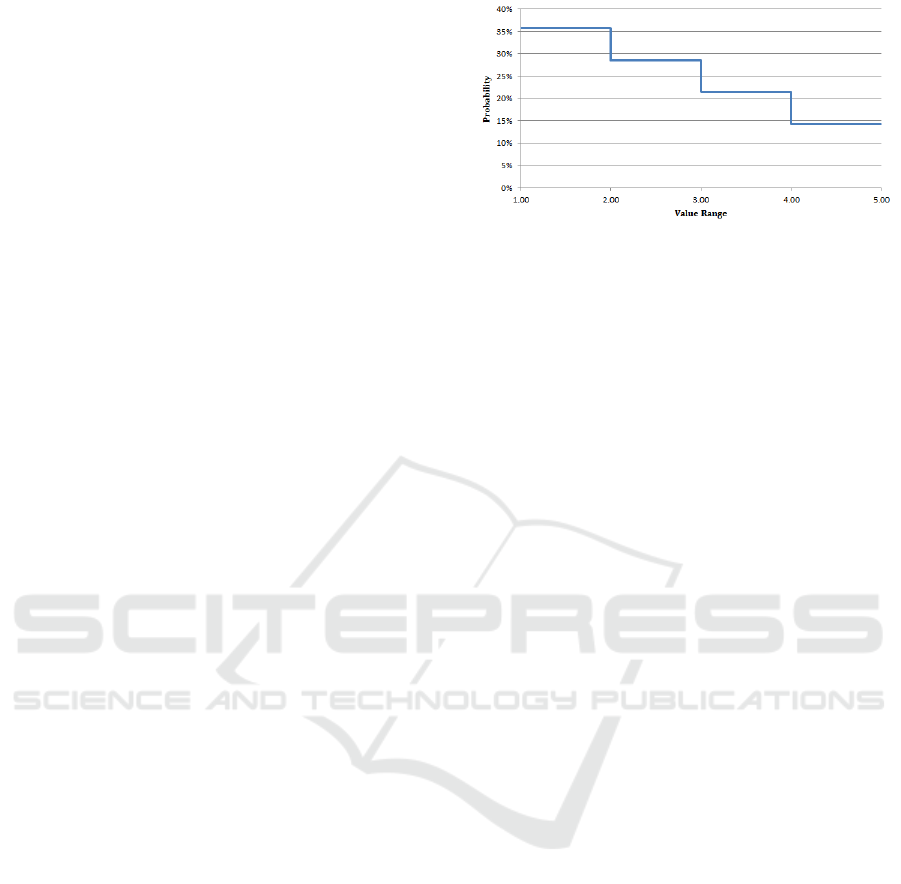
lower values based on Figure 1. As a result, probabil-
ity of a value being between 1 and 2 has about 7%
more chance than being between 2 and 3.
Figure 1: Probability of values assigned to each attribute of
each courses.
Also we have assigned a uniform random value
between 1 and 3 to each attribute of each student as
the baseline of student. This way we are considering
the different backgrounds of students assuming that
no student will start having the highest value which is
between 4 and 5. In order to simulate different per-
sonalities of students in our data, we have assigned
some other factors to each student which based on
those we would create the rest of the data. Each stu-
dent has a talent ratio for each of the attributes, mean-
ing that different students may have different learning
potential in regard to each of the attributes (T
i j
). Also
students may act differently in terms of rating their
courses. The rating in our synthesized data is rather
0, 1 or 2 (no impact, minor impact and major impact).
Some of the students may rate small changes as 1 but
some others may start giving the rating of 1 to big-
ger changes. As a result for each student we have as-
signed two limits between 0 and 1 to determine what
are the limits of their rating (0 < l
i1
< l
i2
< 1). If the
impact of each course on a competency is between 0
and 1, each user i will rate it 0 if it is less than l
i1
,
1 if it is between l
i1
and l
i2
and 2 if it is more than
l
i2
. Using these values which represent the rating per-
sonality of each student we create the rest of the data.
We should also mention that the values used for rep-
resenting the personality of students are independent
of each other.
In each semester, students take 4 to 6 courses ran-
domly from all the courses they have not taken before.
The new value assigned to each attribute for each stu-
dent at the end of each semester is calculated with
equation 1. As a result each of the courses has some
specific impact, and by comparing that impact with
the l
i1
and l
i2
we create the students’ ratings. Figure
2 shows the increase of the value assigned to an at-
tribute for different students over time. This can show
that students start with different values and the value
increases differently for each student over time. For
example student 56 has started the first semester with
one of the highest values (2.5) compared to other stu-
dents, but has improved the value with a low pace and
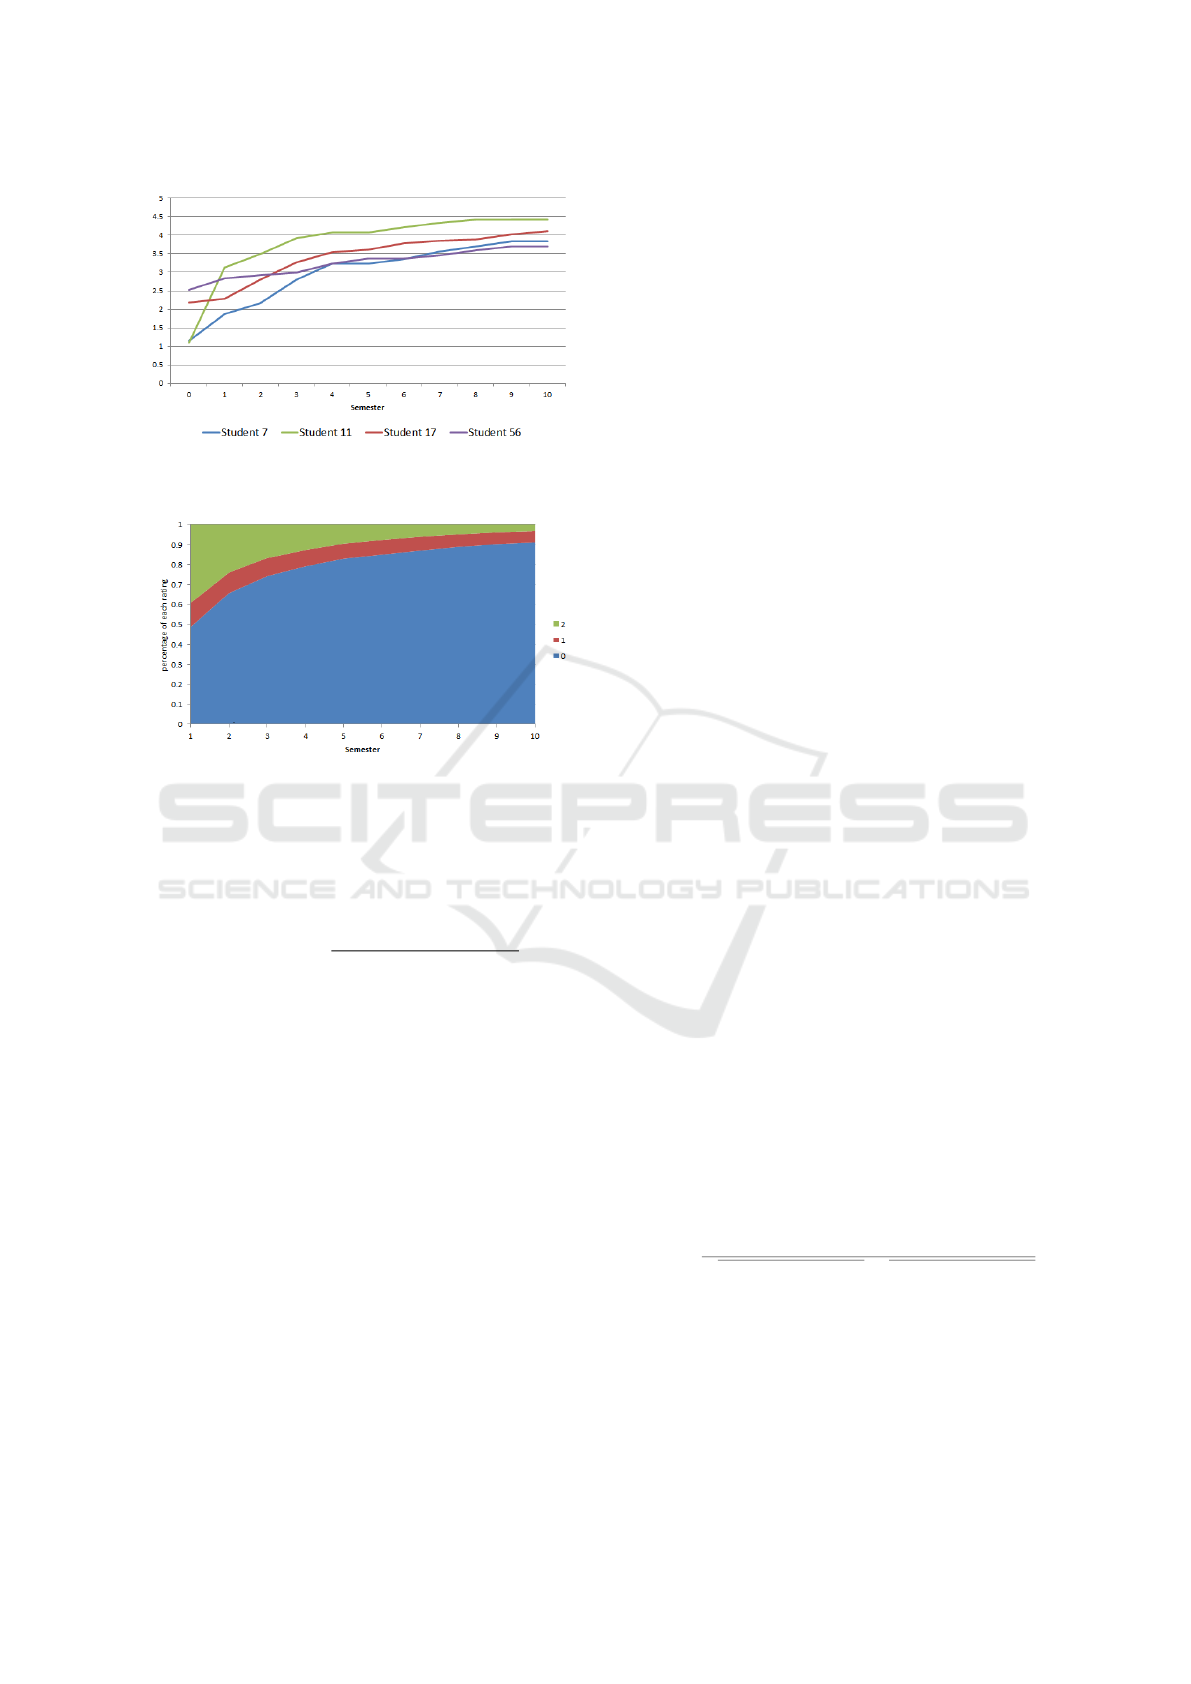
Figure 2: Values assigned to an example attribute over time
for some example students in the generated data.
Figure 3: Average ratio of ratings for all student over time.
has the value of 3.7 by the last semester. On the other
hand student 11 has started with value 1.2 but has the
value of 4.4 by the last semester.
B
i jt
= B
i jt−1
+
K
∑
k=1
max(0,C
k
j
− B
i jt−1
)T
i j
K
(1)
• B
i jt
represents the value assigned to attribute j for
student i in semester t
• C
k
j
represents the focus of course k on attribute j
• T
i j
represents the talent ratio of student i for at-
tribute j
• K represents the number of courses for student i
The increase over the values of attributes for each
student also results into lower rating in the latest
semester as there would be fewer courses to increase
those values. Figure 3 shows the ratio of different
rates in each semester. Over time the average number
of 0 ratings increases and at the same time the average
number of 2 ratings decreases.
3.2 Algorithm Design
We first describe the utility of a classic Collaborative
Filtering (CF) method. By this term we refer to the
algorithm that bases its predictions on neighbours of
relevant users. The idea of CF methods lies on the
fact that people who agreed in their evaluations for
past items are likely to agree again for future items
(Resnick et al., 1994).
As for the format we use, each student is rep-
resented by a long vector of the courses taken and
the assessments (ratings) in regard to the increase in
their achieved personal Graduating Attributes (GAs).
Similarly, each course is represented by a baseline
(ground truth) for the degree that student competences
are supposed to increase after the course is taken.
One variation in our method of formatting the prob-
lem with other applications of CF, is that each rat-
ing is given to one aspect (GA) of the course. This
can also be considered as “Multicriteria Ratings” in
which there exist multiple rating for each criteria of
the item (Adomavicius and Tuzhilin, 2005). In this
paper we are considering each criteria (GA) of the
course as an item. As a result, each item is a pair
of Graduating Attribute and a course. This way we
can not only recommend a course to a student consid-
ering most increase in all GAs, but also recommend
a course only targeted on a specific GA. In a hypo-
thetical example of C = 11 courses (cid = 0, 1,..., 10),
S = 5 students (sid = 0, 1, ..., 4) and G = 4 compe-
tences (gid = 0, 1, 3), the matrix representation of the
problem would look like Table 1.
From Table 1 we see that student 0 (sid =
0) has already taken (and rated) 6 courses (cid =
0, 1, 2, 3, 4, 5) but has not taken the rest of the courses,
so our task would be to recommend courses that this
student could take in order either to increase his/her
GAs in general (on average) or to increase a specific
GA. These recommendations should take into account
ratings of similar students to student 0 (collaborative
filtering approach).
The CF algorithm utilizes the C × (G × S) matrix
(say R), like the one in Table 1. The first step is to
declare a similarity measure between students in the
matrix R. The similarity metric based on previous
findings (Breese et al., 1998) is chosen to be Pearson
Correlation and is provided by the Equation 2 for any
two students a and b.
sim(a, b) =
∑
g∈G
a
∩G
b
R
a,g
−
˜
R
a
·
R
b,g
−
˜
R
b
q
∑
g∈G
a
∩G
b
R
a,g
−
˜
R
a
2
·
q
∑
g∈G
a
∩G
b
R
b,g
−
˜
R
b
2
(2)
where:
• g represents an item which in our case is a pair of
a Graduating Attribute and a course

Table 1: Example of data representation: courses x competences x students.
sid=0 sid=1 sid=2 sid=3 sid=4
cid g0 g1 g2 g3 g0 g1 g2 g3 g0 g1 g2 g3 g0 g1 g2 g3 g0 g1 g2 g3
0 0 0 0 1 1 0 1 0 0 0 0 2 2 0 2 2
1 0 1 0 0 0 0 2 0 0 0 2 2
2 0 0 1 0 0 0 0 2 0 2 2 1 0 1 0 0 0 2 0 2
3
0 0 0 2 0 0 0 2 0 0 0 1 2 0 2 0
4 0 2 0 0 0 2 0 0 0 2 2 0 1 0 0 0
5 1 0 0 0 0 2 0 0
6 ? ? ? ? 0 0 0 2 0 2 1 0 0 1 2 0
7 ? ? ? ? 0 2 0 0 0 0 0 2
8 ? ? ? ? 0 1 0 0 0 0 2 2 0 0 2 0
9 ? ? ? ? 0 1 0 0 0 2 0 1 0 2 2 1
10 ? ? ? ? 0 2 1 0 2 0 0 0 2 2 2 0 0 0 0 2
• G
a
represents the courses of student a (and simi-
larly for b),
• R
a,g
represents the rating of student a for item g
(and similarly for b)
• G
a
∩ G
b
represents the common courses of stu-
dents a and b,
•
˜
R
a
is the average rating of user a
The next step would be to find the neighbour-
hood of the active student which will define the set
of students that will be used in order to generate pre-
dictions. Results have shown (Sarwar et al., 2000)
that two techniques can effectively determine how
many students will be included in the active student
neighbourhood: Correlation thresholding and best n-
neighbours with common courses threshold (direct
application of the k-nearest neighbours algorithm). In
the first case, we simply select all neighbours whose
absolute correlation to the active student is higher
than the value of the given threshold and include them
in his/her neighbourhood. In the second case, we do
not simply pick the best n correlates, but we ask that
those students selected and the active student have
rated a common number of course competences (in
order to guarantee that a high correlation between two
students is based on a decent number of courses) . In
our experiments we applied Correlation Thresholding
for a series of different correlation thresholds and we
applied the second method (Nearest Neighbours) for
different values of neighbourhood size n.
Finally, predictions for ratings is based on a
weighted sum of ratings given to each item by similar
students to our target student. This formula is given
by Equation 3.
P
m,i
=
˜
R
m
+
∑
j∈N
K
u
(m)
sim(m, j) · (R
j,i
−
˜
R
j
)
∑
j∈N
K
u
(m)
|sim(m, j)|
(3)
where:
• m is the active student,
• u is the neighbourhood of students close to m,
• N
K
u
(m) is the K-most similar students to m
• sim(m, j) is provided by Equation 2,
• R
j,i
is the rating of student j on item i,
•
˜
R
m
is the mean rating of student m,
•
˜
R
j
is the mean rating of student j.
One specific characteristic of this problem (rec-
ommending courses based on ratings) is that the most
recent assessment has more value. For example as-
suming student S
1
is similar to student S
2
, the rat-
ing of student S
2
in the last semester is more valu-
able to make a recommendation based on, compared
to a rating in a few semesters ago. To consider this
behaviour in our algorithm we have given a higher
weight to the more resent semester using a Decay
function (Ding and Li, 2005; Vinagre, ). The formula
for this time aware collaborative filtering algorithm is
given in Equation 4.
P
m,i
=
˜
R
m
+
∑
j∈N
K
u
(m)
sim(m, j) · e
αt
R
j,i
· (R
j,i
−
˜
R
j
)
∑
j∈N
K
u
(m)
|sim(m, j) · e
αt
R
j,i
|
(4)
where:
• t
R
j,i
represents the semester in which rating R
j,i
is
given.
• α represents the decay parameter
• e is a constant (Euler’s number)
At each semester, by having the previews ratings
of students, we can predict the rating they would give
to each pair (C,GA) of course and Graduating At-
tribute; i.e. how would the student assess the impact

Figure 4: Mean squared error of rating predictor algorithms in each semester.
of a course on a Graduating Attribute. Then, we can
recommend the courses with the maximum expected
ratings. This recommendation can be targeted on a
specific Graduating Attribute or the average of ex-
pected ratings for all the GAs.
4 EXPERIMENTS
For the evaluation of the algorithm we use the syn-
thetic data as presented in the previous Section. At
each semester we can predict the ratings of students
on each of the possible pairs of courses and GA for
the next semester. Then we would look at the ex-
act value of the rating in the data and calculate the
mean squared error of the prediction. For the baseline
we use the CF algorithm provided in Equation 3 and
we compare it with the other alternative provided in
Equation 4 for three different values of α.
Figure 4 shows the mean square error (MSE) of
the prediction at each semester. This shows that in
our targeted application considering the time factor
can significantly improve the results.
In the results shown in Figure 4, the active user
neighbourhood used for making predictions is the set
of all students. By considering all the users in mak-
ing the prediction we may achieve better results; how-
ever this is not an efficient method in terms of per-
formance. As discussed in Section 3.2, there exist
two techniques which can be used for determining the
active user neighbourhood, Correlation thresholding
and K best neighbours. In K best neighbours, for each
targeted user, we rank all the other students based on
their similarity, and we use the K top ones instead of
all the users. In correlation thresholding, instead of
having a fixed number of students, we use all the stu-
dents which have a similarity to the target user higher
than a specific threshold.
Figure 5 and Figure 6 show the MSE of the time
aware CF algorithm using different similarity thresh-
olds along side the percentage of users used for mak-
ing the prediction. As we increase the threshold, the
error of the algorithm increases but at the same time
less users are used for making the prediction which
makes the algorithm faster. As a result we can choose
to use a threshold such as 0.7 to decrease the number
of users in the active user neighbourhood with a small
increase in the error.
We have performed the same experiment using K
best neighbours methods. In this case instead of filter-
ing the neighbourhood of the active user by a thresh-
old we will choose the K most similar users. Figure 7
shows the effect of K on the MSE for the evaluation
done in different semesters. The results show that the
effective number of users in the neighbourhood can be
between 10 to 15 students. This also matches with the
result of similarity thresholding, as the threshold of
0.7 in our experiments corresponds to 30% of users,
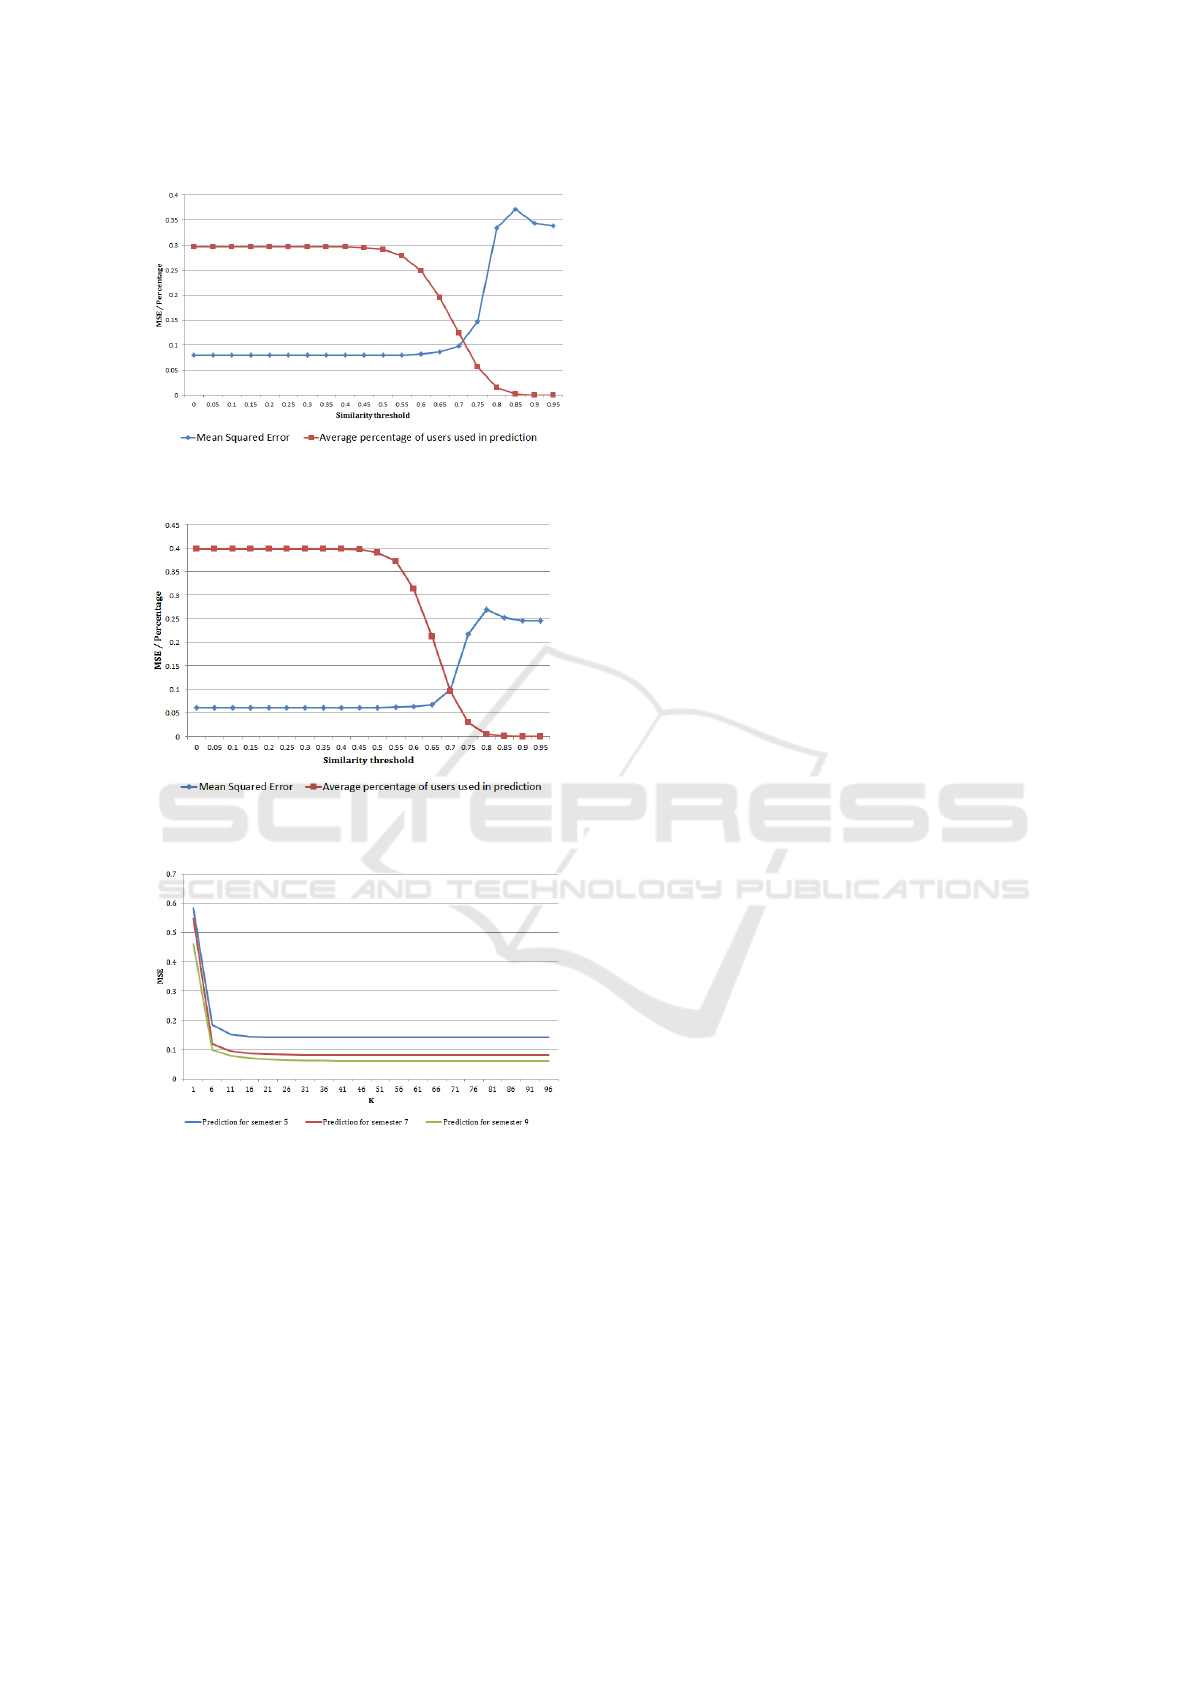
Figure 5: Results of correlation thresholding for prediction
at semester 7.
Figure 6: Results of correlation thresholding for prediction
at semester 9.
Figure 7: Results of K best neighbours method on predic-
tion.
which is about 10 to 15 users (the number of students
which have had common courses with target user is
30 to 50 depending on the semester). This shows that
in terms of limiting the active neighbourhood, these
two methods have similar results for our application.
5 CONCLUSION AND FUTURE
WORK
In this paper a course recommender system based
on graduating attributes of students was presented.
The proposed approach lies in the area of time-aware
multi-criteria course recommender systems for stu-
dents, which has not been attempted before in edu-
cational data mining. Experimental studies on a syn-
thetic dataset show that time dimension of student rat-
ings is important for more accurate recommendations
and that active neighborhood of students used can be
decreased significantly.
Work presented in this paper provides many av-
enues for further experimentation and improvement.
First, experimentation on real data will bring up new
challenges but also will further validate the proposed
algorithm. One of the challenges is the compatibility
with the program plans of the institution. For exam-
ple, a recommender system should consider the pre-
requisites of courses in each program. Considering
this issue, new options will be available for the logic
of the algorithm. As an example, the algorithm may
need to recommend a course which does not have a
high value just to meet the prerequisites of a valuable
course.
A second challenge lies with the scalability of the
algorithm. To have a reasonable response time for
making recommendations to a high number of stu-
dents might raise the need to include new techniques.
One direction to be examined would be the cluster-
ing of similar students so as to recommend courses
based on clusters of similar students instead of all the
dataset. Based on our results of correlation threshold-
ing, we see that it is possible to look at a smaller set
of students without sacrificing accuracy.
Finally, other collaborative filtering algorithms
(like matrix factorization) will be explored, as well
as explore how performance can be boosted. In the
context of recommender systems an issue that should
be handled is the cold start problem. One possible
option for improvement is the use of content based al-
gorithms in the fist few semesters and then over time
giving more weight to the CF algorithm.
REFERENCES
Adomavicius, G. and Tuzhilin, A. (2005). Toward the
next generation of recommender systems: A sur-
vey of the state-of-the-art and possible extensions.
IEEE transactions on knowledge and data engineer-
ing, 17(6):734–749.
Bowden, J., Hart, G., King, B., Trigwell, K., and Watts, O.
(2000). Generic capabilities of atn university gradu-

ates. canberra: Australian government department of
education, training and youth affairs. Retrieved Jan-
uary, 1:2011.
Breese, J. S., Heckerman, D., and Kadie, C. (1998). Empir-
ical analysis of predictive algorithms for collaborative
filtering. In Proceedings of the Fourteenth conference
on Uncertainty in artificial intelligence, pages 43–52.
Morgan Kaufmann Publishers Inc.
Chu, K., Chang, M., and Hsia, Y. (2003). Designing a
course recommendation system on web based on the
students course selection records. In World conference
on educational multimedia, hypermedia and telecom-
munications, volume 2003, pages 14–21. Citeseer.
Ding, Y. and Li, X. (2005). Time weight collaborative fil-
tering. In Proceedings of the 14th ACM international
conference on Information and knowledge manage-
ment, pages 485–492. ACM.
DiPerna, J. C. and Elliott, S. N. (1999). Development
and validation of the academic competence evalua-
tion scales. Journal of Psychoeducational Assessment,
17(3):207–225.
Goga, M., Kuyoro, S., and Goga, N. (2015). A recom-
mender for improving the student academic perfor-
mance. Procedia-Social and Behavioral Sciences,
180:1481–1488.
Ipperciel, D. and ElAtia, S. (2014). Assessing graduate at-
tributes: Building a criteria-based competency model.
International Journal of Higher Education, 3(3):p27.
Le Roux, F., Ranjeet, E., Ghai, V., Gao, Y., and Lu, J.
(2007). A course recommender system using multi-
ple criteria decision making method. In International
Conference on Intelligent Systems and Knowledge En-
gineering 2007. Atlantis Press.
Lee, Y. and Cho, J. (2011). An intelligent course recom-
mendation system. SmartCR, 1(1):69–84.
O’Mahony, M. P. and Smyth, B. (2007). A recommender
system for on-line course enrolment: an initial study.
In Proceedings of the 2007 ACM conference on Rec-
ommender systems, pages 133–136. ACM.
Provost office, U. o. A. (2011). Gradu-
ate attributes at the university of alberta.
http://www.provost.ualberta.ca/en/
˜
/media/provost/Do
cuments/Information/GraduateAttributes.pdf.
Resnick, P., Iacovou, N., Suchak, M., Bergstrom, P., and
Riedl, J. (1994). Grouplens: an open architecture for
collaborative filtering of netnews. In Proceedings of
the 1994 ACM conference on Computer supported co-
operative work, pages 175–186. ACM.
Romero, C. and Ventura, S. (2010). Educational data min-
ing: a review of the state of the art. IEEE Transactions
on Systems, Man, and Cybernetics, Part C (Applica-
tions and Reviews), 40(6):601–618.
Sarwar, B., Karypis, G., Konstan, J., and Riedl, J.
(2000). Analysis of recommendation algorithms for
e-commerce. In Proceedings of the 2nd ACM confer-
ence on Electronic commerce, pages 158–167. ACM.
Surpatean, A., Smirnov, E. N., and Manie, N. (2012). Mas-
ter orientation tool. In ECAI, pages 995–996.
Vinagre, J. Time-aware collaborative fitering: a review. In
DOCTORAL SYMPOSIUM IN INFORMATICS EN-
GINEERING, page 43.
