
A Tool for Visualizing the Execution of Programs and Stack Traces
Especially Suited for Novice Programmers
Stanislav Litvinov, Marat Mingazov, Vladislav Myachikov, Vladimir Ivanov, Yuliya Palamarchuk,
Pavel Sozonov and Giancarlo Succi
Innopolis University, Innopolis, Russia
Keywords:
Visualizing Execution, Debugging, Teaching Programming.
Abstract:
Software engineering education and training has obstacles caused by a lack of basic knowledge about a process
of program execution. The article is devoted to the development of special tools that help to visualize the
process. We analyze existing tools and propose a new approach to stack and heap visualization. The solution
is able to overcome major drawbacks of existing tools and suites well for analysis of programs written in Java
and C/C++.
1 INTRODUCTION
Software engineering education and training has
many obstacles. Failures of students are quite fre-
quent even at introductory level programming cour-
ses; failure rate is approximately 33% (Bennedsen
and Caspersen, 2007; Pedrycz and Succi, 2005; Wat-
son and Li, 2014). Apparently, students and no-
vice programmers struggle with very basic concepts
of programming, such as behavior of a program in
run-time. Early failures in studying may dramatically
decrease one’s motivation to become a programmer
(Coman et al., 2008; Oroma et al., 2012; Succi et al.,
2001; Dragoni et al., 2017). Hence, this is a serious
issue for education institutions, if students do not have
a clear idea of how a program is executed.
One possible way to resolve the issue involves
special tools for visualization the process of program
execution. This requires a clear and easy to use vi-
sualization of stack and heap memory. Despite many
available solutions, very few existing tools are wide-
spread (Sorva et al., 2013).
In this paper we propose a new approach to visu-
alization of stack and heap memory of a running pro-
gram. The approach is aimed at building a clear un-
derstanding of program’s memory organization. The
visualization reflects a model of memory which suits
to describe programs written on Java and C/C++.
Section 2 describes the state of the art. Section 3
presents major parts of the solution: architecture, user
interface, and visualization model. Section 4 summa-
rizes results and outlines the future work.
2 BACKGROUND
2.1 Modeling Memory to Support the
Learning Process
Each program in Java and C/C++ usually contains
three separate segments: a program area, a stack, and
a heap. The program area is where the code is loca-
ted and it is used to access the instructions to execute.
The stack is used by processes or threads as a storage
of arguments and local variables. This memory can-
not be used if the data size is unknown (Doe, 2016;
Yurichev, 2013; cs.umd.edu, 2003). The heap is more
flexible, because size of data which will be stored in
the heap can be determined at any moment, including
run-time. However, usage of heap imposes signifi-
cant overhead, since it needs additional processor in-
structions and memory space for storing memory al-
location metadata (Doe, 2016; Yurichev, 2013).
Usually, novice programmers and students misun-
derstand memory organization of a running program
(Safina et al., 2016). Typical learning challenges that
novice programmers are facing with have been sum-
marized in (Sorva et al., 2013): (i) treating a program
as a run-time process, not only a piece of code; (ii)
understanding of a computer working process; (iii) re-
vealing implicit programming constructs (e.g., poin-
ters, references); (iv) misunderstanding of program
execution sequence and tracing.
Notably, that a standard debugger cannot help no-
vice programmers due to its limited usability, not it
Litvinov, S., Mingazov, M., Myachikov, V., Ivanov, V., Palamarchuk, Y., Sozonov, P. and Succi, G.
A Tool for Visualizing the Execution of Programs and Stack Traces Especially Suited for Novice Programmers.
DOI: 10.5220/0006336902350240
In Proceedings of the 12th International Conference on Evaluation of Novel Approaches to Software Engineering (ENASE 2017), pages 235-240
ISBN: 978-989-758-250-9
Copyright © 2017 by SCITEPRESS – Science and Technology Publications, Lda. All rights reserved
235
contains useful metrics for defect detection (Moser
et al., 2008). A debugger requires a knowledge of
memory organization of a program that a novice ty-
pically does not have yet. Moreover, most debuggers
do not provide any explanations or hints (Sorva et al.,
2013).
2.2 Overview of Visualization Tools
Most currently used programming languages for no-
vice programmers are C/C++ and Java and existing
visualization tools for them either emphasize their im-
perative features, or (for C++ and Java) the object
oriented features ((Scotto et al., 2004; Jermakovics
et al., 2011; Bennedsen and Schulte, 2010; Corral
et al., 2011; Pedrycz et al., 2015)). Considering Java
and C/C++ is also particularly relevant, since these
languages are in the top 5 most popular languages
(Bissyand
´
e et al., 2013). Needless to say that this im-
plies that this study focuses on compiled languages
rather than on scripting languages.
In Table 1 we summarize some of the most pro-
minent tools for visualizing execution of programs.
Most of the tools in Table 1 are research prototypes.
Very few of them are still in active use. A limited
number of tools have been used outside the place of
its origin. However, in order to be effective in edu-
cational process a visualization tool should have high
level of engagement (Juett, 2016; Moreno et al., 2004;
Maurer et al., 1999). To overcome learning challen-
ges a visualization of stack and heap memory should
be easy to use.
In general, these tools have the following advanta-
ges: (a) most of the applications have timeline or/and
forward/reverse stepping, (b) one system has a flex-
ible search mechanism which is able to work with
many parameters (e.g., variable name, returned value,
etc.) (Lessa et al., 2010), (c) some of the tools show
multithreading and deadlocks, and (d) textual expla-
nation is very useful (Smith and Webb, 1995).
On the other side, we can identify the following,
quite generalized, drawbacks: (a) only a few tools
show separate heap and stack, (b) not all of applicati-
ons are convenient for beginners, (c) only two soluti-
ons work in Eclipse IDE, and (d) not all tools allow to
use your own code.
3 A NOVEL APPROACH TO
STACK AND HEAP
VISUALIZATION
We have devised a new approach for visualizing pro-
gram execution process. The main element of the vi-
sualization is the stack trace, which makes memory
organization of C/C++ and Java programs explicit
1
.
We have implemented prototype to experiment
our approach in three different environments: (1)
Eclipse IDE for C++, (2) Eclipse IDE for Java, and
(3) IntelliJ IDEA for Java.
3.1 System Architecture of the
Prototypes
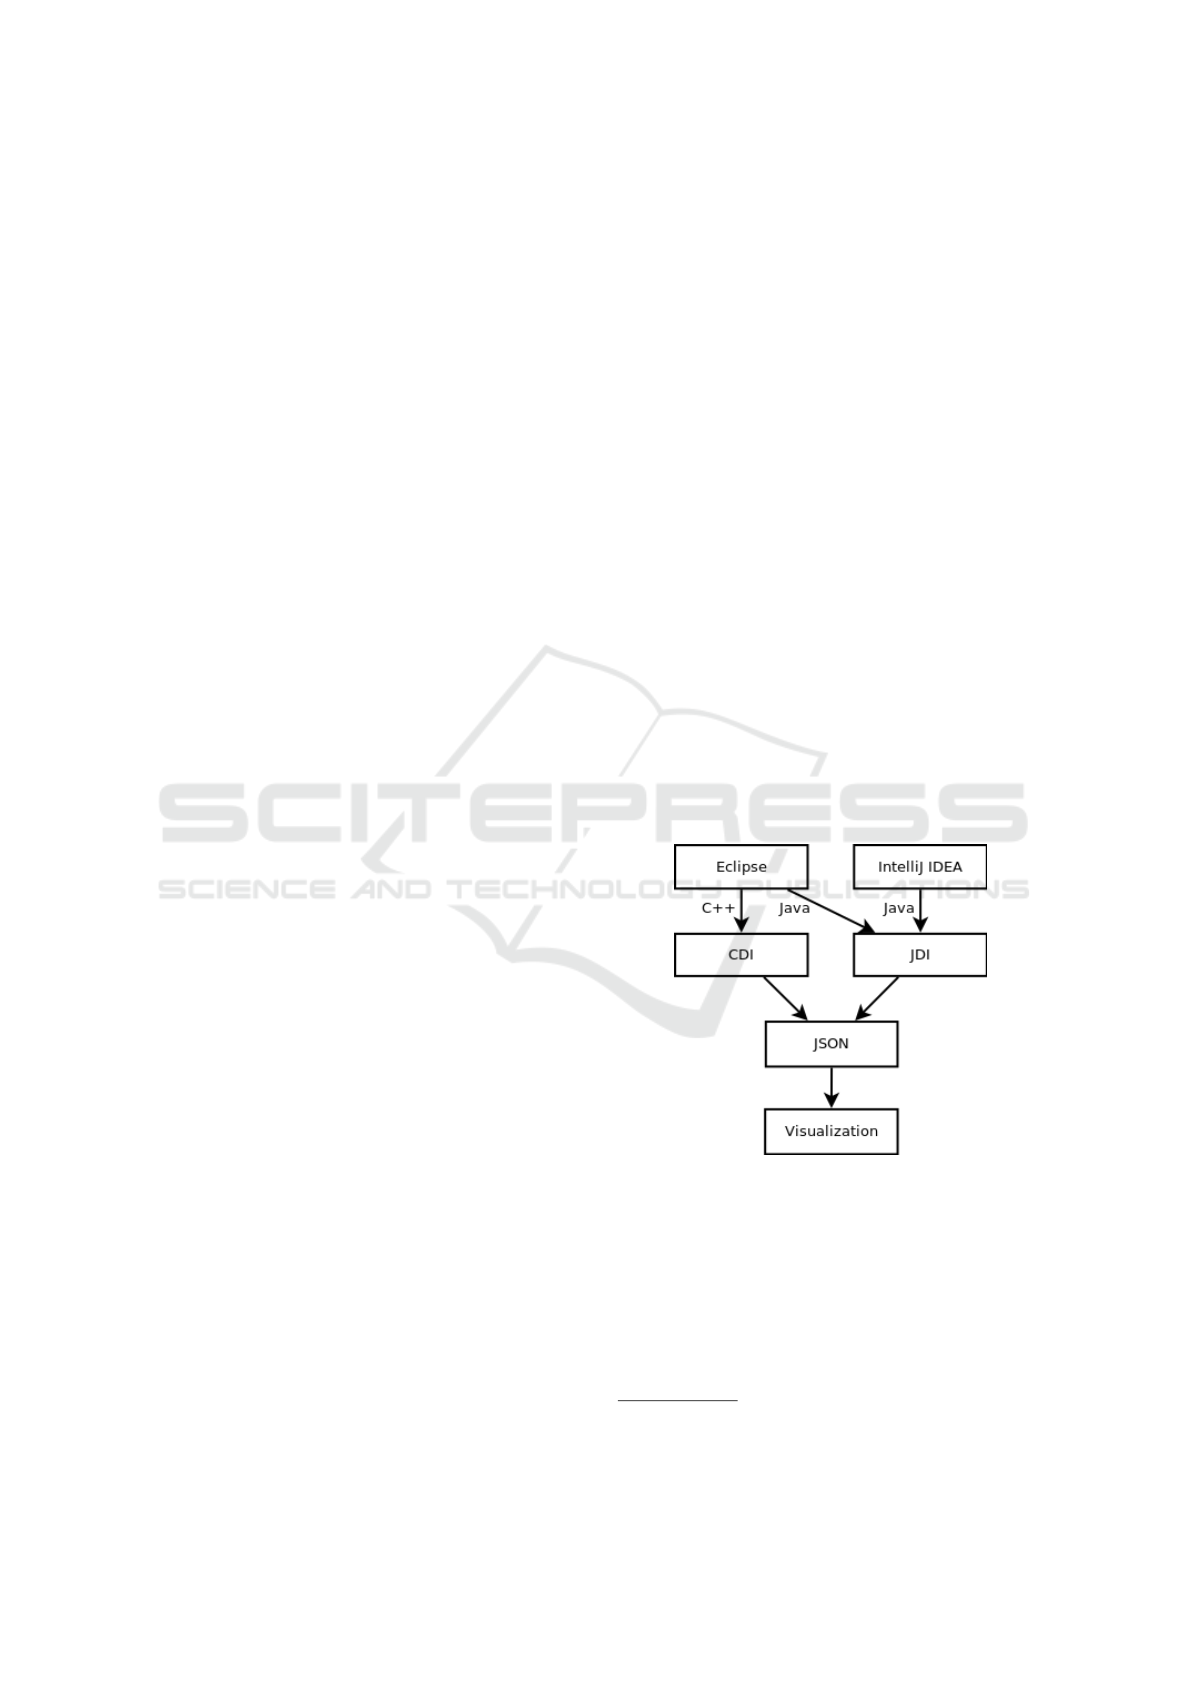
Figure 1 summarizes the general architecture of our
prototypes. In the Java-based prototypes Eclipse and
IntelliJ IDEA interact with Java Debugging Interface,
and in the C/C++ prototypes Eclipse interacts with
C/C++ Debugging Interface.
Java Debugging Interface (JDI) is a high-level
Java-based interface, which is directly used in debug-
ger applications. JDI provides access to Java threads,
virtual machines state, Class, Array, Interface, and
primitive types (Oracle, 2016).
Figure 1: Application architecture.
C/C++ Debugging Interface (CDI) is a useful
Java-based interface to custom debuggers in Eclipse
environment. CDI can work with full-featured debug-
ger provided by a development environment tooling
(e.g., C/C++ Development Tooling (CDT)), or exter-
nal debuggers (e.g., GDB). Eclipse plugins can inte-
ract with a debugger, and use all features of CDT envi-
ronment, such as code-stepping, watchpoints, break-
1
The source code of the prototype is available at
https://github.com/MaratMingazov/CMemvit
ENASE 2017 - 12th International Conference on Evaluation of Novel Approaches to Software Engineering
236
Table 1: A survey of tools for visualization of a program execution.
Title Description
DYVISE (Reiss, 2009) a standalone application for analysis of memory leaks, inefficient use of
memory, unexpected changes in memory, etc.
JIVE (Lessa et al., 2010) a plugin for Eclipse IDE; shows call history, method calls and object context;
supports searching and stepping.
Trace (Alsallakh et al.,
2012)
a plugin for Eclipse IDE; a timeline represented as line chart with breakpoints
on the line.
EXTRAVIS (Cornelissen
et al., 2008)
a prototype presents a program as an element in the circle with lines that
represent relationships between classes and packages; and uses sequence
diagram to overview events.
Memview (Gries et al.,
2005)
an extension to the DrJava IDE; depicts call stack, static objects in heap, normal
objects in heap in distinct boxes.
CoffeeDregs (Huizing
et al., 2012)
supports multithreading, but it is mostly a teaching tool for object-oriented
study.
JaVis (Mehner, 2002) a UML-based application; uses sequence diagram for time line and
collaboration diagram for deadlock detection.
JAVAVIS (Oechsle and
Schmitt, 2002)
it supports multithreading; shows stack call; uses a sequence diagram for a
time-line and parallel threads.
EVizor (Moons and
De Backer, 2013)
is a plugin for Netbeans IDE. Advantage of this application is textual tips for
the user with explanations.
JavaTool (Mota et al.,
2008)
is a plugin for Moodle. It can be useful for small programs. Debugging occurs
in the browser.
Labster (Juett, 2016) a web-based system for visualization of memory representation and expressions
evaluation.
Project S (Deitz and Buy,
2016)
a tool has graphical interface based on “Space Invaders”. The aliens are
variables. Each variable has a text label.
Web-based tutor (Kumar,
2009)
a tool depicts memory representation of C++ code: global variables, stack and
heap. In addition, this tool has a detailed explanation related to a current line.
VIP (Virtanen et al., ) a tool explains how pointers work in C++ and demonstrates the process of
expression evaluation.
Bradman (Smith and
Webb, 1995)
an extended debugger which explains execution of each statement.
Teaching Machine
(Bruce-Lockhart and
Norvell, 2000)
a tool shows a stack, a heap and static memory. Special table includes a list of
all variables: type, name and value.
jGRASP (Cross et al.,
2004)
an IDE. It can show visualization of data structures, objects, instance variables.
points, register contents, memory contents, variable
views, signals, etc. Debugging results are shown in
CDT Debugging perspective simultaneously (Scar-
pino, 2008a; Scarpino, 2008b).
At each execution step, when an event of changing
process/thread state occurs, IDE plugin collects all the
data about the actual process/thread state from CDI or
JDI and generate a corresponding JSON object. The
JSON object comprises several blocks: (1) language,
specifying the programming language (Java / C++),
(2) threads, only in Java, where there is at least one
thread (main thread), and each thread contains its sta-
tus and stack, (3) stack, it is an independent block
for C/C++, in case of Java it is inner block of ”thre-
ads;” this element of JSON object contains informa-
tion about stack frames and their content (function
name, arguments, local variables, etc.), (4) heap, in-
cluding information about heap content, (5) global-
StaticVariables, self defined, (6) lineNumber, self
defined.
The description of each variable includes several
fields: name, type, value, address (for C++), identifier
(for Java objects), etc. The JSON object is saved as a
distinct file with unique name and timestamp.
JSON files are sent to the visualization subsystem,
which extracts data and builds a graphical representa-
tion connected with sequential execution steps. User
can see current program state or state after any of pre-
vious steps. Work (Juett, 2016) emphasizes the im-
portance of possibility to use full-featured navigation
in visualization system, i.e. not only to use standard
stepping buttons (e.g., ”step into”, ”step over”, ”step
A Tool for Visualizing the Execution of Programs and Stack Traces Especially Suited for Novice Programmers
237

return”), but also to be able to return to previous states
at any moment.
The proposed architecture makes the development
process scalable. Uniform representation of an in-
termediate JSON file precisely defines data to be
extracted from debugger. A shared format optimi-
zes development of the visualization subsystem. In-
deed, instead of developing three different visualiza-
tion modules we need to develop only one. In the
future plugins for another IDE (or even other langua-
ges) can be easily developed and integrated in our ar-
chitecture.
3.2 User Interface
Technically, our application is an extension of an IDE
(Java or Eclipse), which interacts to a built-in debug-
ger. In a basic scenario user puts a breakpoint somew-
here in the source code and then steps forward and
backward, observing execution states. User interface
of the tool is presented in Figure 2.
The user interface consists of: (a) IDE standard
window; (b) source code editor, which also highlights
current execution line, and its breakpoints managing
functional; (c) standard debug control buttons (e.g.,
”step into”, ”step over”, ”step return”) of IDE; (d)
view tab with all visualization tables along with ad-
ditional buttons for back-stepping, and visualization
preferences. The visualization model of the applica-
tion is illustrated with an example. To this end we use
the following simple Java program.
Figure 3 shows a heap and a stack state in the
breakpoint. Inside the stack one can see arguments
and local variables. Description of variables inclu-
des the following fields: type, name and value. For
simplicity, names of standard classes are shown wit-
hout prefix java.lang (e.g., we show String instead
of java.lang.String). In addition, we show only
user’s objects in the heap (only those objects, which
have reference to them in the stack). Otherwise, the
heap visualization might be littered with numerous
system objects. C++ visualization has a very similar
structure, but it also contains global/static variables
block, memory addresses of local variables, and me-
mory addresses of heap objects instead of identifiers.
Listing 1: Example of a Java program visualized in Fig. 3
p u b l i c c l a s s Sample {
p u b l i c s t a t i c v o i d
main ( S t r i n g [ ] a r g s ) {
Demo o b j = new Demo ( ) ;
o b j . i = 7 0 ;
o b j . c = ’Z ’ ;
i n t a = 5 ;
i n t b = o b j . i ;
S t r i n g s = ” H e l l o ” ;
} / /<−− c u r r e n t e x e c u t i o n p o i n t
}
c l a s s Demo {
i n t i ;
char c ;
}
During the execution process each new stack
frame appears on the top of the stack, and old frames
move down. When a function finishes its execution,
the stack frame of the function is removed from the
stack. New heap objects or static variables appear on
the top of the heap and static/global memory areas.
Thus, even if user will work with a large program,
visual representation will grow only vertically. This
means that our approach allows users to effectively
observe all the information about the program state
using scrolling, and to have recent data always on the
top. In addition, a user can customize the application.
There is a possibility to automatically minimize all
stack frames excluding the upper one and manually
minimize or maximize any block (i.e., heap, global/-
static memory, stack or distinct stack frames). A va-
riable or an object which was changed/created during
the last step is highlighted. The field ”name” is added
into a table which represents the heap. This facilitates
understanding the relationship between pointers/refe-
rences in the stack and objects in the heap.
4 CONCLUSION AND FUTURE
WORK
This article presents a new solution for visualization
of program execution. Right now we have available
only prototypes, but soon we are going to develop a
working version and to test it.
The prototypes are plugins that allow us to mo-
nitor memory content of programs during execution
step by step and that will be released with an Open
Source license (Kov
´
acs et al., 2004). It would be fruit-
ful to pursue further research about including a time-
line and textual explanations. If a timeline is shown
as a sequence diagram, then we will be able to depict
multithreading in our application. We have conside-
red several advantages and disadvantages of existing
visualization systems. Thus, we are going to gather
some major advantages in one solution and eliminate
flaws. So that novice programmers will obtain a po-
werful tool for understanding how programs execute
and how memory is typically organized.
ENASE 2017 - 12th International Conference on Evaluation of Novel Approaches to Software Engineering
238
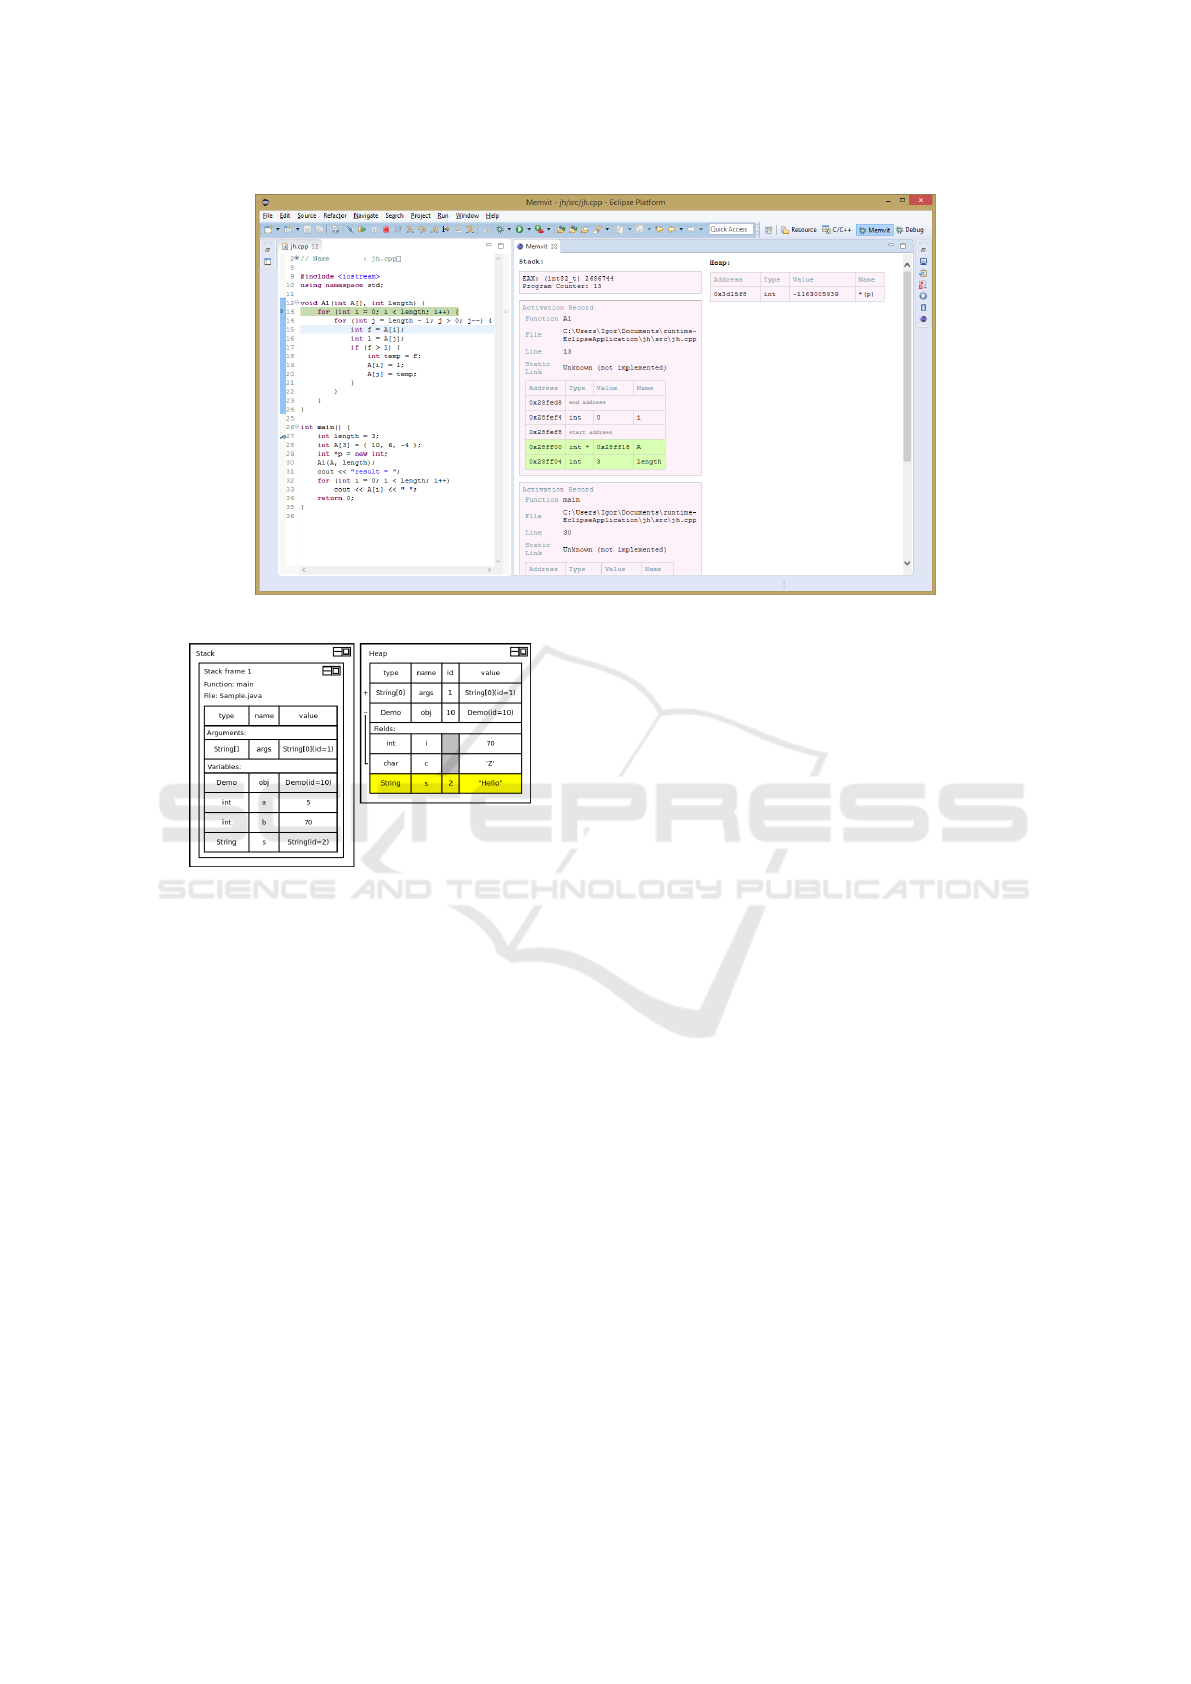
Figure 2: User Interface of the tool.
Figure 3: Heap and a stack states of a program (Listing 1).
ACKNOWLEDGEMENTS
We thank Innopolis University for supporting this re-
search.
REFERENCES
Alsallakh, B., Bodesinsky, P., Gruber, A., and Miksch, S.
(2012). Visual tracing for the eclipse java debugger.
In Software Maintenance and Reengineering (CSMR),
2012 16th European Conference on, pages 545–548.
IEEE.
Bennedsen, J. and Caspersen, M. E. (2007). Failure rates
in introductory programming. ACM SIGCSE Bulletin,
39(2):32–36.
Bennedsen, J. and Schulte, C. (2010). Bluej visual debug-
ger for learning the execution of object-oriented pro-
grams? ACM Transactions on Computing Education
(TOCE), 10(2):8.
Bissyand
´
e, T. F., Thung, F., Lo, D., Jiang, L., and
R
´
eveillere, L. (2013). Popularity, interoperability, and
impact of programming languages in 100,000 open
source projects. In Computer Software and Applica-
tions Conference (COMPSAC), 2013 IEEE 37th An-
nual, pages 303–312. IEEE.
Bruce-Lockhart, M. P. and Norvell, T. S. (2000). Lifting
the hood of the computer: Program animation with
the teaching machine. In Electrical and Computer En-
gineering, 2000 Canadian Conference on, volume 2,
pages 831–835. IEEE.
Coman, I. D., Sillitti, A., and Succi, G. (2008). Investigating
the usefulness of pair-programming in a mature agile
team. In Agile Processes in Software Engineering and
Extreme Programming: 9th International Conference,
XP 2008, Limerick, Ireland. Proceedings, pages 127–
136, Berlin, Heidelberg. Springer Berlin Heidelberg.
Cornelissen, B., Zaidman, A., Holten, D., Moonen, L., van
Deursen, A., and van Wijk, J. J. (2008). Execution
trace analysis through massive sequence and circu-
lar bundle views. Journal of Systems and Software,
81(12):2252–2268.
Corral, L., Sillitti, A., Succi, G., Garibbo, A., and Ramella,
P. (2011). Evolution of Mobile Software Development
from Platform-Specific to Web-Based Multiplatform
Paradigm. In Proceedings of the 10th SIGPLAN Sym-
posium on New Ideas, New Paradigms, and Reflecti-
ons on Programming and Software, Onward! 2011,
pages 181–183, New York, NY, USA. ACM.
Cross, J. H., Hendrix, D., and Umphress, D. A. (2004).
jgrasp: an integrated development environment with
visualizations for teaching java in cs1, cs2, and
beyond. In Frontiers in Education, 2004. FIE 2004.
34th Annual, pages 1466–1467. IEEE.
cs.umd.edu (2003). Understanding the stack.
http://www.cs.umd.edu/class/sum2003/cmsc311/
Notes/Mips/stack.html.
Deitz, S. and Buy, U. (2016). From video games to de-
bugging code. In Proceedings of the 5th International
Workshop on Games and Software Engineering, pages
37–41. ACM.
Doe, P. (2016). Java heap space vs stack – memory allo-
A Tool for Visualizing the Execution of Programs and Stack Traces Especially Suited for Novice Programmers
239

cation in java. http://www.journaldev.com/4098/java-
heap-space-vs-stack-memory.
Dragoni, N., Mazzara, M., Giallorenzo, S., Montesi, F., La-
fuente, A. L., Mustafin, R., and Safina, L. (2017). Mi-
croservices: yesterday, today, and tomorrow. In Pre-
sent and Ulterior Software Engineering. Springer Ber-
lin Heidelberg.
Gries, P., Mnih, V., Taylor, J., Wilson, G., and Zamparo, L.
(2005). Memview: A pedagogically-motivated visual
debugger. In Proceedings Frontiers in Education 35th
Annual Conference, pages S1J–11. IEEE.
Huizing, C., Kuiper, R., Luijten, C., and Vandalon, V.
(2012). Visualization of object-oriented (java) pro-
grams. In CSEDU (1), pages 65–72.
Jermakovics, A., Sillitti, A., and Succi, G. (2011). Mi-
ning and Visualizing Developer Networks from Ver-
sion Control Systems. In Proceedings of the 4th In-
ternational Workshop on Cooperative and Human As-
pects of Software Engineering, CHASE ’11, pages
24–31. ACM.
Juett, J. A. (2016). Using Program Visualization to Illumi-
nate the Notional Machine. PhD thesis, University of
Michigan.
Kov
´
acs, G. L., Drozdik, S., Zuliani, P., and Succi, G.
(2004). Open Source Software for the Public Ad-
ministration. In Proceedings of the 6th Internatio-
nal Workshop on Computer Science and Information
Technologies.
Kumar, A. N. (2009). Data space animation for learning
the semantics of c++ pointers. ACM SIGCSE Bulletin,
41(1):499–503.
Lessa, D., Czyz, J. K., and Jayaraman, B. (2010). Jive: A
pedagogic tool for visualizing the execution of java
programs. University at Buffalo, Tech. Rep.
Maurer, F., Succi, G., Holz, H., K
¨
otting, B., Goldmann, S.,
and Dellen, B. (1999). Software Process Support over
the Internet. In Proceedings of the 21st International
Conference on Software Engineering, ICSE ’99, pages
642–645. ACM.
Mehner, K. (2002). Javis: A uml-based visualization and
debugging environment for concurrent java programs.
In Software Visualization, pages 163–175. Springer.
Moons, J. and De Backer, C. (2013). The design and pi-
lot evaluation of an interactive learning environment
for introductory programming influenced by cognitive
load theory and constructivism. Computers & Educa-
tion, 60(1):368–384.
Moreno, A., Myller, N., Sutinen, E., and Ben-Ari, M.
(2004). Visualizing programs with jeliot 3. In Procee-
dings of the working conference on Advanced visual
interfaces, pages 373–376. ACM.
Moser, R., Pedrycz, W., and Succi, G. (2008). A compara-
tive analysis of the efficiency of change metrics and
static code attributes for defect prediction. In Pro-
ceedings of the 30th International Conference on Soft-
ware Engineering, ICSE 2008, pages 181–190. ACM.
Mota, M. P., Pereira, L. W. K., and Favero, E. L.
(2008). Javatool: Uma ferramenta para o ensino de
programac¸
˜
ao. In Congresso da Sociedade Brasileira
de Computac¸
˜
ao. Bel
´
em. XXVIII Congresso da Socie-
dade Brasileira de Computac¸
˜
ao, pages 127–136.
Oechsle, R. and Schmitt, T. (2002). Javavis: Automatic pro-
gram visualization with object and sequence diagrams
using the java debug interface (jdi). In Software visu-
alization, pages 176–190. Springer.
Oracle (2016). Java platform debugger architecture (jpda).
http://docs.oracle.com/javase/7/docs/technotes/
guides/jpda/.
Oroma, J. O., Wanga, H., and Ngumbuke, F. (2012). Chal-
lenges of teaching and learning computer program-
ming in developing countries: Lessons from tumaini
university.
Pedrycz, W. and Succi, G. (2005). Genetic granular classi-
fiers in modeling software quality. Journal of Systems
and Software, 76(3):277–285.
Pedrycz, W., Succi, G., Sillitti, A., and Iljazi, J. (2015). Data
description: A general framework of information gra-
nules. Knowl.-Based Syst., 80:98–108.
Reiss, S. P. (2009). Visualizing the java heap demonstra-
tion proposal. In Software Maintenance, 2009. ICSM
2009. IEEE International Conference on, pages 389–
390. IEEE.
Safina, L., Mazzara, M., Montesi, F., and Rivera, V. (2016).
Data-driven workflows for microservices: Genericity
in jolie. In 2016 IEEE 30th International Conference
on Advanced Information Networking and Applicati-
ons (AINA), pages 430–437.
Scarpino, M. (2008a). Interfacing with the cdt debug-
ger, part 1: Understand the c/c++ debugger inter-
face. http://www.ibm.com/developerworks/library/os-
eclipse-cdt-debug1/.
Scarpino, M. (2008b). Interfacing with the cdt debug-
ger, part 2: Accessing gdb with the eclipse cdt and
mi. http://www.ibm.com/developerworks/library/os-
eclipse-cdt-debug2/.
Scotto, M., Sillitti, A., Succi, G., and Vernazza, T. (2004). A
Relational Approach to Software Metrics. In Procee-
dings of the 2004 ACM Symposium on Applied Com-
puting, SAC ’04, pages 1536–1540. ACM.
Smith, P. A. and Webb, G. I. (1995). Reinforcing a gene-
ric computer model for novice programmers. ASCI-
LITE’95.
Sorva, J., Karavirta, V., and Malmi, L. (2013). A review
of generic program visualization systems for introduc-
tory programming education. ACM Transactions on
Computing Education (TOCE), 13(4):15.
Succi, G., Paulson, J., and Eberlein, A. (2001). Preliminary
results from an empirical study on the growth of open
source and commercial software products. In EDSER-
3 Workshop, pages 14–15.
Virtanen, A. T., Lahtinen, E., and J
¨
arvinen, H.-M. Vip, a
visual interpreter for learning introductory program-
ming with c++.
Watson, C. and Li, F. W. (2014). Failure rates in intro-
ductory programming revisited. In Proceedings of the
2014 conference on Innovation & technology in com-
puter science education, pages 39–44. ACM.
Yurichev, D. (2013). C/c++ programming language notes.
http://yurichev.com/writings/C-notes-en.pdf.
ENASE 2017 - 12th International Conference on Evaluation of Novel Approaches to Software Engineering
240
