Adaptive Transmission Scheme for Vehicle Communication System
Sangmi Moon, Sara Bae, Myeonghun Chu, Jihye Lee, Soonho Kwon and Intae Hwang
Dept. of Electronics and Computer Engineering, Chonnam National University,
300 Yongbongdong Bukgu Gwangju, 500-757, Republic of Korea
Keywords: Adaptive Transmission, Freeway, LTE-based V2X, PRR, SLS.
Abstract: Advances in Vehicle-to-Everything (V2X) communication attempt to enhance traffic safety by employing
advanced wireless communication systems. V2X communication is a core solution to manage and advance
future traffic safety and mobility. In this study, we design a system-level simulator (SLS) for Long Term
Evolution (LTE)-based V2X and propose an adaptive transmission scheme for vehicle communication. The
proposed scheme allocates the resource randomly in the time and frequency domains and transmits the
message according to the probability of transmission. The performance analysis is based on the freeway
scenario and periodic message transmission. Simulation results show that the proposed scheme can improve
the cumulative distribution function (CDF) of the packet reception ratio (PRR) and the average PRR.
1 INTRODUCTION
Communication technology has been utilized for
communication and provision of information
between people. However, in recent years, the
application of this technology has been expanded for
device-to-people and device-to-device communication.
In particular, vehicular communication (V2X:
vehicle-to-everything) has many applications,
including navigation and driver assistance, travel
information, congestion avoidance, fleet
management, payment transactions, and traffic
control and safety.
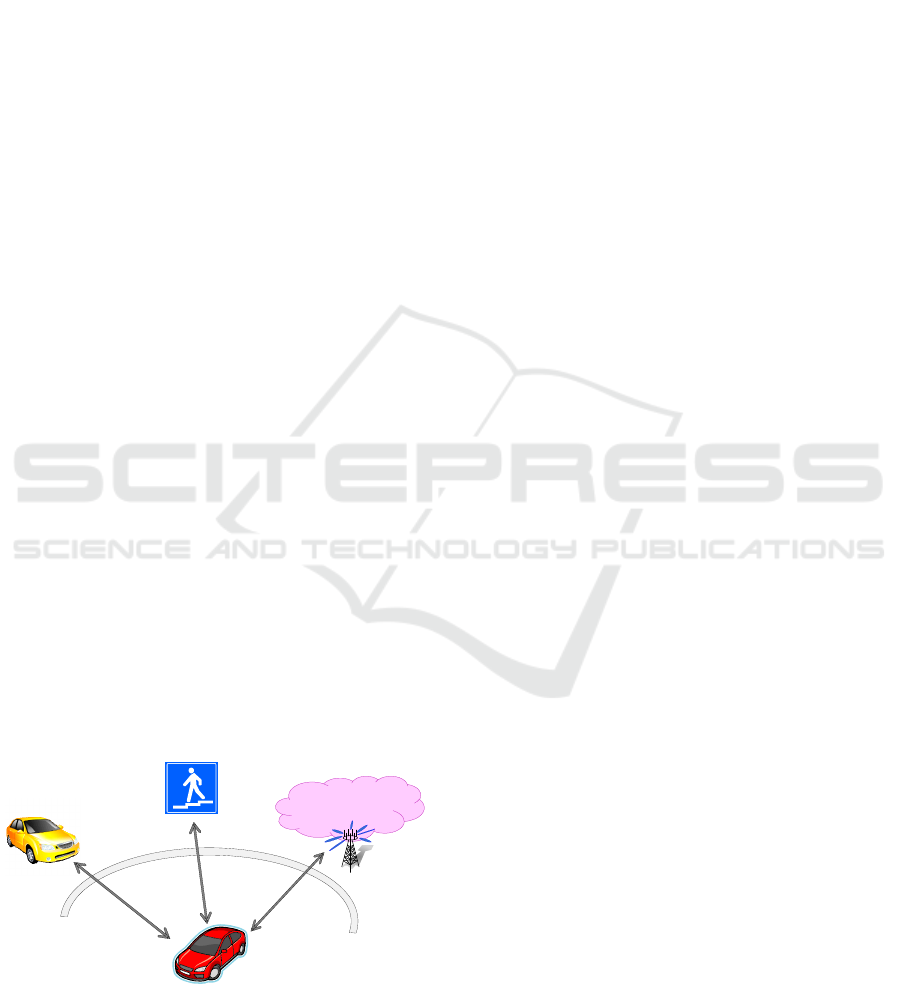
Figure 1: Types of V2X communication.
As shown in Figure 1, V2X communication may
occur in multiple contexts: vehicle-to-vehicle (V2V)
communication, vehicle-to-pedestrian (V2P)
communication, and vehicle-to-infrastructure (V2I)
communication. These applications are referred to as
Intelligent Transport Systems (ITS). V2X applications
range from personal communication and green
transportation to societal mobility and safety in order
to increase travel convenience, comfort, and safety.
V2X applications can be supported by two main
communication classes: cellular-based communica-
tion systems (e.g., Long Term Evolution (LTE)) and
Wi-Fi-based communication (e.g., 802.11p or
802.11n). These systems have different characteristics
with respect to latency, coverage, reliability, and data
rate. Although the latency of cellular communication
systems decreases with the evolution of these systems,
Wi-Fi systems provide a delay of only several
milliseconds in most situations. In contrast, the
coverage of Wi-Fi is significantly smaller when
compared with cellular communication owing to the
lower transmission power and higher frequency of
802.11p. The reliability of both the communication
classes depends on the environment and on the other
users within communication range. Typically, a
cellular system provides higher reliability than a Wi-
Fi based system; a cellular system also guarantees
quality of service (QoS) for the V2X applications
when compared with a Wi-Fi based system.
However, Wi-Fi systems are operating in an
unlicensed spectrum whereas the operators of
V2V
V2P
V2I
Pedestrian
Veh icle
Vehicle
Network
Moon, S., Bae, S., Chu, M., Lee, J., Kwon, S. and Hwang, I.
Adaptive Transmission Scheme for Vehicle Communication System.
DOI: 10.5220/0006409200930099
In Proceedings of the 7th International Joint Conference on Pervasive and Embedded Computing and Communication Systems (PECCS 2017), pages 93-99
ISBN: 978-989-758-266-0
Copyright © 2017 by SCITEPRESS – Science and Technology Publications, Lda. All rights reserved
93
cellular communications must pay for the
frequencies. The data rate is similar for both the
classes. Further, hybrid approaches, which combine
the advantages of cellular-based and Wi-Fi-based
communication systems, are suitable solutions for
efficient V2X communication. LTE has introduced a
device-to-device (D2D) communication link from
Release 12; therefore, cellular D2D can be used
instead of a Wi-Fi based system.
In this manuscript, we design a system-level
simulator (SLS) for LTE-based V2X and propose an
adaptive transmission scheme for vehicle
communication. The proposed scheme allocates the
resource randomly in the time and frequency domains
and transmits the message according to the probability
of transmission. The remainder of this manuscript is
organized as follows. Section 2 presents the design
and deployment of the V2X SLS. Section 3 describes
the details of the proposed adaptive transmission
scheme. Section 4 presents the performance analysis
of the proposed scheme based on simulations. Section
5 states the conclusion of the study.
2 DEPLOYMENT OF V2X
SYSTEM LEVEL SIMULATOR
In this section, we describe the V2X system
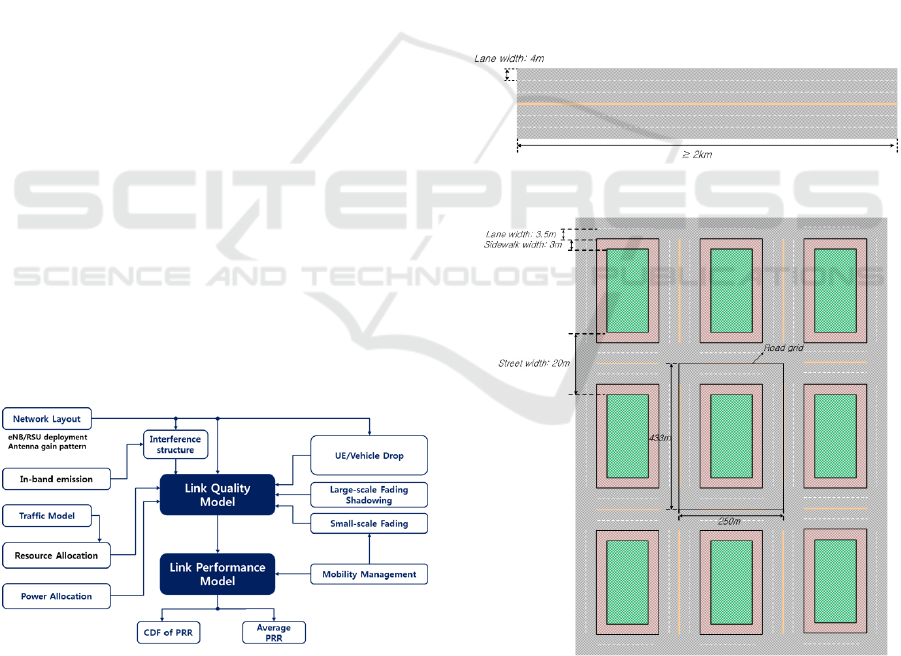
structure. Figure 2 shows the block diagram of the
V2X SLS. The V2X system consists of evaluation
scenario, user equipment (UE) drop and mobility
model, evolved Node B (eNB) and road side unit
(RSU) deployment, a channel model and traffic
model. In addition, we analyze the performance by
using the packet reception ratio (PRR).
Figure 2: Block diagram of V2X system-level simulator.
2.1 Evaluation Scenarios
We define two vehicle UE drop scenarios: Urban
scenario and Freeway scenario. The UE drop model
and mobility model are described in Section 2.2.
Further, the channel model for each scenario is
described in Section 2.4.
Macro eNB may or may not be deployed in the
evaluation. If it is deployed, the assumptions in
Section 2.3 should be used. If it is not deployed, a
simple wrap around can be used.
2.2 UE Drop and Mobility Model
Vehicle UEs are dropped on the roads according to
the spatial Poisson process. The vehicle density is
determined by the vehicle speed assumption, and the
vehicle location should be updated once every 100
ms in the simulation. In the urban scenario, a vehicle
changes its direction at the intersection as follows:
- Go straight with probability 0.5
- Turn left with probability 0.25
- Turn right with probability 0.25
Figures 3 and 4 illustrate the road configuration
for the two scenarios.
Figure 3: Road configuration for urban scenario.
Figure 4: Road configuration for urban scenario.
2.3 eNB and RSU Deployment
If macro eNBs are deployed in the freeway scenario,
the eNBs are located along the freeway at a distance
35 m away with an ISD of 1732 m, as shown in
SPCS 2017 - International Conference on Signal Processing and Communication Systems
94
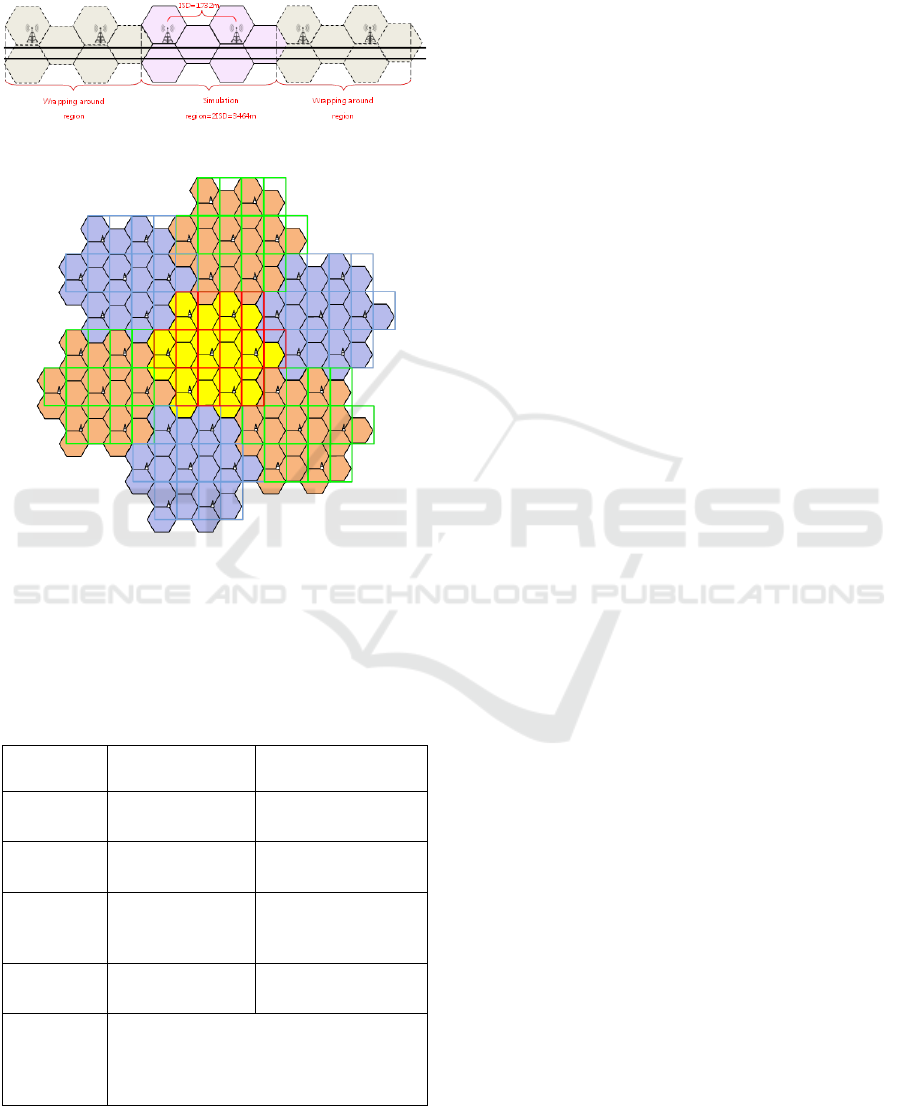
Figure 5. If macro eNBs are deployed in the urban
scenario, the inter-site distance (ISD) of the macro
eNB is 500 m, and the wrap around model is as
shown in Figure 6.
Figure 5: Wrap around model for urban scenario.
Figure 6: Wrap around model for urban scenario.
2.4 Channel Model
The assumptions for the channel between two
vehicle UEs are given in Table 1.
Table 1: Channel model parameters.
Parameter Freeway scenario Urban scenario
Pathloss
model
LOS in
WINNER+ B1
WINNER+B1
Manhattan grid layout
Shadowing
distribution
Log-normal Log-normal
Shadowing
standard
deviation
3 dB
3 dB for LOS and
4 dB for NLOS
Decorrelatio
n distance
25 m 10 m
Fast fading
NLOS in Section A.2.1.2.1.1 or
A.2.1.2.1.2 in 3GPP TR 36.843 with fixed
large-scale parameters during the
simulation.
2.5 Traffic Model
In the evaluation, we use two traffic models:
periodic traffic scenario and event-triggered traffic
scenario. The periodic traffic scenario is mandatory.
The event-triggered traffic scenario can be evaluated
optionally with or without periodic traffic. Every
vehicle in the simulation generates messages
according to the traffic model.
For periodic traffic, the working assumption for
the message size is that one 300-byte message is
followed by four 190-byte messages, and the time
instant for the 300-byte size message generation is
randomized among vehicles. The message size can
be ignored while calculating the performance metric.
For event-triggered traffic, the event arrival follows
a Poisson process with the arrival rate of X (based
on company choice) per second for each vehicle.
Once the event is triggered, six messages are
generated within a span of 100 ms. The working
assumption for the message size of event-trigger
traffic at L1 is 800 bytes.
2.6 Performance Metric
In the evaluation of the proposed schemes for V2V,
the PRR will be considered. For one Tx packet, the
PRR is calculated as X/Y, where Y is the number of
UE/vehicles that are located in the range (a, b) from
the Tx, and X is the number of UE/vehicles with
successful reception among Y. The Cumulative
Distribution Function (CDF) of PRR and the
following average PRRs are used in the evaluation:
-
CDF of PRR with a = 0, b = baseline of 320 m
for freeway scenario and 150 m for urban
scenario. Optionally, b = 50 m for urban
scenario with vehicle speed of 15 km/h.
- Average PRR, calculated as (X1+X2+X3
….+Xn)/(Y1+Y2+Y3…+Yn), where n denotes the
number of generated messages in simulation, a =
i×20 m, b = (i+1)×20 m, and i=0, 1, …, 25.
3 ADAPTIVE TRANSMISSION
SCHEME
In this section, we propose an adaptive transmission
scheme for vehicle communication. The proposed
scheme allocates the resource randomly and
transmits the message according to the probability of
transmission.
The resource is allocated randomly in the time
and frequency domains. The resource units are
Adaptive Transmission Scheme for Vehicle Communication System
95
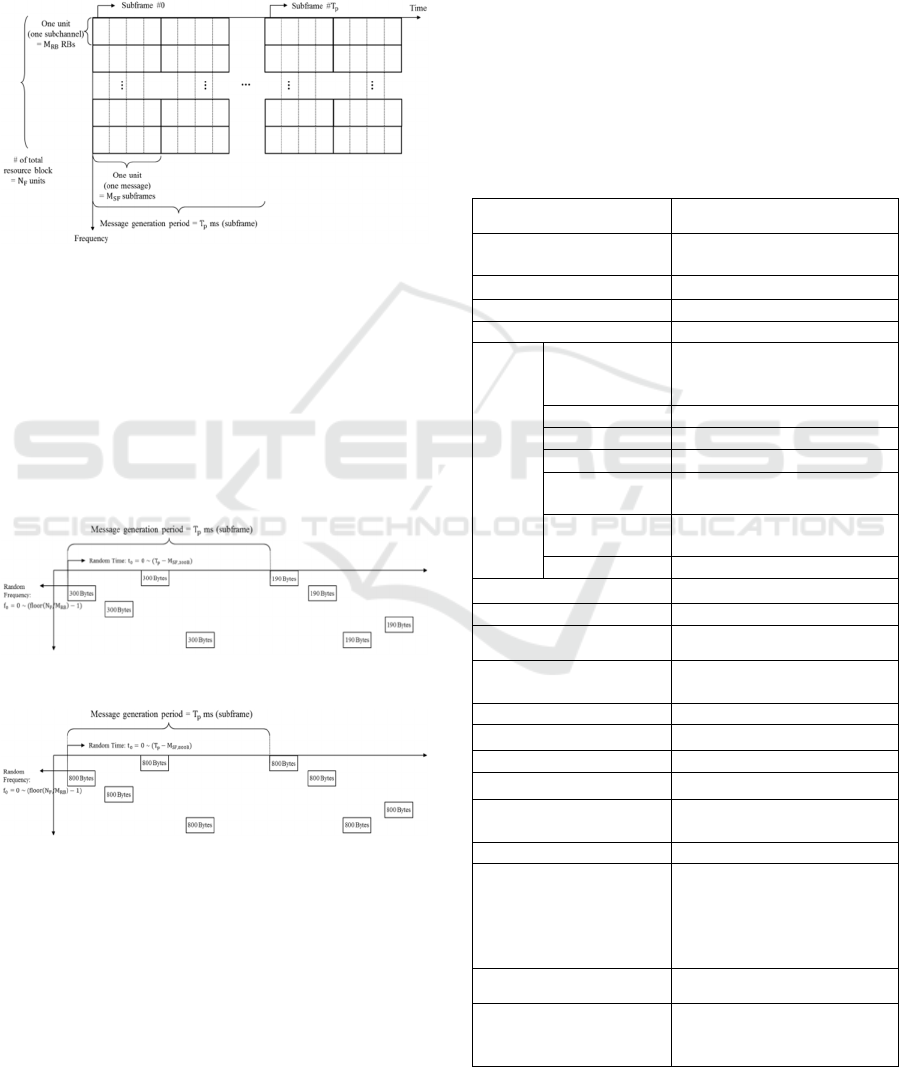
defined as illustrated in Figure 7. N
F
represents the
number of total resource blocks (RBs). M
RB
denotes
the number of allocated RBs. Therefore, the resource
is allocated with a subchannel unit that consists of
M
RB
RBs in the frequency domain. In addition, M
SF
denotes the number of subframes used for message
transmission with the periodicity of T
P
subframes.
Figure 7: Resource unit structure.
Figures 8 and 9 show an example of the resource
allocation structure for the periodic and event-
triggered scenarios, respectively. In this figures, we
set M
RB
=10 with N
F
=50 (for 10 MHz bandwidth) in
the frequency domain. Thus, the random frequency
range is 0 to 4 (0–(floor(N
F
/M
RB
)-1)). In addition,
we set M
SF,300B
=3 and M
SF,190B
=2 with T
P
=100 ms in
the time domain. Thus, the random time range is 0 to
97 ms (0–(T
P
-M
SF,1
)).
Figure 8: Resource allocation for periodic traffic.
Figure 9: Resource allocation for event-triggered traffic.
In addition, Tx UE transmits the message with a
probability P
Tx
. Thus, the interference effect
decreases and the performance improve because Tx
UE does not transmit the message with a probability
(1-P
Tx
). If Tx UE does not transmit the message, we
calculate the PRR that satisfies 100%.
4 SIMULATION MODEL AND
PERFORMANCE ANALYSIS
4.1 Simulation Model and Simulation
Parameters
A system-level simulation is performed to evaluate
the performance of the proposed scheme. The
simulation follows the 3GPP evaluation methodolo-
gy. The simulation is based on the freeway case
scenario in and periodic message transmission.
Table 2 shows the general simulation parameters and
defines the simulated environment.
Table 2: Simulation parameters.
Parameter Assumption
Carrier frequency for
PC5-based V2V
6 GHz
Bandwidth 10/20 MHz
Number of carriers One carrier
Synchronization Frequency error ± 0.1 PPM.
Vehicle
UE
para-
meters
In-band
emission
In-band emission model with
{W, X, Y, Z} = {3, 6, 3, 3}
for single cluster SC-FDMA.
Antenna height 1.5 m
Antenna pattern Omni 2D
Antenna gain 3 dBi
Maximum tx.
power
23 dBm
Number of
antennas
1 TX and 2 RX antennas
Noise figure 9 dB
Number of lanes 3 in each direction
Lane width 4 m
Simulation area size Freeway length >= 2000 m.
Vehicle density
2.5 s ൈ absolute vehicle
speed
Absolute vehicle speed 70 km/h, 140 km/h
ISD 1732 m
Pathloss model LOS in WINNER+ B1
Shadowing distribution Log-normal
Shadowing standard
deviation
3 dB for LOS and 4 dB for
NLOS
Decorrelation distance 25 m
Fast fading
NLOS in Section A.2.1.2.1.1
or A.2.1.2.1.2 in 3GPP TR
36.843 with fixed large-scale
parameters during the
simulation.
Traffic Model Periodic traffic
Message size
One 300-byte message
followed by four 190-byte
messages
SPCS 2017 - International Conference on Signal Processing and Communication Systems
96
Further, the time and frequency resource in the
simulation is defined according to the category and
condition, as shown in tables 3 and 4, respectively.
Table 3: Category for simulation.
Category
Total
number of
RBs (N
F
)
Probability of
transmission
(P
Tx
)
Number of
transmissions
(R)
1 100 1 4
2 100 1 2
3 50 1/2 4
4 50 1/2 2
Table 4: Condition for simulation.
300
Bytes
Number of RBs 10
Number of subframes
3
Code rate
(Modulation/I
TBS
)
0.3030
(QPSK/5)
190
Bytes
Number of RBs 10
Number of subframes
2
Code rate
(Modulation/I
TBS
)
0. 2879
(QPSK/5)
4.2 Simulation Results and
Performance Analysis
4.2.1 Resource Status
In this section, we analyze the resource status
according to the category in the simulation area, as
shown in Figure 6. The number of collision RBs,
unused RBs, and used RBs per subframe are listed in
Table 5 and Table 6 according to the vehicle speed,
category (CAT).
The number of allocated RBs (N
F
) is 100, and
the number of transmissions (R) is 4. Thus, the
number of collision RBs is the highest because the
number of used RBs is the highest. In the case of
category 2, N
F
is 100, and R is 2. Thus, we observe
that the number of collision RBs is lower than that in
category 1 owing to the decrease in the number of
used RBs that use a reduced number of
transmissions. In the case of categories 3 and 4, the
number of collision RBs decreases because the
probability of collision increases when the number
of allocated RBs is reduced to 50; however,
categories 3 and 4 do not transmit with a probability
1/2. In addition, the value of R for category 3 and 4
is 4 and 2, respectively. Thus, the number of
collision RBs decreases as the number of
transmissions decreases.
Table 5: Resource status: velocity 70km/h.
CAT Collision RBs Unused RBs Used RBs
1 67.4 12.1 87.9
2 37.9 30.4 69.6
3 31.6 8.3 41.7
4 19.6 13.3 36.7
Table 6: Resource status: velocity 140km/h.
CAT Collision RBs Unused RBs Used RBs
1
36.3 32.6 67.4
2
17.4 51.5 48.5
3
20.8 14.1 35.9
4
9.3 24.1 25.9
4.2.2 PRR
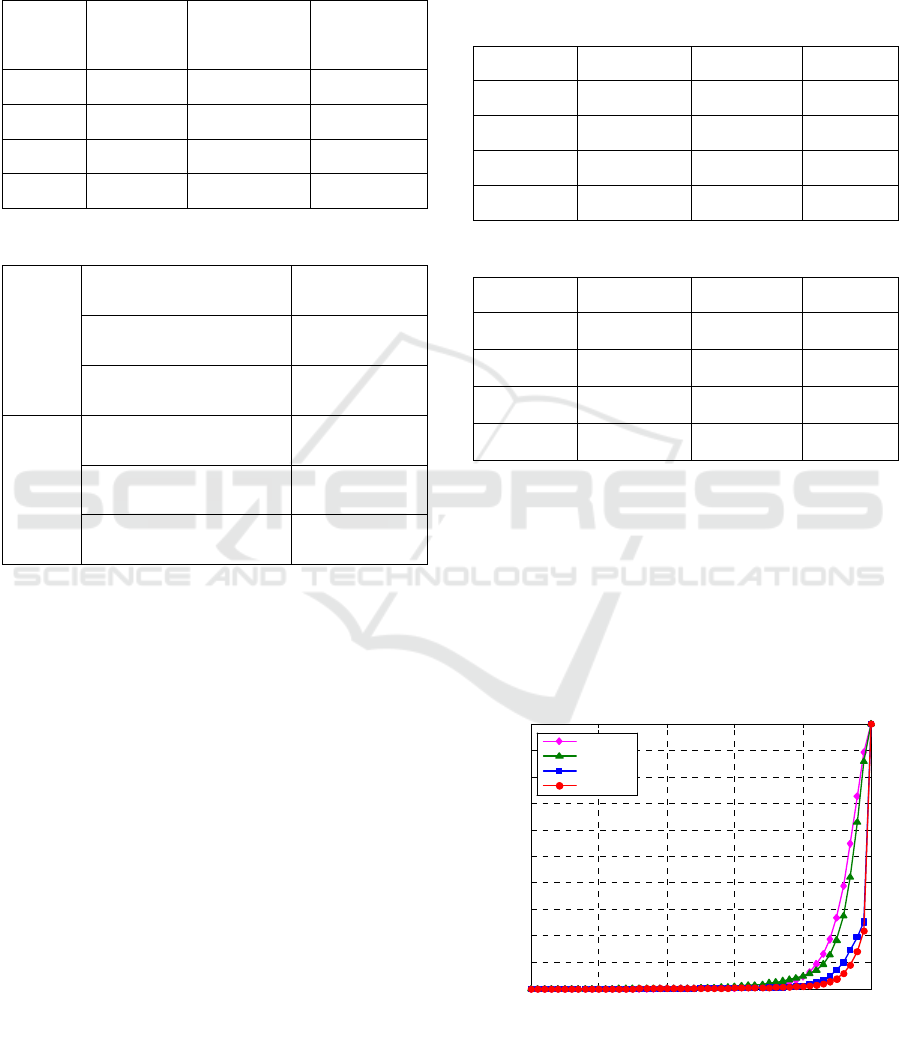
The CDF of PRR and the average PRR are used in
the evaluation. Figures 10 and 11 show the CDF of
PRR for vehicle speeds of 70 km/h and 140 km/h,
respectively. Figure 12 and Table 7 show the
average PRR for a vehicle speed of 70 km/h. Figure
13 and Table 8 show the average PRR for a vehicle
speed of 140 km/h.
Figure 10: CDF of PRR: velocity 70km/h.
0 0.2 0.4 0.6 0.8 1
0
0.1
0.2
0.3
0.4
0.5
0.6
0.7
0.8
0.9
1
Packet Reception Ratio (PRR)
CDF
Periodic, Freeway 70km/h, Condition 1
Category 1
Category 2
Category 3
Category 4
Adaptive Transmission Scheme for Vehicle Communication System
97
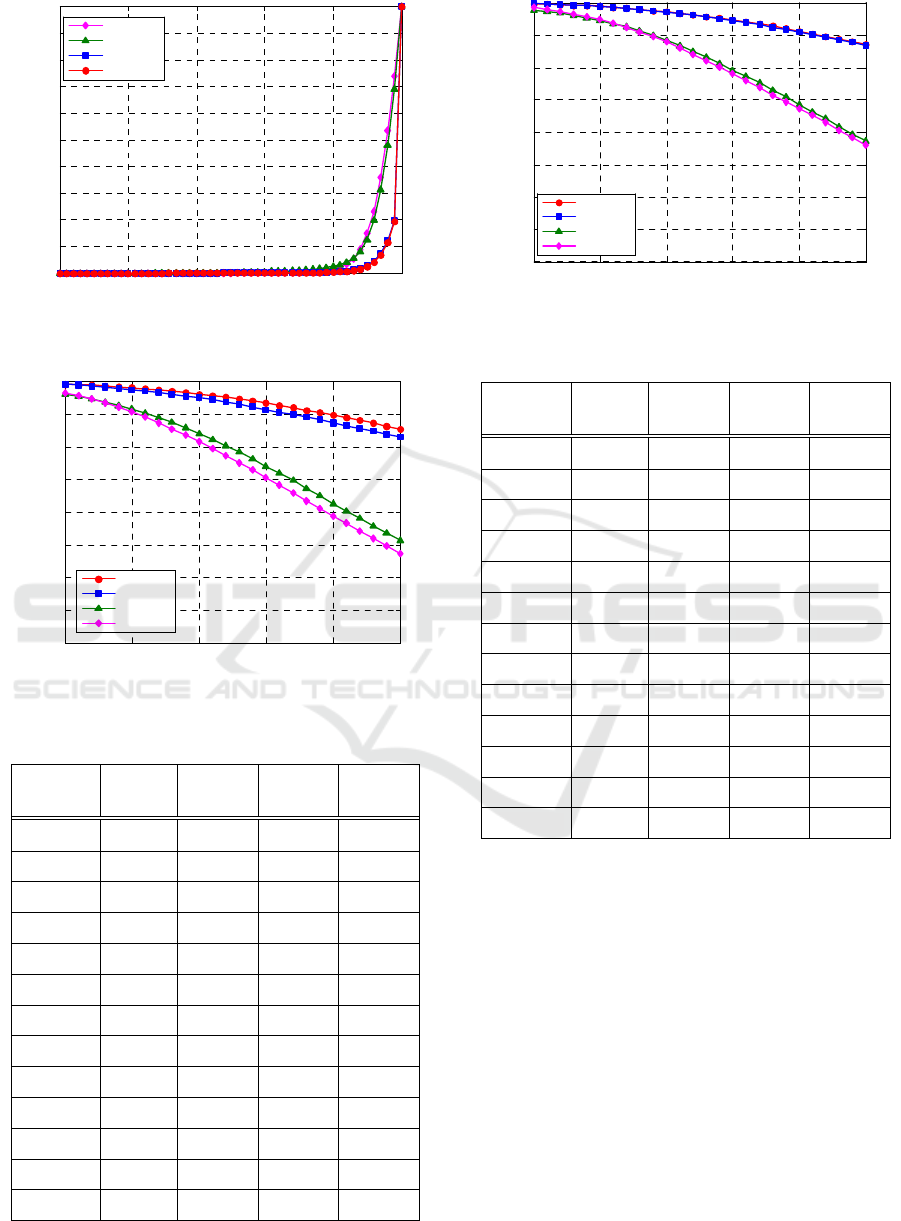
Figure 11: CDF of PRR: velocity 140km/h.
Figure 12: Average PRR: velocity 70km/h.
Table 7: Average PRR: velocity 70km/h.
Range
(m)
CAT 1 CAT 2 CAT 3 CAT 4
20~40 0.9778 0.9770 0.9941 0.9948
60~80 0.9673 0.9682 0.9912 0.9928
100~120 0.9538 0.9576 0.9877 0.9902
140~160 0.9365 0.9443 0.9830 0.9870
180~200 0.9177 0.9291 0.9774 0.9829
220~240 0.8973 0.9111 0.9715 0.9781
260~280 0.8754 0.8920 0.9648 0.9729
300~320 0.8530 0.8700 0.9570 0.9666
340~360 0.8294 0.8482 0.9491 0.9596
380~400 0.8054 0.8245 0.9409 0.9520
420~440 0.7830 0.8013 0.9325 0.9441
460~500 0.7593 0.7787 0.9238 0.9359
500~520 0.7366 0.7566 0.9148 0.9273
Figure 13: Average PRR: velocity 140km/h.
Table 8: Average PRR: velocity 140km/h.
Range
(m)
CAT 1 CAT 2 CAT 3 CAT 4
20~40 0.9895 0.9863 0.9975 0.9970
60~80 0.9822 0.9805 0.9958 0.9957
100~120 0.9736 0.9721 0.9938 0.9939
140~160 0.9617 0.9623 0.9911 0.9909
180~200 0.9472 0.9493 0.9876 0.9876
220~240 0.9298 0.9335 0.9833 0.9832
260~280 0.9102 0.9157 0.9776 0.9786
300~320 0.8904 0.8959 0.9722 0.9731
340~360 0.8686 0.8756 0.9658 0.9664
380~400 0.8464 0.8542 0.9585 0.9593
420~440 0.8257 0.8316 0.9506 0.9513
460~500 0.8029 0.8086 0.9419 0.9434
500~520 0.7797 0.7865 0.9336 0.9347
5 CONCLUSIONS
In this study, we designed an SLS for an LTE-based
V2X and proposed an adaptive transmission scheme
for vehicle communication. We allocated the
resource randomly in the time and frequency
domains and transmitted the message according to
the probability of transmission. The performance
analysis was based on the freeway scenario and
periodic message transmission. Simulation results
show that our proposed scheme can improve the
CDF of PRR and the average PRR.
In future work, we will consider the resource
allocation algorithm in order to improve the
reliability of the LTE-based V2X system.
0 0.2 0.4 0.6 0.8 1
0
0.1
0.2
0.3
0.4
0.5
0.6
0.7
0.8
0.9
1
Packet Reception Ratio (PRR)
CDF
Periodic, Freeway 140km/h, Condition 1
Category 1
Category 2
Category 3
Category 4
0 100 200 300 400 50
0
0.6
0.65
0.7
0.75
0.8
0.85
0.9
0.95
1
Distance [m]
Average PRR
Per iodic, Freeway 70km/h, Condition 1
Category 4
Category 3
Category 2
Category 1
0 100 200 300 400 500
0.6
0.65
0.7
0.75
0.8
0.85
0.9
0.95
1
Distance [m]
Average PRR
P
er
i
o
di
c,
F
reewa
y
140k
m
/h
,
C
on
diti
on
1
Category 4
Category 3
Category 2
Category 1
SPCS 2017 - International Conference on Signal Processing and Communication Systems
98

ACKNOWLEDGEMENTS
This research was supported by the MSIP(Ministry
of Science, ICT and Future Planning), Korea, under
the ITRC(Information Technology Research Center)
support program (IITP-2016-R2718-16-0011)
supervised by the IITP(Institute for Information &
communications Technology Promotion). This
research was supported by Basic Science Research
Program through the National Research Foundation
of Korea(NRF) funded by the Ministry of
Education(NRF-2015R1D1A1A01059397). This
study was financially supported by Chonnam
National University(Grant number: 2016-2503).
REFERENCES
3GPP TR 22.885, Study on LTE Support for V2X
Services.
Md. Sazzad Hossen, et al. 3, 2014. Performance Analysis
of an OFDM-based, ICUFN.
Zheng Li, et al. 3, 2013. Tentpoles Scheme: a Data-Aided
Channel Estimation Mechanism for Achieving
Reliable Vehicle-to-Vehicle Communications, IEEE
Transactions on Wireless Communications
Wai Chen, 2015. Vehicular communications and
Networks, Elsevier
3GPP TR 36.885, Study on LTE-based V2X Services.
3GPP TR 36.843, Study on LTE Device to Device
Proximity Services.
Adaptive Transmission Scheme for Vehicle Communication System
99
