
A Hardware/Software Platform to Acquire Bioelectrical Signals. A Case
Study: Characterizing Computer Access through Attention
Alberto J. Molina, Isabel M. G
´
omez, Jaime Guerrero, Manuel Merino, Juan A. Castro,
Royl
´
an Quesada, Santiago Berrazueta and Mar
´
ıa Hermoso-de-Mendoza
Departamento de Tecnolog
´
ıa Electr
´
onica, Universidad de Sevilla, Spain
Keywords:
Attention, Biofeedback, BCI, HRV, GSR, EDA, SC, Affordable Devices.
Abstract:
This paper describes a hardware/software platform to acquire human body signals. In the field of physiological
computing it is desirable to have a system that allows the synchronized acquisition of signals coming from
different sources. Here is described how to unify the whole process of acquiring signals from both customized
hardware and low cost commercial devices such as Neurosky’s mindwave. A case study using this platform
is also shown: studying the feasibility of using sustained attention to access a computer. In order to do that
brain activity was measured using Neurosky’s mindwave. The participants in this study were asked to keep
their attention high/low for as long as possible during several trials. Experimentation was performed by 7
normally developed subjects and 3 people with cerebral palsy (CP). Our preliminary work shows that 60%
of participants might be potential users of this technology. Eventually, modulating the attention to access a
communication board needs a scanning period greater than 5.76s.
1 INTRODUCTION
Communication is vital for human beings. A system
allowing people with disabilities to access a computer
or a communication system reliably would be highly
beneficial. We can find several devices on the market
and scientific papers which translate user intentional-
ity into discrete events. The simplest and one of the
most extended is based on a binary switch (on/off con-
tacts), whereby people with disabilities can use soft-
ware applications, particularly those based on scan-
ning methods. A good survey for assistive devices
can be found in (McMurrough et al., 2012).
For people with severe disabilities these simple
devices are still very difficult to use. For them, brain
computer interfaces (BCI) could be a feasible alterna-
tive. BCI systems (Nicolas-Alonso and Gomez-Gil,
2012; Mill
´
an et al., 2010) are based on recording cor-
tical neuronal activity, and one way to achieve this is
by means of EEG (Electro-Encephalo-Graphy) which
requires several electrodes placed on the scalp. One
possible drawback with these systems is their cost
which prevents most people with disabilities from ac-
quiring it. Nevertheless, some companies, such as
Emotiv and Neurosky have released their wireless
BCI headsets (Emotiv Epoc, Neurosky mindwave,..)
for entertainment uses such as brain gaming and mind
monitoring with affordable prices for the consumers.
Emotiv has up to 14 channels covering all the cere-
bral lobes and the two hemispheres and it has also
studied as potential BCI system for people with dis-
abilities (Welton et al., 2016). NeuroSky mindwave is
cheaper than Emotiv epoc and it has only one channel
placed at the pre-frontal left position, Fp1. In (Das
et al., 2014) a comparison was carried out between
both low-cost systems, to detect cognitive loads. The
authors found that Emotiv provided better results but
recognized the advantages of Neurosky because it is
more user-friendly, easier to setup and maintain.
It is known that cognitive tasks influences signals
captured from the human body in several ways. For
example, stress affects brain rhythms, reducing the
power of α waves in EEG (Tyson, 1987), influences
the heart rate variability (Taelman et al., 2009) or pro-
duces changes in the electrodermal activity (EDA)
(Villarejo et al., 2012). Attention is a cognitive pro-
cess and there are several types of attention the human
beings use during daily activities. One of them is the
Sustained Attention which can be defined as the abil-
ity to focus on one specific task for a lapse of time
without being distracted (e.g.: during playing a video
game) (Barkley, 1997).
Training sustained attention can be beneficial for
children with Attention Deficit Hyperactivity Dis-
76
Molina, A., Gómez, I., Guerrero, J., Merino, M., Castro, J., Quesada, R., Berrazueta, S. and Hermoso-de-Mendoza, M.
A Hardware/Software Platform to Acquire Bioelectrical Signals. A Case Study: Characterizing Computer Access through Attention.
DOI: 10.5220/0006412200760083
In Proceedings of the 4th International Conference on Physiological Computing Systems (PhyCS 2017), pages 76-83
ISBN: 978-989-758-268-4
Copyright © 2017 by SCITEPRESS – Science and Technology Publications, Lda. All rights reserved

order (ADHD) or people with motor disabilities.
In (Mu
˜
noz et al., 2015) the authors developed a
videogame to train sustained attention for children
with ADHD using as an action mechanism the neuro-
modulation of θ and β waves through an electrode lo-
cated on the central part of the forehead. In (Heidrich
et al., 2015) people with cerebral palsy (CP) took part
in a experiment in which they had to control their at-
tention to play with different games. In those games,
the players had to reach a certain level of attention
or/and to keep it over a preset value to make the game
advance.
This work looks into the feasibility of modulat-
ing sustained attention to control a system in a binary
way (on -high attention-, off -low attention-), such as
a switch, while using cheap BCI devices. Subjects
need to keep the attention low/high for a while and be
volitionally able to switch between them. We have de-
veloped a software/hardware platform to receive sev-
eral signals from the human body to train the mod-
ulation of the sustained attention and study how tir-
ing this method of interaction is based on physiolog-
ical signals like heart rate variability (HRV) and gal-
vanic skin response (GSR). In this preliminary work
we have just shown part of this study: the platform
designed and preliminary data based only on the EEG
signal.
Section 2 briefly explains the fundamentals of at-
tention and some techniques used to measure it. Sec-
tion 3 shows the devices and tools employed in ex-
perimentation, section 4 describes the methodology
followed in experimentation and section 5 the results.
Finally, sections 6 and 7 contain the discussion and
the conclusions respectively.
2 MEASURING THE SUSTAINED
ATTENTION
From a temporal point of view, attention makes EEG
signals more complex, so its measurement could be
based on its fractal dimension. Several works have
shown the reliability of such an approach (Wang et al.,
2010; Wang and Sourina, 2013; Lee et al., 2000; Sia-
maknejad et al., 2014). There have also been some
works into the effects that attention or cognitive skills
have on power bands. In general, the α band increases
as the difficulty of the task diminishes or after task
practice, suggesting that fewer cortical resources are
required (Gevins et al., 1997). In the same work, in-
creases in θ suggested that focusing attention or in-
creasing the memory load require more effort. The
use of the ratio between frequency bands like θ/β,
known as theta-beta ratio (TBR), has also been re-
ported as an indicator for attention deficit disorder
(ADD) or ADHD people (Lubar, 1991). TBR is in-
creased in frontocentral areas in children with atten-
tion deficit disorders.
Some papers have shown the feasibility of detect-
ing attention using a reduced number of electrodes.
In (Rodr
´
ıguez et al., 2013) five different bipolar con-
figurations of two electrodes were investigated dur-
ing exercises of attention. Results showed that EEG
rhythms were observed with more amplitude in two
EEG channels: Fp1-A1 and FP1-T3. They adopted
the configuration Fp1-A1, because those positions are
free of hair which allows an easy electrodes place-
ment (these are the positions used in Neurosky mind-
wave). They also found that the α, β and γ rhythms
presented significant differences (p < 0.05) between
low- and high-attention level. For this reason, they
proposed an index, named Attention Power (AP),
based on the sum of the power α and β bands to con-
trol a game. The 80% of the subjects found corre-
lation between his/her attention level and the effect
exerted over the game.
3 THE DEVELOPED PLATFORM
In this section we show the devices that have
beenused, the designed circutis and the software made
to acquire and process signals coming from different
body sources.
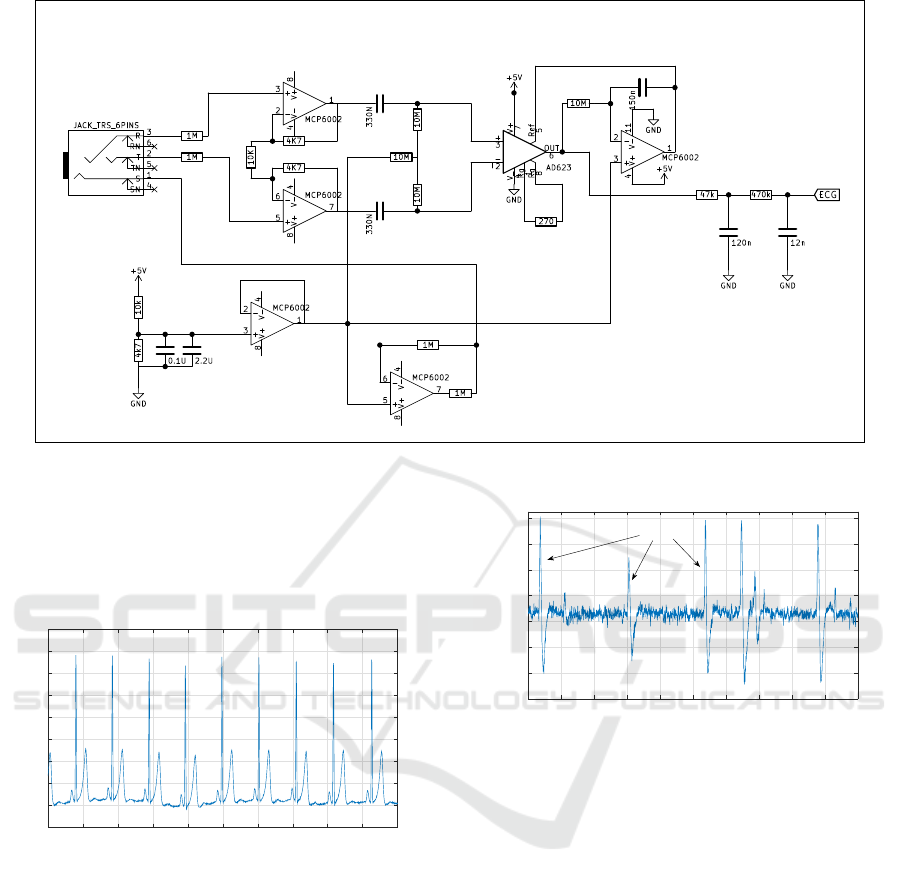
3.1 Electrocardiogram Circuit
We have developed an electrocardiogram circuit
based on the one shown in (Spinelli et al., 2001). Fig-
ure 2 shows the schematic of the implemented circuit,
which uses three passive electrodes, one of them to
reduce the common mode interference. The circuit
has a frequency response ranging from 0.1 Hz up to
30Hz, using a one-pole high pass filter and a second
order low pass filter. The former reduces the signal
wandering while the latter helps to increase rejection
ratio at 50Hz as well.
Signal is sampled at a 250Hz ratio by an Arduino
platform which also implements a Notch digital filter
to reduce the 50Hz interference (Eq. 1). Filtered data
is sent to a computer by serial port at 115200 bps.
H(z) =
z
2
− 0.618z +1
z
2
− 0.601z + 0.92
(1)
An example of a 10-second filtered signal while
performing an experiment is shown in Figure 2. It
can be observed the main waves of a typical electro-
cardiogram with very low interference noise.
A Hardware/Software Platform to Acquire Bioelectrical Signals. A Case Study: Characterizing Computer Access through Attention
77
Rg
1
-
2
+
3
V_
4
Ref
5
OUT
6
V+
7
Rg
8
AD623
S
1
T
2
R
3
SN
4
TN
5
RN
6
JACK_TRS_6PINS
1M
1M
+5V
GND
V+
4
V-
11
1
-
2
+
3
MCP6002
10k4k7
0.1U 2.2U
GND
+5V
150n
10M
270
V-
4
V+
8
+
5
-
6
7
MCP6002
1M
47k
120n
470k
12n
GND GND
+5V
GND
V-
4
V+
8
+
5
-
6
7
MCP6002
V-
4
V+
8
1
-
2
+
3
MCP6002
4K7
4K7
10K
330N
10M
330N
10M
10M
V-
4
V+
8
1
-
2
+
3
MCP6002
1M
ECG
Figure 1: Electrocardiogram circuit based on the design shown in (Spinelli et al., 2001).
The ECG signal may be used to measure how stressful
a cognitive task might be (Merino et al., 2014) but
also to detect whether the subject is paying attention
or not (Chen et al., 2010).
t (s.)
0 1 2 3 4 5 6 7 8 9 10
ECG
250
300
350
400
450
500
550
600
650
700
Figure 2: A ten second ECG signal after applying the notch
filter.
3.2 Electroencephalogram Device
Neurosky’s mindwave is a device that measures brain
activity using a sensor on the forehead (Fp1) and a
clip located on the left ear that acts as a ground and
reference. It delivers information that we can classify
in three levels of processing. From lowest to higher
levels, they are: raw EEG signal (Figure 3) at a sam-
pling rate of 512Hz and 12 bits of resolution, power
bands, δ, θ, α, β and γ and eSense, which includes
propietary meters for attention and meditation. Power
bands and eSense signals help reduce the processing
of the raw signals in external devices and allow to use
digital systems with low computation resources.
t (s.)
0 1 2 3 4 5 6 7 8 9 10
EEG
-600
-400
-200
0
200
400
600
800
BLINKS
Figure 3: A segment of raw EEG signal with ocular artifacts
while performing an experiment.
Neurosky’s manufacturer states that attention signal
has more emphasis on beta wave but the exact algo-
rithm has not been published. Nevertheless, it has
been shown that there is a positive correlation be-
tween the reported attention level of this device and
the self-reported attention levels of the participants in
a experiment which analyzed the Neurosky usability
in an assessment exercise (Rebolledo-Mendez et al.,
2009).
In this work we show the results obtained based
only on the attention signal delivered by the Neu-
rosky.
3.3 Galvanic Skin Response Circuit
The GSR circuit is shown in Figure 4. The amplifier
on the left works in non-inverter mode which gain is
controlled by the skin resistance. Hence, as the skin
resistance increases, the gain also does. Oune elec-
trode is powered at 0.5v, while the other is connected
PhyCS 2017 - 4th International Conference on Physiological Computing Systems
78
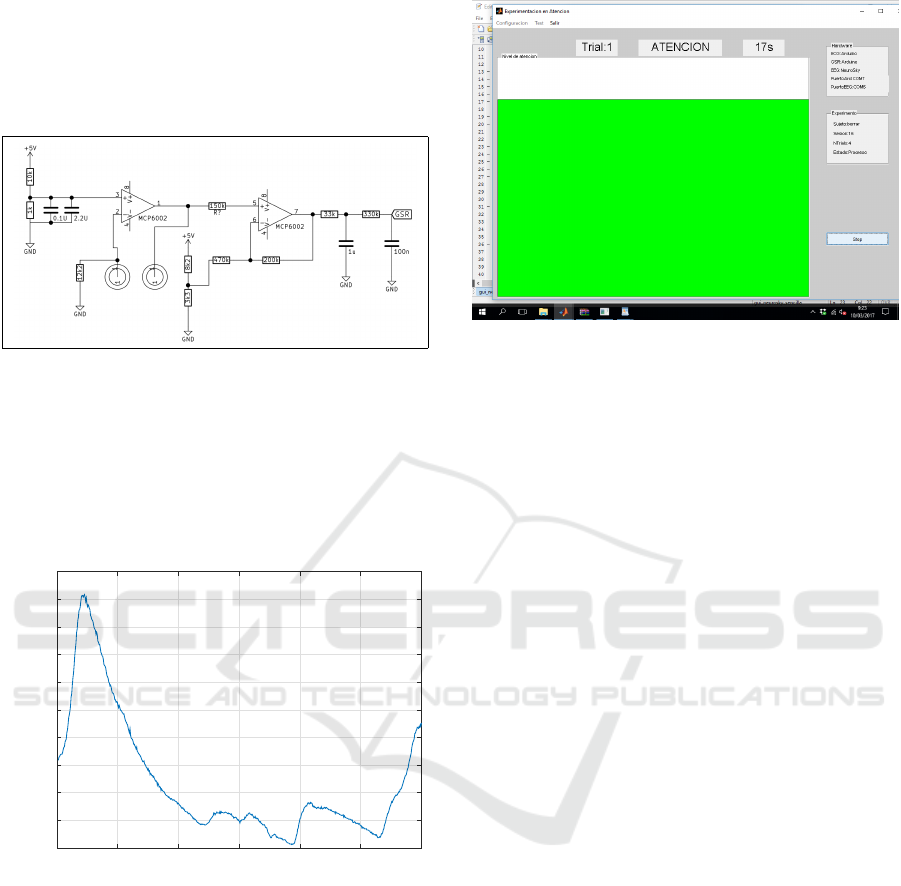
the the amplifier output. The second amplifier basi-
cally shifts down the voltage 0.6v and amplifies the
first stage 1.5 times. A low pass filter with a cutoff
frequency of approximately 5Hz filters out most of
the signal noise.
Figure 4: Schematic of the GSR circuit.
The Arduino board samples this signal at 250Hz and
sends it to the computer wherein it is filtered using
a 31-tap FIR low pass filter with cutoff frequency of
1Hz and, then, downsampled with a 25:1 ratio. A typ-
ical raw signal after applying these processes is shown
in Figure 5.
Time (s.)
0 10 20 30 40 50 60
Conductance
0.013
0.014
0.015
0.016
0.017
0.018
0.019
0.02
0.021
0.022
0.023
Figure 5: A segment of raw GSR signal.
3.4 Software
A Matlab
c
graphic user interface (GUI) was built to
train subjects’ sustained attention, capture informa-
tion received from different sensors and store data
for posterior analysis. Several functions read data
coming from Arduino and Neurosky’s mindwave, and
create input streams to a synchronization software
called labstreaminglayer (Medine, 2016). During
the experiment, the software sends marks to the lab-
streaminglayer to delimit the different phases of the
experiment. Another function reads and stores the
output streams.
Figure 6: A screenshot of the application during a trial.
4 EXPERIMENTATION
For neuro-feedback purposes, a great part of the
screen shows a bar which moves up and down chang-
ing its color according to the received attention values
which ranged from 0 to 100 like a percentage. The
higher the attention value, the higher the bar shown
on the screen. The color of such a bar is green for an
attention level over 60%, red if it is under 40% and
yellow otherwise.
4.1 Participants
Seven normally developed subjects (A1,..A7) aged
36.4 ± 10.2 formed group A (control group) and three
subjects with CP (B1,..B3) aged 35.3 ± 1.2 made up
group B, who were recruited from ASPACE Sevilla,
a non-governmental organization specialized in cere-
bral palsy. The recruitment into group B was done
according to the following inclusion criteria:
1. The access to a computer by traditional switch-
based devices is usually very hard to be carried on
or almost impossible,
2. Have good intellectual capabilities,
3. GMFCS Level V (Palisano et al., 1997),
4. CFCS Level IV (Hidecker and et al., 2011).
The participants agreed to take part in the experi-
ment and in the case of group B, their families were
informed and allowed their participation. The Ethics
Committee of the University of Seville also approved
this experiment.
4.2 Conditions
Experimentation was carried out in a quiet room with
dim lighting. The experiment was considered correct
A Hardware/Software Platform to Acquire Bioelectrical Signals. A Case Study: Characterizing Computer Access through Attention
79
if there were no interruptions. Participants belonging
to group A were told to set the environmental condi-
tions (temperature, lighting) so that they were com-
fortable during the experiment. For group B subjects,
experimentation was conducted by a caregiver who
was always present and set the environmental condi-
tions.
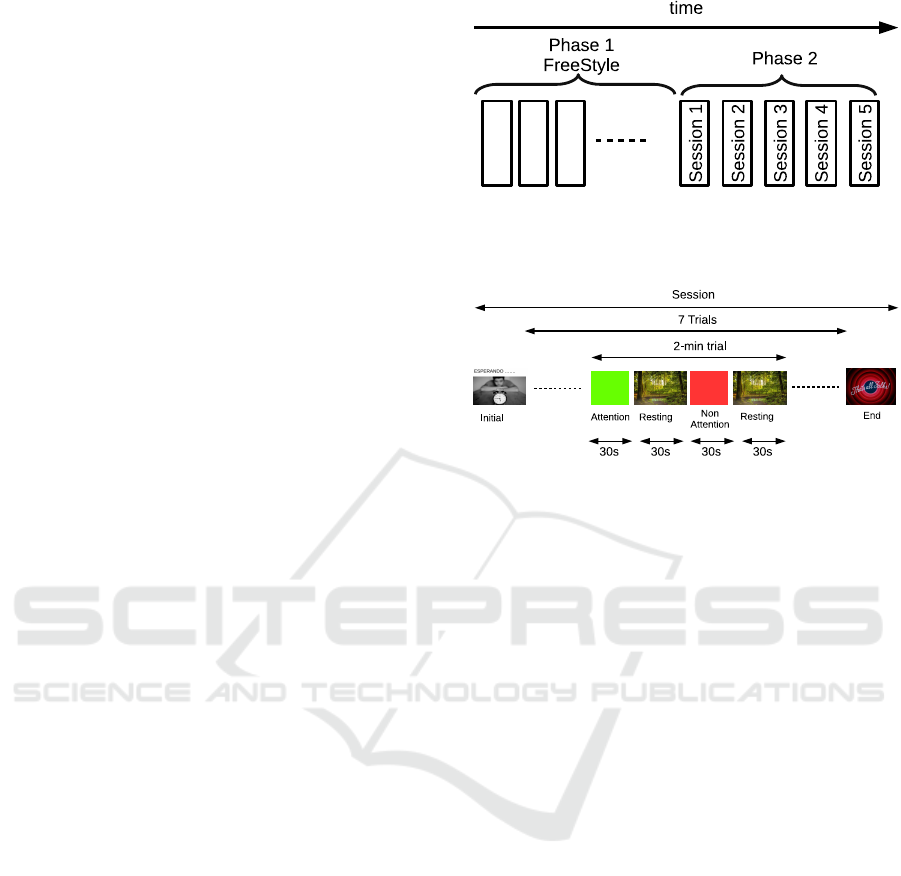
4.3 Phases in Experimentation
Experimentation consisted of two phases (see Figure
7). As explained below, in the first phase the partici-
pants had to find the strategies to control their atten-
tion. Those who would not have been able to control
their mental state properly did not perform the follow-
ing phase. The second phase was similar to the first
with the difference that we recorded the information
sent by the sensor during the attention/non-attention
trials.
4.3.1 Phase 1
The main goal of phase 1, also called ”Freestyle”,
was to practice and try to find the best strategies to
control attention levels. Previously, they were told
to follow a series of basic strategies. For instance,
to practice attention we told them: ”try to perform
mathematical operations”, ”try to plot an object men-
tally”, etc. To practice non-attention we suggested:
”try not to think about anything”, ”make your mind
go blank”, etc. These suggestions were to get them
going, they each had to find the best way of control-
ling her/his level of attention. We used the software
explained above to give participants feedback about
how they were performing the experimentation. The
caregiver sometimes asked participants in group B to
perform several attention/non-attention actions to get
some feedback about their achievements.
The number of sessions in phase 1 depended on
the subject but to prevent this phase from becoming
too drawn out, we set an upper limit of 10 sessions of
roughly 15 minutes.
At the end of each session in this phase, group A
participants were asked to fill in a short questionnaire
about how well they had performed the experiment.
Those who admitted not having controlled attention
properly in more than two out of the last five sessions,
were excluded from the following phase. In group B,
the caregiver was responsible for discriminating such
participants.
4.3.2 Phase 2
In this phase participants performed a sequence of
5, 14 minute, sessions (one per day). Each session
Figure 7: Experimental time sequence. Phase 1: Subjects
must find the strategies to control their attention levels. A
maximum of ten 15-min sessions was set. Phase 2: Five
14-min sessions with 7 attention/non-attention trials.
Figure 8: The temporal sequence in a experimental session.
consisted of 7, 2-minute, trials divided into four 30-
second parts. In each part, subjects had to keep
their attention level above/below a threshold of 50%
as soon as the application requested it. In the sec-
ond/fourth 30-second part of the trial the subject had
to relax, and to help participants do so, the soft-
ware showed an idyllic landscape on screen. Figure
8 shows the time schedule of this phase.
5 RESULTS
Data were analyzed using GNU Octave version 3.8.1
and R version 3.0.2. The first analysis was to find out
how the method for identifying attentional states had
worked. As the variable selected to control feedback
to the user was the attention signal, the exploratory
analysis was based solely on this.
Phase 1 removed four participants from group A
and one for group B. Namely, participants A5-A7 and
B1 were unable to control their attention level and did
not go on the following phase.
Figure 9 shows boxplots containing the results
of phase 2 for each subject and session, differenti-
ating between attention trials (green boxes) and non-
attention ones (red boxes). Each box contains 7 values
representing the average of the attention percentages
of a trial in a session.
Table 1 shows the mean and standard errors of
some quantitative features which may characterize
experimental results:
PhyCS 2017 - 4th International Conference on Physiological Computing Systems
80
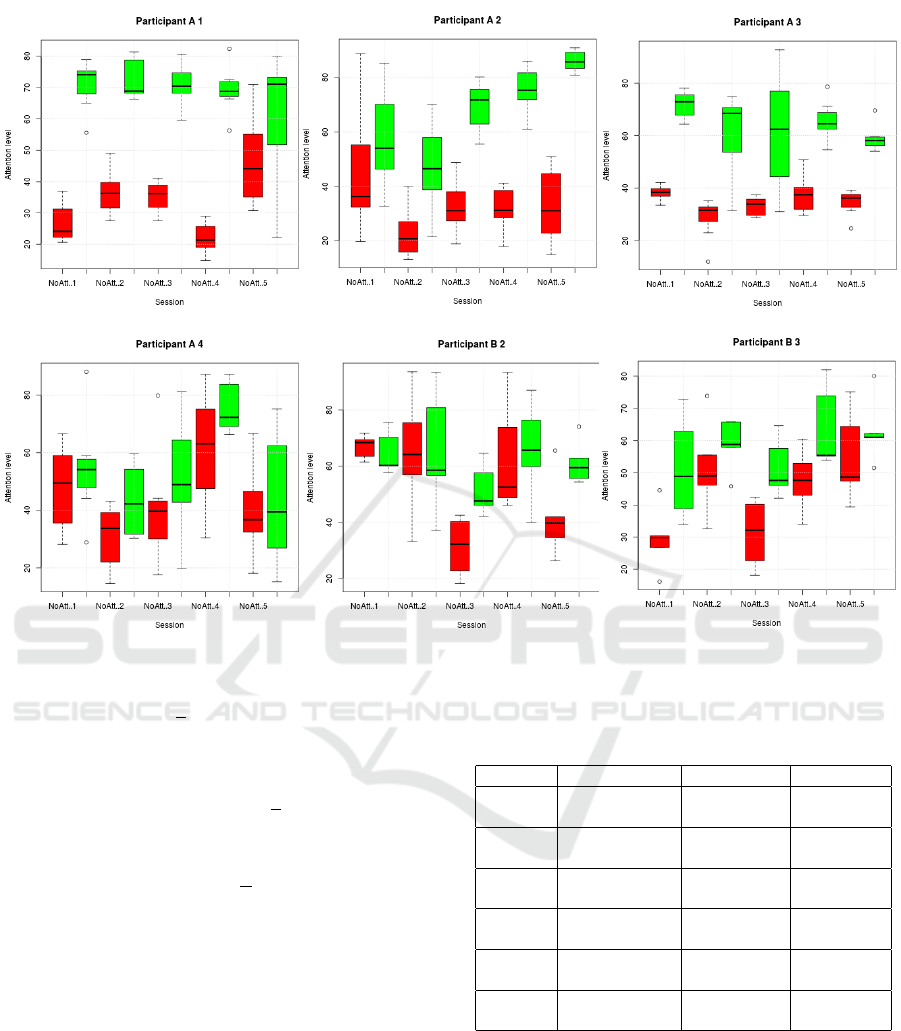
Figure 9: Attention levels for participants and sessions. Green boxes contain averaged values for attention trials; red boxes
the averaged values for non-attention trials.
• The initial time, t
i
or time elapsed, in average,
from the beginning of the trial until the sub-
ject made the attention level go above/below the
threshold in attention/non-attention trials respec-
tively. We can differentiate t
i
for attention and
non-attention trials calling it t
on
and t
o f f
respec-
tively.
• Sustained attention time, t
s
, shows how long, on
average, the subject could maintain the attention
level without crossing the threshold.
6 DISCUSSION
Figure 9 shows that subjects A1, A2 and A3 per-
formed the experiment rather well, as the attention
boxes generally contained higher values (above the
50% threshold) than the non-attention ones (below
50%) and there was not excessive overlapping among
them. It was clearly not easy to perform all sessions
of the experiment perfectly. For example, participant
A1 did not obtain good results in the last session; nei-
ther did, A2 in the first and second sessions nor A3
Table 1: Initial time and sustained attention time for each
participant. Standard errors (SE) are also shown.
Subject Condition )
¯
t
i
± SE (s)
¯
t
s
± SE (s)
A1
Attention 2.48 ± 0.87 19.3 ± 3.7
Non-attention 2.08 ± 1.02 18.6 ± 5.8
A2
Attention 4.29 ± 1.44 18.8 ± 4
Non-attention 2.19 ± 0.62 17.7 ± 1.9
A3
Attention 2.06 ± 0.30 16.1 ± 1.5
Non-attention 1.69 ± 0.19 12.5 ± 0.8
A4
Attention 2.91 ± 0.66 10.7 ± 2.5
Non-attention 4.63± 1.67 11.4± 2.0
B2
Attention 2.2 ± 0.60 12.4 ± 1.8
Non-attention 5.0 ± 2.14 7.8 ± 2.8
B3
Attention 2.0 ± 0.46 11.0 ± 1.3
Non-attention 2.6 ± 0.62 11.0 ± 2.5
mainly in the attention trials in session 3. Participants
A4 and B3 behaved differently; they did not fulfill the
goals since many of their results in the attention tri-
als were below the threshold and many of those in the
non-attention trials were above it. However we should
remark that for these two subjects in each session, the
median values in the attention trials were higher than
in the non-attention ones. Participant B2 performed
similarly to A4 and B3 in the last three sessions. In the
A Hardware/Software Platform to Acquire Bioelectrical Signals. A Case Study: Characterizing Computer Access through Attention
81
others, the subject’s attention level was almost always
above the threshold with non-attention mean values
higher than those in attention trials. Anyway, it seems
to be plausible to set a threshold, different to the 50%,
which should be adjusted session by session.
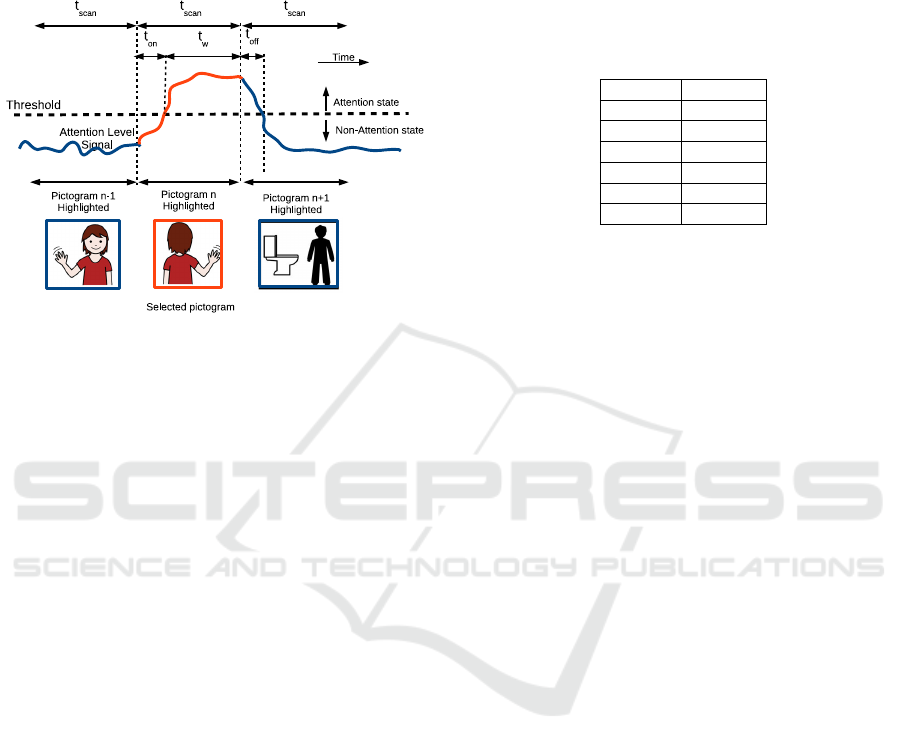
Figure 10: Temporal parameters and their relationship with
scanning period. T
scan
≥ t
w
+ t
on
to select one pictogram
and t
w
also has to be greater than t
o f f
(t
w
> t
o f f
) so as not
to select the following pictogram.
Initial time
¯
t
i
and sustained time
¯
t
s
are related to the
time needed to select a pictogram on a communicator
board, when accessing a computer by changing the at-
tentional state. Firstly, a threshold establishes the bor-
der between these two states, so a subject who wants
to select a pictogram has to exceed such a threshold
for a time. The time
¯
t
i
in attention trials (t
on
) shows
the average time to cross such a threshold and reach
the attention state. In the same way, the time
¯
t
i
in non-
attention trials (t
o f f
) shows the time taken to go back
to the non-attention state. In between them, the at-
tention level must be kept high for t
w
seconds so that
the system can detect the user’s intention (see Figure
10). The dwell time or scanning period t
scan
depends
on such temporal parameters. For example, partici-
pant A1 took t
on
=2.48s to move from ’resting’ to the
attentional state and t
o f f
=2.08s to come back again.
This means the scanning period, t
scan
has to be greater
than 2.48s (Eq. 2) on average and the t
w
greater than
2.08s to avoid selecting the pictogram next to the pre-
selected one (Eq. 3). The selection time, t
w
is also
related to sustained time,
¯
t
s
, as the latter sets the up-
per limit for the former. Table 1 shows that all partici-
pants were not able to maintain their attention state for
more than 10.7s in group A or 11s in group B, which
could be a constrain to the number of pictograms on
the screen. Increasing t
w
could also be a solution to
the lack of control for low attentional values to reduce
the number of false selections.
t
scan
≥ t
on
+t
w
(2)
t
o f f
< t
w
≤
¯
t
s
(3)
Minimal t
scan
can be estimated by approximating
t
w
≈ t
o f f
, so t
scan
≈ t
on
+ t
o f f
whereas t
w
≤
¯
t
s
. Ac-
cording to Table 1, all users comply with Eq. 3. The
minimal t
scan
is shown in Table 2.
Table 2: Minimal t
scan
according to Eq.2, Eq. 3 and Table
1.
Subject t
scan
(s.)
A1 4.96
A2 6.48
A3 3.75
A4 7.54
B2 7.2
B3 4.6
7 CONCLUSIONS AND FUTURE
WORK
This study shows that not all participants were able to
manage their attentional state well enough. Three par-
ticipants from group A and one from B were not able
to start the phase 2 (40%) after 150 min of training.
For the rest of participants, the control of attention
to access a computer is possible, with an average t
scan
equal to 5.76s, although further research is needed.
One improvement will come from setting a classifier
to discriminate between two attentional states, which
allows to automatically set the threshold and increase
the accuracy in classifying. Processing the raw sig-
nal, will also let us include other kind of algorithms
to detect the attention. In this sense, discarding EEG
segments containing artifacts is important for obtain-
ing power bands correctly. We know that when peo-
ple with disabilities used the EEG sensor, lot of arti-
facts where recorded due to the amount of involuntary
movements the participants of group B showed. We
do not know whether the Neurosky’s proprietary al-
gorithm rejects these contaminated segments.
Eventually, including other signals and psycho-
logical tests, will give us information of how tiring
this kind of method of access a computer is, espe-
cially, for people with disabilities.
ACKNOWLEDGEMENTS
The authors would like to thank the staff of ASPACE,
in particular Nacho Silva for his support in the re-
alization of this work and the anonymous reviewers
who helped us improve this document with their com-
ments.
PhyCS 2017 - 4th International Conference on Physiological Computing Systems
82

REFERENCES
Barkley, R. A. (1997). Behavioral inhibition, sustained at-
tention, and executive functions: constructing a unify-
ing theory of adhd. Psychological bulletin, 121(1):65.
Chen, C.-Y., Wang, C.-J., Chen, E.-L., Wu, C.-K., Yang,
Y. K., Wang, J.-S., and Chung, P.-C. (2010). Detecting
sustained attention during cognitive work using heart
rate variability. In Intelligent Information Hiding and
Multimedia Signal Processing (IIH-MSP), 2010 Sixth
International Conference on, pages 372–375. IEEE.
Das, R., Chatterjee, D., Das, D., Sinharay, A., and Sinha,
A. (2014). Cognitive load measurement - a methodol-
ogy to compare low cost commercial eeg devices. In
Advances in Computing, Communications and Infor-
matics (ICACCI, 2014 International Conference on,
pages 1188–1194.
Gevins, A., Smith, M. E., McEvoy, L., and Yu, D. (1997).
High-resolution eeg mapping of cortical activation re-
lated to working memory: effects of task difficulty,
type of processing, and practice. Cerebral cortex,
7(4):374–385.
Heidrich, R. O., Jensen, E., Rebelo, F., and Oliveira, T.
(2015). A comparative study: use of a brain-computer
interface (bci) device by people with cerebral palsy
in interaction with computers. Anais da Academia
Brasileira de Ci
ˆ
encias, (AHEAD):0–0.
Hidecker and et al. (2011). Developing and validating the
communication function classification system (cfcs)
for individuals with cerebral palsy. Developmental
Medicine and Child Neurology, 53:704–710.
Lee, J. M., Park, K. S., Lee, Y., Shin, I., and Park, K. S.
(2000). Characterizing eeg during mental activity
using non-linear measures: the more concentration,
the higher correlation dimension. In Engineering
in Medicine and Biology Society, 2000. Proceedings
of the 22nd Annual International Conference of the
IEEE, volume 2, pages 1326–1328 vol.2.
Lubar, J. F. (1991). Discourse on the development
of eeg diagnostics and biofeedback for attention-
deficit/hyperactivity disorders. Biofeedback and Self-
regulation, 16(3):201–225.
McMurrough, C., Ferdous, S., Papangelis, A., Boisselle, A.,
and Heracleia, F. M. (2012). A survey of assistive de-
vices for cerebral palsy patients. In Proceedings of
the 5th International Conference on PErvasive Tech-
nologies Related to Assistive Environments, page 17.
ACM.
Medine, D. (2016). Labstreaminglayer,
https://github.com/sccn/labstreaminglayer/wiki.
Merino, M., G
´
omez, I., and Molina, A. J. (2014). Stress and
heart rate: Significant parameters and their variations.
Experimental and Clinical Cardiology, pages 3409–
3517.
Mill
´
an, J. d. R., Rupp, R., M
¨
uller-Putz, G. R., Murray-
Smith, R., Giugliemma, C., Tangermann, M., Vidau-
rre, C., Cincotti, F., K
¨
ubler, A., Leeb, R., et al. (2010).
Combining brain–computer interfaces and assistive
technologies: state-of-the-art and challenges. Fron-
tiers in neuroscience, 4.
Mu
˜
noz, J. E., Lopez, D. S., Lopez, J. F., and Lopez, A.
(2015). Design and creation of a bci videogame to
train sustained attention in children with adhd. In
Computing Colombian Conference (10CCC), 2015
10th, pages 194–199. IEEE.
Nicolas-Alonso, L. F. and Gomez-Gil, J. (2012). Brain
computer interfaces, a review. Sensors, 12(2):1211.
Palisano, R., Rosenbaum, P., Bartlett, D., and Livingston,
M. (1997). Development and reliability of a system to
classify gross motor function in children with cerebral
palsy. Dev Med Child Neurol, 39:214–223.
Rebolledo-Mendez, G., Dunwell, I., Mart
´
ınez-Mir
´
on, E. A.,
Vargas-Cerd
´
an, M. D., De Freitas, S., Liarokapis, F.,
and Garc
´
ıa-Gaona, A. R. (2009). Assessing neuroskys
usability to detect attention levels in an assessment ex-
ercise. In Human-Computer Interaction. New Trends,
pages 149–158. Springer.
Rodr
´
ıguez, M., Gim
´
enez, R., Diez, P., Avila, E., Laciar, E.,
Orosco, L., and Correa, A. G. (2013). Playing with
your mind. In Journal of Physics: Conference Series,
volume 477, page 012038. IOP Publishing.
Siamaknejad, H., Loo, C. K., and Liew, W. S. (2014).
Fractal dimension methods to determine optimum eeg
electrode placement for concentration estimation. In
Soft Computing and Intelligent Systems (SCIS), 2014
Joint 7th International Conference on and Advanced
Intelligent Systems (ISIS), 15th International Sympo-
sium on, pages 952–955.
Spinelli, E. M., Martinez, N. H., and Mayosky, M. A.
(2001). A single supply biopotential amplifier. Medi-
cal engineering & physics, 23(3):235–238.
Taelman, J., Vandeput, S., Spaepen, A., and Van Huffel, S.
(2009). Influence of mental stress on heart rate and
heart rate variability. In 4th European conference of
the international federation for medical and biologi-
cal engineering, pages 1366–1369. Springer.
Tyson, P. D. (1987). Task-related stress and eeg al-
pha biofeedback. Biofeedback and Self-Regulation,
12(2):105–119.
Villarejo, M. V., Zapirain, B. G., and Zorrilla, A. M. (2012).
A stress sensor based on galvanic skin response (gsr)
controlled by zigbee. Sensors, 12(5):6075–6101.
Wang, Q. and Sourina, O. (2013). Real-time mental arith-
metic task recognition from eeg signals. Neural Sys-
tems and Rehabilitation Engineering, IEEE Transac-
tions on, 21(2):225–232.
Wang, Q., Sourina, O., and Nguyen, M. K. (2010). Eeg-
based ”serious” games design for medical applica-
tions. In Cyberworlds (CW), 2010 International Con-
ference on, pages 270–276.
Welton, T., Brown, D. J., Evett, L., and Sherkat, N. (2016).
A brain–computer interface for the dasher alternative
text entry system. Universal Access in the Information
Society, 15(1):77–83.
A Hardware/Software Platform to Acquire Bioelectrical Signals. A Case Study: Characterizing Computer Access through Attention
83
