
Learning to Predict the Stock Market Dow Jones Index Detecting and
Mining Relevant Tweets
Giacomo Domeniconi, Gianluca Moro, Andrea Pagliarani and Roberto Pasolini
DISI, Universit
`
a degli Studi di Bologna, Via Venezia 52, Cesena, Italy
Keywords:
Stock Market Prediction, Dow Jones Trend, Text Mining, Noise Detection, Twitter.
Abstract:
Stock market analysis is a primary interest for finance and such a challenging task that has always attracted
many researchers. Historically, this task was accomplished by means of trend analysis, but in the last years
text mining is emerging as a promising way to predict the stock price movements. Indeed, previous works
showed not only a strong correlation between financial news and their impacts to the movements of stock
prices, but also that the analysis of social network posts can help to predict them. These latest methods
are mainly based on complex techniques to extract the semantic content and/or the sentiment of the social
network posts. Differently, in this paper we describe a method to predict the Dow Jones Industrial Average
(DJIA) price movements based on simpler mining techniques and text similarity measures, in order to detect
and characterise relevant tweets that lead to increments and decrements of DJIA. Considering the high level of
noise in the social network data, we also introduce a noise detection method based on a two steps classification.
We tested our method on 10 millions twitter posts spanning one year, achieving an accuracy of 88.9% in the
Dow Jones daily prediction, that is, to the best our knowledge, the best result in the literature approaches based
on social networks.
1 INTRODUCTION
The spread of social networks and micro blogging
enables people to share opinions and moods, creat-
ing very large and constantly updated textual corpora.
Sentiment Analysis techniques seek to extract emo-
tional states or opinions expressed in each text docu-
ment and create a collective social emotional state.
Can the trend of social emotional state predict the
macroscopic evolution of global events such as some
economic indicators? Recent studies have answered
affirmatively to this question. In particular, (Liu et al.,
2007) using a Probabilistic Latent Semantic Anal-
ysis (pLSA) model extracts sentiment indicators on
blogs that predict future sales, (Mishne and de Rijke,
2006) shows how through assessments of blog sen-
timents can predict the movie sales; similarly (Asur
and Huberman, 2010) shows how public sentiments
on movies expressed on Twitter can actually predict
box office receipts. (Gruhl et al., 2005) tests the pre-
dictability of books sales using online chat activities.
But all that glitters ain’t gold: (Gayo-Avello, 2012)
This work was partially supported by the european
project “TOREADOR” (grant agreement no. H2020-
688797).
criticises some literature on this topic, showing results
that are in fact unpredictable, for instance the predic-
tion of election. Of course analyses of tweets can help
to understand the political popularity, but can not con-
sistently predict the results so far.
In this work we experiment the prediction of the
Dow Jones Industrial Average (DJIA) from Twitter
messages. For obvious reasons, the ability to predict
the stock market trends has historically attracted inter-
est from shareholders as well as academia. Efficient
Market Hypotesis (EHM) proposed in (Fama, 1965)
states that prices of financial assets are managed by
rational investors who rely on new information, i.e.
news, and not by present or past prices; since news
are not predictable, neither is the stock market, which,
according to past studies (Kimoto et al., 1990; Fama,
1991), follows in general a random walk trend. How-
ever, (Malkiel, 2003) confutes the EMH, providing
evidences that market prices reflect all the available
information. Moreover, several studies show that the
trend of the stock market does not follow a random
walk model and can be predicted in some way (Lo and
MacKinlay, 1988; Butler and Malaikah, 1992), in-
cluding, for example, with mining techniques applied
to market news (Gid
´
ofalvi and Elkan, 2001; Schu-
Domeniconi G., Moro G., Pagliarani A. and Pasolini R.
Learning to Predict the Stock Market Dow Jones Index Detecting and Mining Relevant Tweets.
DOI: 10.5220/0006488201650172
In Proceedings of the 9th International Joint Conference on Knowledge Discovery, Knowledge Engineering and Knowledge Management (KDIR 2017), pages 165-172
ISBN: 978-989-758-271-4
Copyright
c
2017 by SCITEPRESS – Science and Technology Publications, Lda. All rights reserved

maker and Chen, 2006) or to past prices (Li et al.,
2011) or even to financial reports (Lin et al., 2008).
Recently several works have studied the correla-
tion between sentiments extracted from Twitter and
socio-cultural phenomena (Bollen et al., 2011a), such
as the popularity of brands (Ghiassi et al., 2013), and
also the correlation between public mood in Twitter
and the DJIA trend (Bollen et al., 2011b).
Differently from previous works that predict DJIA
by computing people sentiments or moods from their
twitter opinions, we introduce a simpler method based
on mining techniques and text similarity measures for
the characterisation and detections of relevant tweets
with respect to increments or decrements of DJIA. In
particular, as far as the selection of tweets is con-
cerned, our method includes a noise detection ap-
proach in short textual messages in order to filter out
irrelevant tweets in predicting DJIA. As discusses in
Section 2, there is a large literature regarding the de-
tection of noise in data mining and especially in data
clustering; various methods have also been applied to
text mining, generally for the recognition of noisy fea-
tures (Samant and Rao, 2011) or for novelty detection
(Markou and Singh, 2003), i.e. the discovery of un-
known data that a machine learning system has not
been trained with.
In this work we employed the same set of ten mil-
lions tweets posted in 2008 used by (Bollen et al.,
2011b), but with a much smaller training set in or-
der to assess our method more reliably with a wider
test set. Intuitively, our method is based on train-
ing an intermediate classifier on five millions tweets
posted in the first seven months of the 2008. By
analysing the results of this classification, we create
a pruning scheme based on four goodness groups of
tweets, namely true and false positives and true and
false negatives, depending on the outcome of the clas-
sification. We subsequently transform the training set
by removing irrelevant tweets considered noise. This
technique has been applied at two level: both to in-
dividual tweets and to aggregations of them, which
correspond to actual instances of the training set.
The paper is organized as follows. Section 2 anal-
yses literature about stock market prediction based
on news, social network analyses and noise detection
methods. Section 3 explains the data considered, the
Vector Space Model construction and the noise de-
tection technique. Section 4 describes and compares
experiments with other works showing our results im-
proves the best existing outcomes we found among
social network based prediction approaches. Finally,
Section 5 sums results up and outlines future work.
2 RELATED WORK
Stock market analysis and prediction has always re-
ceived great interest by the academic world: several
possible approaches have been proposed, from time
series prediction to textual news analysis, until arriv-
ing to the social networks analysis. We start from
classic stock market prediction approaches, then we
summarize the most recent works using social net-
work information to forecast the market prices. Fi-
nally, we analyze the most known noise detection
methods proposed in literature.
Both academia and practitioners worked to the
prediction of stock prices by analysing the underly-
ing dynamics of financial markets. Initially, the sci-
entific researches were based on the Efficient Mar-
ket Hypothesis (EMH) (Fama, 1965) according to
which prices of traded assets reflect all relevant infor-
mation available at any time. In such financial mar-
ket model, neither technical prediction analysis of fu-
ture prices based on the study of past prices, nor fun-
damental analysis studying the evolution of the busi-
ness value, allows an investor to achieve higher prof-
its than those that another investor would get with a
portfolio of stocks selected randomly, with the same
degree of risk. However, in the last decades a great
amount of works refused the unpredictability hypoth-
esis (Malkiel, 2003; Qian and Rasheed, 2007) show-
ing that stock price series follow the random walk the-
ory only in a short period of time and consequently
arguing that in general they could be predicted.
Two major approaches to stock market prediction
exist: using features derived from technical analysis
based on the history of stock index prices and us-
ing related news and textual information to predict
trends. Surveys about the two approaches are given
in (Atsalakis and Valavanis, 2009) and (Mittermayer
and Knolmayer, 2006) respectively. Other researches
employ blog posts to predict stock market behaviour
by determining correlation between activities in In-
ternet message boards and stock volatility and trad-
ing volumes (Antweiler and Frank, 2004). (Gilbert
and Karahalios, 2010) create an index of the US na-
tional mood, called Anxiety Index, by exploiting over
20 million posts from the LiveJournal website: when
this index increased significantly, the S&P 500 ended
the day marginally lower than expected. A compar-
ative survey of artificial intelligence applications in
finance is reported in (Bahrammirzaee, 2010).
Twitter represents a huge knowledge base provid-
ing information about the most disparate topics. It
can be argued that this knowledge base can provide
an indication on the public mood. In fact the emo-
tional state, as the prerogative of a single human be-

ing, propagates to social status as a feature of all of the
individuals. This phenomenon is studied by (Bollen
et al., 2011a): authors find that events in the social,
political, cultural and economic sphere do have a sig-
nificant, immediate and highly specific effect on the
various dimensions of public mood extracted from
Twitter. They speculate that large scale mood anal-
ysis can provide a solid platform to model collective
emotive trends in terms of their predictive value with
regards to existing social as well as economic indica-
tors. This predictive feature of Twitter mood has been
used for forecasting different phenomenons, like the
sales of a movie (Asur and Huberman, 2010), the pub-
lic opinion on a particular brand (Ghiassi et al., 2013)
and so on.
Unlike the proposal of this paper, many of the ap-
proaches in literature apply sentiment analysis tech-
niques to tweets to create forecast models. (Bollen
et al., 2011b) measure collective mood states (posi-
tive, negative, calm, alert, sure, vital, kind and happy)
through sentiment analysis applied to more than 9
million tweets posted in 2008. Tweets are filtered
by some generic sentiment expressions (e.g. “I’m
feeling”) not directly related to stock market. They
analyse tweets by two mood tracking tools: Opin-
ion Finder (OF, (Wilson et al., 2005)) that classi-
fies tweets as positive or negative, and Google-Profile
of Mood States (GPOMS) that measure mood in
the other 6 dimensions. They found that the calm
mood profile yields the best prediction result for Dow
Jones Industrial Average (DJIA) with an accuracy of
86.7% in the prediction of the daily directions in the
month of December, moreover they also show how
a tweet aggregation in a 3-day period ensures better
prediction on the daily DJIA. Similarly, (Chyan and
Lengerich, 2012) use the calm score of tweets extracts
from June and December 2009, achieving an accuracy
of 75% in 20-day test of prediction of Dow Diamonds
ETF (DIA). They increase the accuracy up to 80% by
adding a quantitative feature related to the previous
value of the DIA.
Another similar analysis of (Bollen et al., 2011b)
is made by (Mittal and Goel, 2012), where the same
dataset of (Chyan and Lengerich, 2012) is used in
a multi-class classification, considering only calm,
happy, alert and kind mood dimensions. Further-
more, 4 different learning algorithms (i.e. Linear Re-
gression, Logistic Regression, SVMs and SOFNN)
are used to learn and exploit the actual predictions;
SOFNN based model performed best among all other
algorithms, giving nearly 76% of accuracy. A com-
parison of six different and popular sentiment analysis
lexical resources (Harvard General Inquirer, Opinion
Lexicon, Macquarie Semantic Orientation Lexicon,
MPQA Subjectivity Lexicon, SentiWordNet, Emoti-
cons) to evaluate the usefulness of each resource in
stock prediction is done by (Oliveira et al., 2013).
(Sprenger et al., 2013) used sentiment analysis on
stock related tweets collected during a 6-month pe-
riod. To reduce noise, they selected tweets contain-
ing cashtags ($) of S&P 100 companies. Each mes-
sage was classified by a Na
¨
ıve Bayes method trained
with a set of 2500 tweets. Results showed that senti-
ment indicators are associated with abnormal returns
and message volume is correlated to the trading vol-
ume. Similarly, (Rao and Srivastava, 2012) associate
a polarity to each day considering the number of posi-
tive and negative tweets via sentiment140
1
, testing the
DJIA and NASDAQ-100 index in a 13-month period
between 2010 and 2011. (Mao et al., 2011) surveyed
a variety of web data sources (Twitter,news headlines
and Google search queries) and tested two sentiment
analysis methods used for the prediction of stock mar-
ket behavior, finding that their Twitter sentiment in-
dicator and the frequency of financial terms occur-
rence on Twitter are statistically significant predictors
of daily market returns.
There are several approaches that do not use di-
rectly the sentiment analysis to make predictions. For
example (Mao et al., 2012) analyse with linear regres-
sion model the correlation between the Twitter pre-
dictor and stock indicators at three levels (stock mar-
ket, sector and single company level) and find that
the daily number of tweets that mention S&P 500
stocks is significantly correlated with S&P 500 daily
closing price. They obtain in a 19-day test an accu-
racy of 68% for Stock Market and sector level pre-
diction and of 52% for company stock. (Porshnev
et al., 2013) create different types of features: to a
“basic” data set corresponding to the tweets BoW of
the previous day, they add features regarding the num-
ber of tweets containing the words “worry”, “hope”
or “fear” (Basic&HWF), or the words “happy”, “lov-
ing”, “calm”, “energetic”, “fearful”, “angry”, “tired”
and “sad”(Basic&8emo), training a SVM with these
datasets relating at 7 months of 2013. They get a max-
imum baseline accuracy of 65.17% for the DJIA, 57%
for the S&P 500 and 50.67% for NASDAQ. In a dif-
ferent way, (Ruiz et al., 2012) extract two types of
features, one concerning the overall activity in twitter
and one measure the properties of an induced inter-
action graph. They found a correlation between these
features and changes in S&P 500 price and volume
traded. (Zhang et al., 2011) found a high negative
correlation (0.726, significant at level p < 0.01) be-
tween the Dow Jones index and the presence of the
words “hope”, “fear”, and “worry” in tweets.
1
http://help.sentiment140.com/
A quantitative analysis is made by (Mao et al.,
2013): using Twitter volume spikes in a 15-month
period (from February 2012 to May 2013) they train
a Bayesian classifier to assist S&P 500 stock trading
and they show that it can provide substantial profit.
(Arias et al., 2014) through extensive testing shows
that adding Twitter-related data (either in term of vol-
ume or public sentiment) to in non-linear time series
(SVMs or neural networks) will improve the predic-
tions of stocks or indexes.
Noise detection is a topic of interest since the
dawn of information retrieval. In the Vector Space
Model representation, the noise removal can be ad-
dressed at two levels. At feature level useless and
non-informative words are removed: normally this
problem is addressed with a lists of stopwords and
feature selection schemes (Yang, 1995; Gabrilovich
and Markovitch, 2004). At instance level are instead
removed non-informative documents, which could be
source of confusion for the classification model. Here
can be ideally used the various noise detection tech-
niques proposed in IR, without considering the textual
nature of the single features. There exist in literature
a large amount of proposed methods, for example us-
ing K-nearest neighbors approach, neural networks,
decision trees, SVM or bayesian networks. In-depth
descriptions of all of these techniques have been re-
ported in surveys as (Chandola et al., 2009; Markou
and Singh, 2003).
3 METHODOLOGY
3.1 Benchmark Text Set
To obtain a comparative evaluation than the well-
known work of (Bollen et al., 2011b), we use the
same collection of tweets: that is about 10 million
tweets posted from January 1th to December 19th of
2008, by approximately 2.7M users. Following the
pre-processing applied by Bollen et al., only tweets
in english language that contain explicit statements
of the author’s mood state are taken into considera-
tion, i.e. those that contains one of this expressions
“i fell”, “i am feeling”, “i’m feeling”, “i dont feel”,
“I’m”, “Im”, “I am”, and “makes me”. Tweets that
contain links or that address the tweet content to an-
other user are removed. All tweets are tokenized in
single words and, as done by (Oliveira et al., 2013),
also the emoticons are considered into our model us-
ing three different tokens.
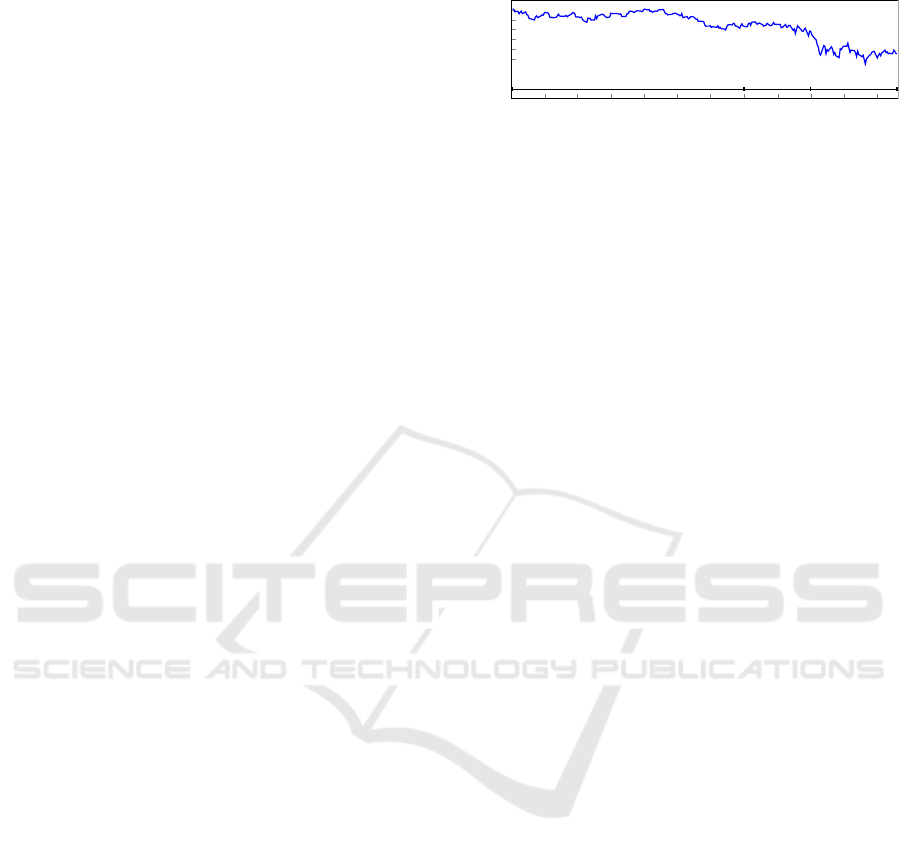
Figure 1 shows the daily closing values of DJIA.
To properly evaluate the models’ ability in the predic-
tion of DJIA prices, we split the benchmark set into i)
Jan Feb Mar Apr May Jun Jul Aug Sep Oct Nov Dec
8,000
9,000
10,000
11,000
12,000
13,000
14,000
training
test
validation
DJIA daily closing values
Figure 1: Daily closing values of the DJIA prices and split
of the benchmark set.
a training set with the first seven months of the year
(from January 2 to July 31) to create the prediction
models; ii) a test set with two months, August and
September, with which we tune the models and apply
the noise detection; iii) finally a validation set with
the latest three months, from October 1st to Decem-
ber 19th, larger than the work of Bollen et al, which
refers to only 19 days of December and consequently
to only 15 days of opening stock market.
3.2 Vector Space Model Construction
Tweets are grouped according to the publication date
and will provide the information base to generate fu-
ture predictions on the stock market. As shown by the
experiments of Bollen et al, the higher correlation be-
tween social mood and the DJIA is obtained by group-
ing tweets of several days and shifting the prediction
for a certain time lag. Thus it becomes interesting to
evaluate the accuracy of the predictions considering
these two parameters in the forecasting model:
• Lag (l): temporal translation from the forecast
date, l = 0 means the day before the prediction.
• Aggregation (a): number of days to be aggregated
to make a prediction, a = 0 means only one day.
As a simple example, assume that we consider l = 1
and a = 2, to make the prediction on day t will be con-
sidered tweets published in the days t − 2, t − 3 and
t − 4. The range of days considered for the prediction
of day t will be: [t −1 − l − a,t − 1 − l].
According to the two previous parameters, all the
tweets related to the prediction of a day (in the previ-
ous example, all tweets of t − 2, t − 3 and t − 4) are
collected in a single Bag-of-Words. Given the high
number of tweets available, a dimensionality reduc-
tion is required. Once selected the tweets, stop-words
are removed and a stemming process is performed,
each term is then weighted using the common tf.idf
(Domeniconi et al., 2016). Finally, a number n
f
of
them, with greater weight, are selected.
The proposed DJIA prediction process is summa-
rized in Figure 2.

Figure 2: Diagram of the DJIA prediction process through
tweets aggregation. In this example the system predicts
the DJIA trend for 28/03/2008 using the aggregated tweets
posted in the previous four days (l = 0 and a = 3).
3.3 Noise Detection
Twitter provides a great deal of information, but is
necessary to understand what is useful for a given
analysis and what is not. Considering this, we pro-
pose a noise detection method to define what tweets
to use in the DJIA prediction model. Our idea can be
summarised in few steps:
1. Once created the representation of the data, as de-
scribed in the previous section, we train a classifi-
cation model and we apply it on the test set.
2. We create four prototypes, one for each possi-
ble outcome of the classification, i.e. true posi-
tive (TP), predicted days, true negative (TN), false
positive (FP) and false negative (FN). Each proto-
type is a BoW merging all the instances of the test
set, i.e. all the tweets of the a days before each
prediction.
3. We use prototypes to discover the noisy tweets in
the dataset. We propose to apply this method at
two different levels: i) a tweet level: removing
from the dataset all the tweets with cosine similar-
ity less than a threshold τ
g
with respect to the good
prototypes (TP and TN) or greater then a thresh-
old τ
b
with respect to the bad prototypes (FP and
FN); ii) a instance level: removing from the train-
ing set instances similar to the bad prototypes.
4. With the cleaned data set we train a new predic-
tion model using the training and test set and we
use it to classify the validation set.
4 RESULTS
We tested the effectiveness of the prediction varying
i) the classification algorithm, we tested two different
supervised models using the Weka
2
implementation:
Decision tree (the J48 C4.5) and SVM (the SMO al-
gorithm), ii) the number n
f
of features (i.e. words)
2
www.cs.waikato.ac.nz/ml/weka/
Table 1: Results obtained in tuning the Decision Tree algo-
rithm.
Aggr Lag n
f
feat fMeasure
3 0 500 0.799
3 1 2000 0.736
3 0 1000 0.700
0 2 500 0.668
0 2 2000 0.660
2 2 500 0.657
3 2 2000 0.653
Table 2: Results obtained in tuning the SVM algorithm.
Aggr Lag n
f
feat fMeasure
2 1 1000 0.682
1 2 2000 0.668
3 2 1000 0.649
2 1 2000 0.649
1 3 2000 0.643
0 2 2000 0.642
2 1 500 0.642
selected in the dataset, iii) the aggregation a and iv)
the lag l parameters on the data cited above.
Before the application of the noise detection
method, we tested a simple prediction model based
on the VSM built as described in Section 3.2, varying
the parameters in order to discover the best tuning of
them. Tables 1 and 2 show the best results obtained
by the two supervised algorithms with the related pa-
rameters combination. A first noteworthy aspect is
the aggregation parameter, that gives best results with
three days gathered, this confirms the analysis done
by Bollen at al. in their work, in which authors ob-
tain the same consideration. This means that there
is a strong correlation between the information ex-
tracted in a couple of days before and the outcome of
a market trading day. In other words, the stock market
seems to be affected to the information, and thus event
or moods and so on, of the previous days. Moreover,
it is evident the best accuracy obtained by the Deci-
sion tree model, that with few features required (just
500), achieves a f-Measure almost of 80%. From now
on, every test is performed using the best combination
of parameters shown in Table 1 and 2.
Once defined the best model, we applied the noise
detection method in order to clean the dataset. The
idea is to analyze the predictions made on the test set
in order to define four groups of predictions and use
those to find only the useful tweets, or aggregations
of tweets, in the dataset.
First, we divided the test set instances based on
the outcome of the predictions. Among all the tested
instances, we selected only the predictions with the
probability given by the classifier greater than 90%, in
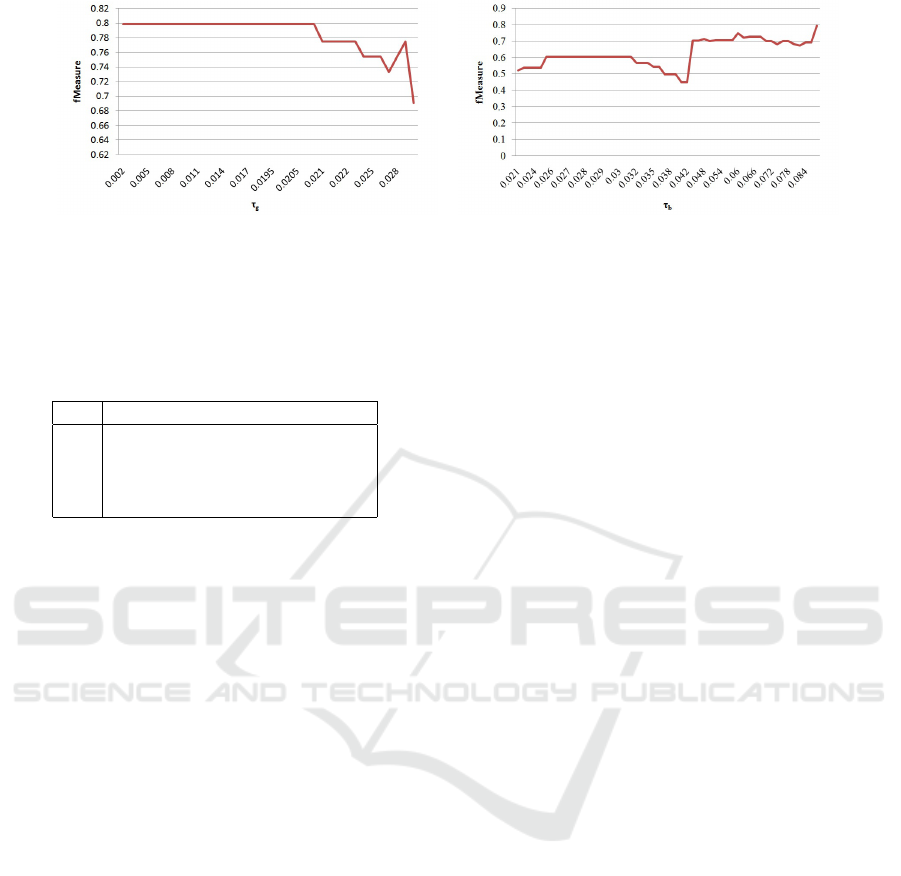
(a) Mantaining tweets similar to the good prototypes. (b) Discarding tweets similar to the bad prototypes.
Figure 3: Tweets level noise detection experiments.
Table 3: Comparison with cosine similarities between in-
stances (aggregated tweets) belonging to the different four
groups. Each cell of the table is calculated as average value
of the comparison of all the related couples of instances.
TP TN FP FN
TP 0.819 0.828 0.779 0.772
TP 0.823 0.914 0.776 0.738
FP 0.779 0.776 0.848 0.770
FN 0.772 0.738 0.77 0.912
order to pull out only the surest among them. These
selected instances are then grouped based on the out-
come (i.e. TP, TN, FP, FN). In order to assess the
assumptions and the quality of the groupings made,
we calculated the cosine similarity between both in-
stances of the same group and belonging to different
groups; we expected that the instances belonging to
the same group should have a high similarity, while
should appear dissimilarities comparing instances of
different groups. These comparisons are shown in
the Table 3; the main diagonal contains the compar-
isons between instances belonging to the same group,
noteworthy is that these similarities are significantly
greater than the other comparisons and this supports
our hypothesis underlying the noise detection method.
The first noise detection experiment has been
made comparing all the single tweets in the dataset
(both training and validation sets) with the four pro-
totypes created aggregating the instances of the four
groups of predictions analyzed above. We conducted
a double experiment: i) keeping only the tweets simi-
lar to the two good prototypes, i.e. tweets whose co-
sine similarity with respect to TP or TN overcomes a
threshold τ
g
; ii) discarding all the tweets similar to
the bad prototypes, i.e. tweets whose cosine similar-
ity with respect to FP or FN overcomes a threshold
τ
b
. Figure 3 shows the obtained results in both ex-
periments, varying the thresholds. Unfortunately, the
results do not show an improving trend by using this
noise detection technique.
A further proposal to detect and remove noise is
based on idea of that some training instances could
compromise the accuracy of the prediction model, as
outliers or simply containing noisy tweets. In this ex-
periment, we remove in the training set of the final
classification model all the instances that are similar
to the bad prototypes and thus could negatively af-
fect the model. Figure 4 shows the results obtained
with the best tuning using both a decision tree and a
SVM algorithm, varying the threshold τ in the noise
detection algorithm. Results show a noteworthy im-
provement using the noise detection method. In par-
ticular, using the Decision tree algorithm, we achieve
a f Measure = 0.889 that is an improvement of 10%
with respect to the results obtained in tests without the
training set cleaning techniques. Similar considera-
tions can be done when using a SVM classifier; in this
case the improvement is even greater, since we started
from a f Measure = 0.682 and, with an improvement
of 27%, we obtain a maximum of f Measure = 0.867
when using the noise detection algorithm. By analyz-
ing the results obtained by the best model, we found
a f Measure related to the prediction of the positive
market day of 0.848 and to the negative day of 0.912.
The precision of the predictions in the validation set
is 88.9%, that is higher than the precision obtained by
Bollen at al. in their work, i.e. 86.7%.
A real comparison with the work of Bollen et
al. can be done considering the same testset of their
works, i.e. considering the 19 trading days in De-
cember 2008. Using this test set and training our
method with the first 11 months of the year, we ob-
tain a perfect classification (100%) of the 19 trading
days, showing a sharp improvement with respect to
the 86.7% obtained by Bollen et al.
5 CONCLUSION
In this paper, we have investigated whether the DJIA
trend in a trading day is affected by the contents of
tweets posted in the previous days. This correlation
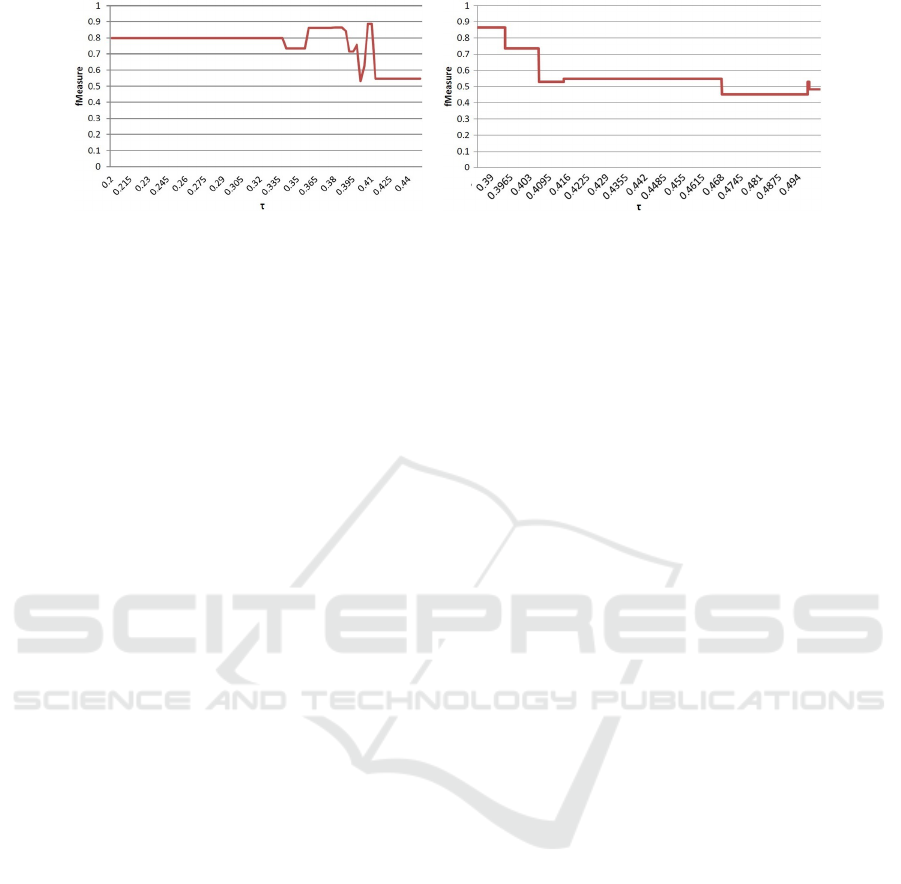
(a) Decision tree supervised model. (b) SVM supervised model.
Figure 4: Instance level noise detection experiments.
was already shown in some works in literature that use
complex techniques to try to understand the semantic
content of the textual documents in order to predict
the stock market trends.
The aim of our work was to use a simple method,
based on the well-known Vector Space Model repre-
sentation and a supervised classifier. We have also
introduced a noise detection technique, both at tweets
and instances (i.e. aggregation of tweets) level, used
to filter out from the data the large irrelevant corpus
of tweets retrieved. We have tested and compared the
method on the same tweets dataset and DJIA trends in
the whole 2008 used by (Bollen et al., 2011b). Results
shows that even a simple classification model based
on the VSM achieves a good accuracy very close to
80%. This work have also demonstrated that our noise
detection technique is able to distinguish the irrele-
vant tweets and instances, thus noise, in the training
data, leading the accuracy to 88.9%, outperforming
both our base classifier and the best prediction method
based on social network posts illustrated in (Bollen
et al., 2011b).
As future works we plan to further investigate pos-
sible correlations among different market indexes and
stock options expanding the analysis to other sources
of unstructured text streams.
REFERENCES
Antweiler, W. and Frank, M. Z. (2004). Is all that talk
just noise? the information content of internet stock
message boards. The Journal of Finance, 59(3):1259–
1294.
Arias, M., Arratia, A., and Xuriguera, R. (2014). Forecast-
ing with twitter data. ACM Trans. Intell. Syst. Tech-
nol., 5(1):8:1–8:24.
Asur, S. and Huberman, B. A. (2010). Predicting the future
with social media. In Web Intelligence and Intelligent
Agent Technology (WI-IAT), 2010 IEEE/WIC/ACM
International Conference on, volume 1, pages 492–
499. IEEE.
Atsalakis, G. S. and Valavanis, K. P. (2009). Surveying
stock market forecasting techniques–part ii: Soft com-
puting methods. Expert Systems with Applications,
36(3):5932–5941.
Bahrammirzaee, A. (2010). A comparative survey of ar-
tificial intelligence applications in finance: artificial
neural networks, expert system and hybrid intelli-
gent systems. Neural Computing and Applications,
19(8):1165–1195.
Bollen, J., Mao, H., and Pepe, A. (2011a). Modeling pub-
lic mood and emotion: Twitter sentiment and socio-
economic phenomena. In ICWSM.
Bollen, J., Mao, H., and Zeng, X. (2011b). Twitter mood
predicts the stock market. Journal of Computational
Science, 2(1):1 – 8.
Butler, K. C. and Malaikah, S. (1992). Efficiency and
inefficiency in thinly traded stock markets: Kuwait
and saudi arabia. Journal of Banking & Finance,
16(1):197–210.
Chandola, V., Banerjee, A., and Kumar, V. (2009).
Anomaly detection: A survey. ACM Comput. Surv.,
41(3):15:1–15:58.
Chyan, T. P. H. H. A. and Lengerich, C. (2012). A stock-
purchasing agent from sentiment analysis of twitter.
Domeniconi, G., Moro, G., Pasolini, R., and Sartori, C.
(2016). A comparison of term weighting schemes for
text classification and sentiment analysis with a super-
vised variant of tf. idf. In Data Management Technolo-
gies and Applications: 4th International Conference,
DATA 2015, Colmar, France, July 20-22, 2015, Re-
vised Selected Papers, volume 584, page 39. Springer.
Fama, E. F. (1965). The behavior of stock-market prices.
The journal of Business, 38(1):34–105.
Fama, E. F. (1991). Efficient capital markets: Ii. The journal
of finance, 46(5):1575–1617.
Gabrilovich, E. and Markovitch, S. (2004). Text categoriza-
tion with many redundant features: Using aggressive
feature selection to make svms competitive with c4. 5.
In Proceedings of the twenty-first international con-
ference on Machine learning, page 41. ACM.
Gayo-Avello, D. (2012). ” i wanted to predict elections with
twitter and all i got was this lousy paper”–a balanced
survey on election prediction using twitter data. arXiv
preprint arXiv:1204.6441.
Ghiassi, M., Skinner, J., and Zimbra, D. (2013). Twitter
brand sentiment analysis: A hybrid system using n-

gram analysis and dynamic artificial neural network.
Expert Systems with Applications.
Gid
´
ofalvi, G. and Elkan, C. (2001). Using news articles to
predict stock price movements. Department of Com-
puter Science and Engineering, University of Califor-
nia, San Diego.
Gilbert, E. and Karahalios, K. (2010). Widespread worry
and the stock market. In ICWSM, pages 59–65.
Gruhl, D., Guha, R., Kumar, R., Novak, J., and Tomkins, A.
(2005). The predictive power of online chatter. In Pro-
ceedings of the eleventh ACM SIGKDD international
conference on Knowledge discovery in data mining,
pages 78–87. ACM.
Kimoto, T., Asakawa, K., Yoda, M., and Takeoka, M.
(1990). Stock market prediction system with modu-
lar neural networks. In Neural Networks, 1990., 1990
IJCNN International Joint Conference on, pages 1–6.
IEEE.
Li, X., Wang, C., Dong, J., Wang, F., Deng, X., and
Zhu, S. (2011). Improving stock market prediction
by integrating both market news and stock prices. In
Hameurlain, A., Liddle, S., Schewe, K.-D., and Zhou,
X., editors, Database and Expert Systems Applica-
tions, volume 6861 of Lecture Notes in Computer Sci-
ence, pages 279–293. Springer Berlin Heidelberg.
Lin, M.-C., Lee, A. J. T., Kao, R.-T., and Chen, K.-T.
(2008). Stock price movement prediction using repre-
sentative prototypes of financial reports. ACM Trans.
Manage. Inf. Syst., 2(3):19:1–19:18.
Liu, Y., Huang, X., An, A., and Yu, X. (2007). Arsa:
a sentiment-aware model for predicting sales perfor-
mance using blogs. In Proceedings of the 30th annual
international ACM SIGIR conference on Research and
development in information retrieval, pages 607–614.
ACM.
Lo, A. W. and MacKinlay, A. C. (1988). Stock market
prices do not follow random walks: Evidence from a
simple specification test. Review of financial studies,
1(1):41–66.
Malkiel, B. G. (2003). The efficient market hypothesis
and its critics. The Journal of Economic Perspectives,
17(1):59–82.
Mao, H., Counts, S., and Bollen, J. (2011). Predicting fi-
nancial markets: Comparing survey, news, twitter and
search engine data. arXiv preprint arXiv:1112.1051.
Mao, Y., Wei, W., and Wang, B. (2013). Twitter volume
spikes: analysis and application in stock trading. In
Proceedings of the 7th Workshop on Social Network
Mining and Analysis, page 4. ACM.
Mao, Y., Wei, W., Wang, B., and Liu, B. (2012). Correlating
s&p 500 stocks with twitter data. In Proceedings of
the First ACM International Workshop on Hot Topics
on Interdisciplinary Social Networks Research, Hot-
Social ’12, pages 69–72, New York, NY, USA. ACM.
Markou, M. and Singh, S. (2003). Novelty detection: a re-
view?part 1: statistical approaches. Signal processing,
83(12):2481–2497.
Mishne, G. and de Rijke, M. (2006). Capturing global mood
levels using blog posts. In AAAI Spring Symposium:
Computational Approaches to Analyzing Weblogs’06,
pages 145–152.
Mittal, A. and Goel, A. (2012). Stock prediction using twit-
ter sentiment analysis.
Mittermayer, M.-A. and Knolmayer, G. (2006). Text mining
systems for market response to news: A survey. Insti-
tut f
¨
ur Wirtschaftsinformatik der Universit
¨
at Bern.
Oliveira, N., Cortez, P., and Areal, N. (2013). Some ex-
periments on modeling stock market behavior using
investor sentiment analysis and posting volume from
twitter. In Proceedings of the 3rd International Con-
ference on Web Intelligence, Mining and Semantics,
WIMS ’13, pages 31:1–31:8, New York, NY, USA.
ACM.
Porshnev, A., Redkin, I., and Shevchenko, A. (2013). Im-
proving prediction of stock market indices by analyz-
ing the psychological states of twitter users. HSE
Working papers WP BRP 22/FE/2013, National Re-
search University Higher School of Economics.
Qian, B. and Rasheed, K. (2007). Stock market predic-
tion with multiple classifiers. Applied Intelligence,
26(1):25–33.
Rao, T. and Srivastava, S. (2012). Twitter sentiment anal-
ysis: How to hedge your bets in the stock markets.
CoRR, abs/1212.1107.
Ruiz, E. J., Hristidis, V., Castillo, C., Gionis, A., and
Jaimes, A. (2012). Correlating financial time series
with micro-blogging activity. In Proceedings of the
Fifth ACM International Conference on Web Search
and Data Mining, WSDM ’12, pages 513–522, New
York, NY, USA. ACM.
Samant, R. M. and Rao, S. (2011). The effect of noise in
automatic text classification. In Proceedings of the In-
ternational Conference & Workshop on Emerging
Trends in Technology, ICWET ’11, pages 557–558,
New York, NY, USA. ACM.
Schumaker, R. P. and Chen, H. (2006). Textual analysis
of stock market prediction using financial news. In
Americas Conference on Information Systems.
Sprenger, T. O., Tumasjan, A., Sandner, P. G., and Welpe,
I. M. (2013). Tweets and trades: The information con-
tent of stock microblogs. European Financial Man-
agement.
Wilson, T., Hoffmann, P., Somasundaran, S., Kessler, J.,
Wiebe, J., Choi, Y., Cardie, C., Riloff, E., and Pat-
wardhan, S. (2005). Opinionfinder: A system for sub-
jectivity analysis. In Proceedings of HLT/EMNLP on
Interactive Demonstrations, pages 34–35. Association
for Computational Linguistics.
Yang, Y. (1995). Noise reduction in a statistical approach to
text categorization. In Proceedings of the 18th annual
international ACM SIGIR conference on Research and
development in information retrieval, pages 256–263.
ACM.
Zhang, X., Fuehres, H., and Gloor, P. A. (2011). Predicting
stock market indicators through twitter ”i hope it is
not as bad as i fear”. Procedia-Social and Behavioral
Sciences, 26:55–62.
