
Can Power Spectral Density (PSD) be used to Measure Reading
Concentration?
Rosita Rahma and Jatmika Nurhadi
Dept. Indonesian Language and Literature Education FPBS, Universitas Pendidikan Indonesia
{rositarahma, jatmikanurhadi}@upi.edu
Keywords: Reading Concentration Power, Open Brain Computer Interface, EEG, PSD.
Abstract: This study aims to measure the concentration power on reading activity based on electroencephalography
(EEG) recording. The concentration is in the beta wave, precisely at the frequency of 15-18Hz. This
research used a qualitative approach. Data were collected using Open Brain Computer Interface and
involved 16 respondents consisting of 8 men and 8 women. The recordings used 4 EEG channels with a
maximum impedance of 15Ω. Data processing used MATLAB based application, EEGLab. Power
concentration measurements used power spectral density (PSD) analysis. PSD can show power spectrum
activity at any frequency. The results of this study indicate the average power spectrum activity in male
respondents showed a higher concentration compared with female respondents and describe differences in
concentration and non-concentration conditions based on brain map patterns. Besides the result, PSD can
also be the alternative method to determine the power of a person's reading concentration more efficiently.
Thus, the opportunity to conduct experiments related to the factors that affect the power of reading
concentration.
1 INTRODUCTION
Reading is an activity that is easy to do, but not a
simple thing. Some experts argue that reading
activity is a very complex and complicated
(McGinnis and Smith, 1982; Soedarso, 2002;
Nurhadi, 2005). It is said complex because the
reading activity involves many factors that are
interconnected with each other. Of the many factors,
concentration power is a factor that is generally
recognized very influential in the process of reading.
Complaints are often conveyed by readers regarding
the difficulty of understanding the reading material
due to the decreasing concentration power during the
reading process. This lack of concentration certainly
affects the reader in understanding the reading
material, so the reading process becomes ineffective.
In fact, the higher the concentration power the more
information is captured from the reading material.
Accordingly, reading concentration plays an
important role in the whole of the reading process
itself, as well as on the absorption of information
received by the reader from his reading.
Measurement of reading concentration power can be
used as an evaluation material to measure how long
it takes a person to stay in optimal condition while
reading.
One way that can be done to measure the power
of concentration is to look at patterns of changes in
brainwaves that are monitored through
electroencephalograph (EEG) sensors. Tatum (2014)
states that the EEG is a unique and valuable
measurement of brain electrical function that
displays graphics of voltage difference from within
two brain function locations recorded over time.
EEG involves the study of recording these electrical
signals generated by the brain.
EEG is commonly used to detect problems in
brain electrical activity that may be associated with
certain brain disorders, for example, including
seizures (such as epilepsy), head injury, encephalitis,
brain tumors, encephalopathy memory problems,
sleep disturbances, and dementia. However, this is
not possible if the EEG is used to measure and
record the electrical activity of the brain outside of
such things, for example in reading activity.
EEG recording is expected to identify the power
of concentration when a person performs reading
activity. This concentration power is determined
based on recorded brain waves, such as delta, theta,
alpha, beta, and gamma. One analysis that might be
450
Rahma, R. and Nurhadi, J.
Can Power Spectral Density (PSD) be used to Measure Reading Concentration?.
DOI: 10.5220/0007169004500453
In Proceedings of the Tenth Conference on Applied Linguistics and the Second English Language Teaching and Technology Conference in collaboration with the First International Conference
on Language, Literature, Culture, and Education (CONAPLIN and ICOLLITE 2017) - Literacy, Culture, and Technology in Language Pedagogy and Use, pages 450-453
ISBN: 978-989-758-332-2
Copyright © 2018 by SCITEPRESS – Science and Technology Publications, Lda. All rights reserved
an alternative in the EEG data processing is to
perform an analysis of the Power Spectral Density
(PSD). PSD is a very useful tool to know
frequencies and amplitudes of oscillatory signals in
the time series data. In line with it, Kusmaryanto
(2013) stated that the PSD to show the amount of
energy per unit based on the frequency and output-
frequency components of different outcomes.
Power spectral density function (PSD) shows the
strength of the variations (energy) as a function of
frequency. In other words, it shows at which
frequencies variations are strong and at which
frequencies variations are weak. The unit of PSD is
energy (variance) per frequency (width) and you can
obtain energy within a specific frequency range by
integrating PSD within that frequency range Cygnus
Research International (2017).
Based on that, this paper will explain how the
use of PSD to measure the concentration of reading
through the data recorded using EEG. Through this
analysis also expected to be found data related to the
measurement result of reading concentration.
Studies on EEG have been widely practiced.
However, a particular study of reading power
concentration has not been done. EEG research
focuses mainly on two things: time scale and Fourier
transform.
The analysis performed to measure EEG data
primarily to measure the strength of electrical
signals at a particular frequency is to use power
spectral density (PSD) analysis. The PSD analysis
uses Fourier transforms rather than time series.
Valipour, Shaligram, and Kulkarni (2014) state that
“the power spectral density (PSD), explain how the
power or energy of a signal is distributed across
frequency”. This term related to Fourier transform.
Hence PSD is frequency domain analysis.
Any physical signal in Fourier transform can be
decomposed into a number of discrete frequencies,
or a spectrum of frequencies over a continuous
range. Xizheng, Ling, and Weixiong (2011) state
that “Fourier transformation have been used to
analyze the pattern of EEG characteristics and non-
transient EEG activity”.
To describe and interpret the results of recording
and measurement of reading concentration power in
this study used two main theories, namely:
neurolinguistics theory and brain wave interpretation
theory. Neurolinguistics theory adapted from Caplan
(1987) and Ingram (2007). Meanwhile, the brain
wave theory was adapted from Stern and Engel,
(2005), and Tatum (2014).
2 METHODOLOGIES
This research uses descriptive method. The elements
described are interpretations of EEG recording
results, including brain wave and brain mapping
through neurolinguistics analysis. Data collection
using Open Brain Computer Interface by utilizing 16
respondents consisting of 8 men and 8 women from
Department of Indonesian Language and Literature
Education.
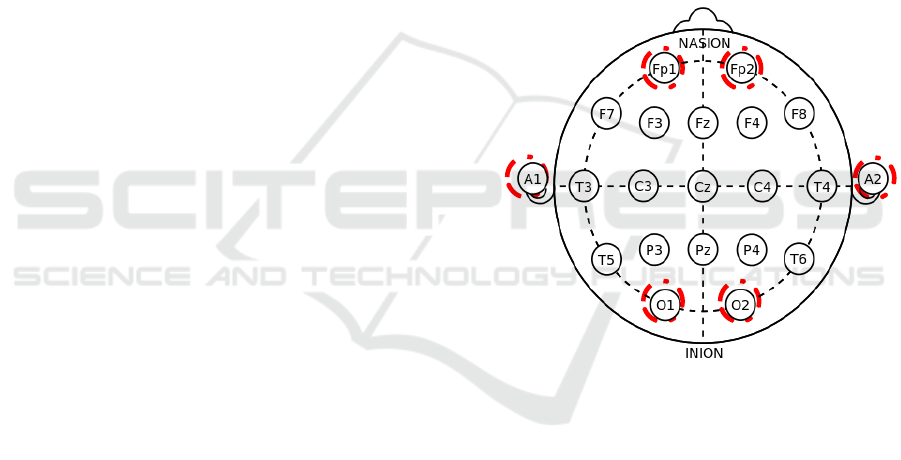
The recordings use 4 EEG channels with a
maximum impedance of 15Ω. Data processing using
MATLAB based application, EEGLab. We record
electrical signals in the brain through electrodes
mounted under 10-20 International System, i.e.
Frontal polar 1 (Fp1), Frontal polar 2 (Fp2),
Occipital 1 (O1), Occipital 2 (O2), Ear 1 (A1) and
Ear 2 (A2) (see figure 1).
Figure 1: 10-20 international system.
The EEG data collection procedure for
describing students' concentration on reading
activity is done through the following steps.
• EEG data recording at the time of reading
activity;
• Numbering on the respondents' EEG
recordings by sex, data collection sequence,
respondent code number, and
• Re-examination of EEG data recording
results.
After the recording process is done, the EEG
data is then interpreted. Raw EEG data is processed
through EEGLab. EEGLab is a toolbox and graphic
user interface running under the cross-platform
MATLAB environment for processing of EEG data
of any number of channels. Raw data is filtered at
15-18Hz, and analyzed through Power Spectral
Density (PSD).
Can Power Spectral Density (PSD) be used to Measure Reading Concentration?
451
3 RESULTS AND DISCUSSION
Measurements of reading concentration power based
on PSD are outlined in three ways: (1) Average PSD
in Reading Activities, (2) Average PSD between
Men and Women, and (3) Correlation between PSD
and Time scale.
3.1 Average PSD in Reading Activities
The recapitulation of power spectrum density
activity calculation at concentration condition during
reading activity is presented in the table 1.
Table 1: Power spectral in reading activities.
Subject
Concentration Freq.
15Hz
16Hz
17Hz
18Hz
L1
2,25
0,90
0,40
-0,10
L2
0,30
-0,10
-0,55
-0,56
L3
4,70
4,40
3,90
3,70
L4
6,60
6,30
5,80
4,25
L5
1,20
0,96
1,03
1,08
L6
11,40
10,30
9,80
8,60
L7
4,90
5,30
5,25
4,25
L8
1,60
2,10
2,50
3,00
P1
-1,15
-1,28
-0,84
-1,00
P2
0,15
-0,40
-0,80
-1,30
P3
1,85
1,30
0,75
0,60
P4
3,70
3,30
2,45
2,80
P5
3,52
3,25
3,15
2,95
P6
-0,15
-0,81
-0,71
-0,65
P7
12,55
12,60
12,10
12,35
P8
5,50
4,95
4,80
4,50
Average
3,68
3,32
3,06
2,78
Based on the table 1, it can be described that
based on the result of the measurement of the
average power spectral density (PSD) in the
frequency range of concentration condition (15-
18Hz) is 3.68 at the frequency of 15Hz, 3.32 at the
frequency of 16Hz, 3.06 at 17Hz frequency and 2.78
at 18Hz frequency. The highest number of PSD in
the range of 15-18Hz is in the subject of P7,
respectively with values of 12.55, 12.60, 12.10, and
12.35. Meanwhile, the lowest number of PSDs in the
range 15-18Hz, is in the subject of P1, which
respectively values -1.15, -1.28, -0.84, and -1.00. If
the PSD value is related to the concentration
duration, it can be shown that the subject with the
highest PSD (subject P7) has the highest
concentration duration. Meanwhile, subjects with the
lowest PSD (subject P1) had the lowest
concentration duration as well.
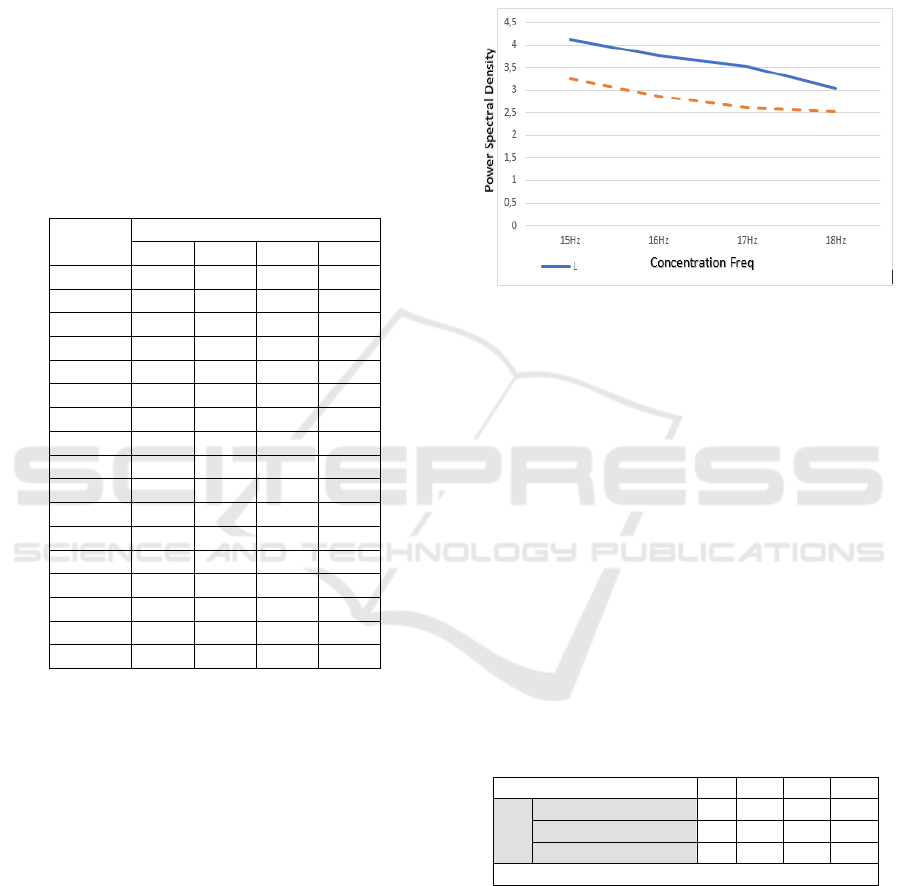
3.2 Average PSD Comparison between
Men and Women
The power spectral activity on reading activity
performed for 15 minutes between male and female
subjects is shown in Figure 2 below.
Figure 2: Average PSD comparison concentration
conditions (15-18Hz) in reading activity between men and
women.
Based on the results of the analysis can be seen
that the average ability of reading concentration in
men is higher than the reading concentration in
women.
3.3 Correlation between PSD and Time
Scale
In understanding the relationship between PSD with
measurement of concentration duration, we can
perform correlation measurement. Here is the
measurement of the correlation between PSD and
time scale. This measurement uses Pearson
Correlation. The results of these calculations are
presented in the table 2.
Table 2: Correlation between PSD and time scale.
PSD
Opt.
Low
Total
PSD
Pearson Correlation
1
0,874
0,145
0,715
Sig. (1-tailed)
0,000
0,296
0,001
N
16
16
16
16
*Correlation is significant at the 0.01 level (1-tailed).
Based on table 2, it can be described that the
PSD analysis on the reading concentration
measurements is positively correlated with the time
scale measurement of the optimal reading
concentration of 0.874. However, the correlation is
low with the measurement of low read time scale
concentrations of only 0.145. Meanwhile, it has a
positive correlation with time scale measurement of
total concentration of 0.715. This shows that the
CONAPLIN and ICOLLITE 2017 - Tenth Conference on Applied Linguistics and the Second English Language Teaching and Technology
Conference in collaboration with the First International Conference on Language, Literature, Culture, and Education
452

measurement of PSD is very appropriate to know the
condition of optimal concentration in reading
activity.
4 CONCLUSIONS
Based on the analysis that has been done, it can be
shown that the power spectral density (PSD)
analysis can be an alternative for measuring the
reading concentration, as well as other
measurements based on a certain frequency or
frequency range. In terms of reading concentration
measurements, the PSD is more appropriate for
measuring the optimal concentration and total
concentration during reading activity. Because it is
suitable for stationary signal measurements, the PSD
will make the duration of EEG measurements more
efficient especially in the measurement of EEG in
bulk quantities.
ACKNOWLEDGEMENTS
The authors are grateful to LPPM UPI for research
funding, to the OpenBCI and Florida Research
Instrument for the quality research equipment, to
EEGLab and EDFBrowser programmer for the open
source of analysing applications, and to all
respondents from Department of Indonesian
Language and Literature Education.
REFERENCES
Caplan, D., 1987. Neurolinguistics and linguistic
aphasiology: An introduction. Cambridge University
Press.
Cygnus Research International, 2017. Power spectral
density function.
Ingram, J.C., 2007. Neurolinguistics: An introduction to
spoken language processing and its disorders.
Cambridge University Press.
Kusmaryanto, S., 2013. Kerapatan Spektrum Daya (Power
Spectral Density).
McGinnis, D. J. and Smith, D. E. 1982. Analyzing and
Treating Reading Problems. New York, USA:
Macmillan Publishing Company.
Nurhadi, 2005. Membaca Cepat dan Efektif. Bandung:
Sinar Baru.
Soedarso, 2002. Speed Reading : Sistem Membaca Cepat
dan Efektif. Jakarta: PT Gramedia Pustaka Utama.
Stern, J. M. and Engel, J., 2005. An Atlas of EEG Patterns.
USA: Lippincott Williams & Wilkins.
Tatum, W.O., 2014. Handbook of EEG Interpretation.
USA: Demos Medical Publishing.
Valipour, S., Shaligram, A.D. and Kulkarni, G.R., 2014.
Detection of an alpha rhythm of EEG signal based on
EEGLAB. International Journal of Engineering
Research and Applications, 4(1), pp.154-159.
Xizheng, Z., Ling, Y. and Weixiong, W., 2011. Wavelet
time-frequency analysis of electro-encephalogram
(EEG) proccesing. International Journal of Advanced
Computer Science and Applications, 1(5), pp. 1–5.
Can Power Spectral Density (PSD) be used to Measure Reading Concentration?
453
