
Design of Reliability Applications Online Transportation in the
Medan City Community with Perspective as Users
Budi Anshari Nasution
1
Rahima Br. Purba
1
, Iskandar Muda
2
1
Student Postgraduate, Faculty Economic and Business, Universitas Sumatera Utara, Medan
Indonesia
2
Lecture Faculty Economic and Business, Universitas Sumatera Utara, Medan Indonesia
Keywords: Information Technology, Information Systems, Behavior Aspects.
Abstract: Along with the development of information technology, growing developers who try to provide applications
that can provide ease in meeting the needs of convenient transportation, comfortable and affordable prices.
Information System Success Model using the Delone and MacLane Model can be used to see the reliability
and success of online transport applications. The unsuccessful hypothesis proposed proves that other
determinants become factors that affect the reliability and success of its particular information system online
transport even if the model used has been valid. Lack of some respondents in this study is suspected to cause
the research data obtained is not sufficient for decision making in the hypothesis. Aspects of Behavior
(Behavior Aspects) both users and applications are presumed also influence the intensity of use (Intent to use)
and user satisfaction (User Satisfaction).
1 INTRODUCTION
The complexity of human needs causes a change in
society. This paper is shown in the rapid development
of information technology. Information technology
itself can be described as a technology that combines
computer networks with lines of communication that
carry data, voice or video. One form of application of
visible information technology development is in the
transport sector. Along with the development of
information technology, growing developers who try
to provide applications that can provide ease in
meeting the needs of convenient transportation,
comfortable and affordable prices. Especially in the
city of Medan which has a level of congestion that has
increased throughout the years.
Table 1: Number of registered motor vehicles (Units) 2009
– 2013
Years Cars Bus Pickup MotoCycle
2009 297.922 29.498 194.946 3.091.510
2010 327.467 29.978 203.452 3.478.230
2011 356.931 71.112 217.254 3.924.007
2012*) 386.144 71.590 231.750 4.292.933
2013 416.405 71.900 242.445 4.584.431
Sources: Polda North Sumatera Direktorat Lalu
Lintas Province North Sumatera.
The number of vehicles each year is increasing,
visible from the data above. The increase in the
number of vehicles is not balanced with the city's
highway capacity. According to data from the
Department of Transportation of Medan City (2016),
the number of motor vehicles reaches 2.7 million
units with a length of 3,191.5 km and a speed ratio of
23.4 km / h and a Capacity Ratio of 0.76. Private
vehicle 97.8%, general vehicle 2.2%, two-wheel
vehicles 75.95%, and four-wheel 24.05 %. This
condition that led to the creation of applications to
facilitate the search for means of transportation.
Various applications appear to solve the
problem. The claim that appeared in 2010 is Gojek,
in 2012 is Grab. And in the Year 2017 is Uber. Each
transport application implements a different tariff
system. It also offers ease of payment, i.e., in cash,
auto debit and wallet balance like Go-pay and Grab-
pay.
These applications offer new things in the means
of transportation in Medan City. The higher the
sophistication of technology, the higher the problem
can be caused by the technology itself. The success of
an information system can be explained from various
things, including quality system, the quality of
information provided, and user satisfaction using the
information system.
Nasution, B., Purba, R. and Muda, I.
Design of Reliability Applications Online Transportation in the Medan City Community with Perspective as Users.
DOI: 10.5220/0010067409510956
In Proceedings of the International Conference of Science, Technology, Engineering, Environmental and Ramification Researches (ICOSTEERR 2018) - Research in Industry 4.0, pages
951-956
ISBN: 978-989-758-449-7
Copyright
c
2020 by SCITEPRESS – Science and Technology Publications, Lda. All rights reserved
951
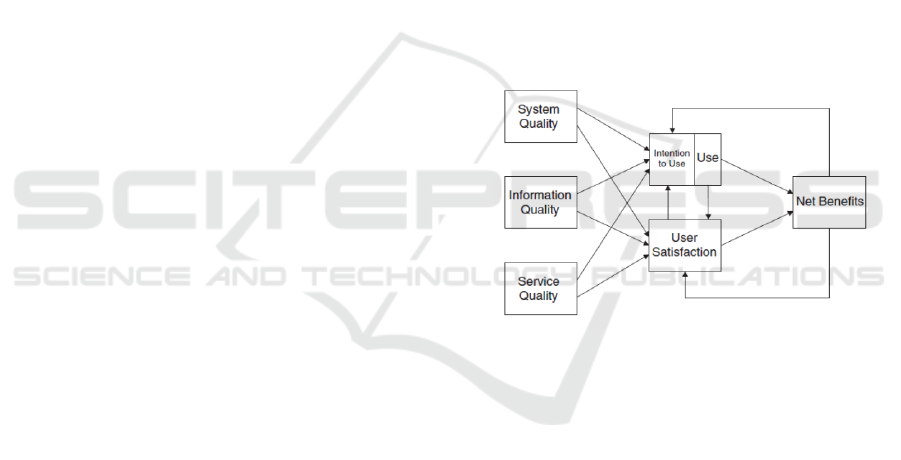
In analyzing the determinants of reliability in the
online transport applications used by drivers, this
study used the Delone & Mclean model. The Delone
& Mclean model reflects the dependence of the six
measurements of information system success. The six
elements are: (1) Information quality, (2) System
Quality, (3) Service Quality, (4) Intention To Use, (5)
User Satisfaction, and (6) Net Benefits (Delone and
Mclean, 2003).
2 LITERATURE REVIEW
This Information data processed into a useful form for
the wearer receives the data source as input and
processes it into information product as output. The
information system consists of several sub-systems or
components of hardware, software, and brainware, as
well as procedures for running inputs, processes,
outputs, storage, and controls that transform data
sources into information (8). Information systems can
also be interpreted as a system in an organization that
brings daily transaction processing needs that support
organizational operational functions that are
managerial with the strategic activities of an
organization to be able to provide to certain parties
with information needed to make decisions.
Uber Technologies Inc. is an American
multinational company engaged in the field of online
transportation services. This company is a developer
with the name of Uber application. This application
provides transportation on demand facility. This
application has a function as an intermediary between
the driver and the consumer who need transportation
means this application is available in the Google
Store, Apps Store and Microsoft. So that consumer of
this uber is party that use smartphone. From the driver
side, this application makes it easy for drivers to use
private vehicles, so they are not tied to any party
(Rosyadi, 2017), (Utomo, et al. 2017).
Grab is a transport company by using mobile
device taxi online application to make a booking
passenger shuttle from the place that has been
determined user and delivered in accordance with the
purpose of the order on the application. This app is
also controlled with GPS as a tool map (Utomo, et al.
2017), (Chan, et al. 2017).
Go-Jek is also a transportation service
company using applications that make it easier for
people in transportation services (Chan, et al. 2017).
Various choices of these applications make their
existence increasingly coloring the universe of online
transportation services competition, in this
competition conditions these three companies seeks
in improving service facilities to customers.
The Delone and McClean Information Model
Success Model is a model that illustrates how far the
contribution of a product generated by an information
system to an organization (Delone and Mclean,
2003).
The success of the online transport company is
seen through the performance of its employees. If the
employees are good then it will affect the company
profit. Performance optimization requires a
motivation in the employees. Basically, both the same
reward and punishment are needed to stimulate
someone to improve their quality. Reward is raised to
motivate a person to be active in carrying out
responsibilities because there is the assumption that
by giving rewards for the results of his work,
employees will be more work maximally[5]. While
punishment is raised for a person who commits
mistakes and offenses to be motivated to stop deviant
behavior and lead to positive behavior (Tarigan et al.
2018)
Figure 1. DeLone and McLean Model of Information
System Success (Delone and Mclean, 2003)
3 METHOD OF RESEARCH
This study was designed using quantitative research.
[9] Quantitative analysis is research whose data are
expressed in numbers and analyzed by statistical
techniques. The research is often in the form of
experiments and surveys. This research was
conducted in Medan City with a schedule of
questionnaire distribution from May 14, 2018, until
June 02, 2018. The type of research data used is
primary data. Primary data is data obtained by
researchers by way of spreading form to respondents
and interviews with some respondents who met to be
backup data. Primary data in this study include the
results of filling the questionnaire distributed to the
respondents.
ICOSTEERR 2018 - International Conference of Science, Technology, Engineering, Environmental and Ramification Researches
952
Population in this research is all user driver of
transportation application (go-jek, Uber, and Grab).
The sample of this study is the user drivers of
transport applications (go-jek, Uber, and Grab) which
fill out the questionnaire dated May 14, 2018, to June
02, 2018. Data collection using survey methods
conducted online.
4 RESULT AND ANALYSIS
4.1 Testing Validitas
Table 2: Value Average Variance Extranced.
Average Variance
Extracted (AVE)
IN_X4 0,638
IQ_X1 0,636
IU_Z1 0,564
NB_Y 0,622
SQ_X3 0,565
SYQ_X2 0,592
US_Z2 0,650
From the output of the analysis can be seen
that the Average Variance Extraced (AVE) value
above 0.50. This means it qualifies for validity.
4.2 Testing Reliabilitas
Table 3: Cronbach’s Alpha.
Cronbach's Alpha
IN_X4 0,813
IQ_X1 0,936
IU_Z1 0,692
NB_Y 0,916
SQ_X3 0,887
SYQ_X2 0,868
US_Z2 0,921
From the results of the analysis output can be seen
that the value of Cronbach's Alpha above 0.60. This
means qualifying reliability.
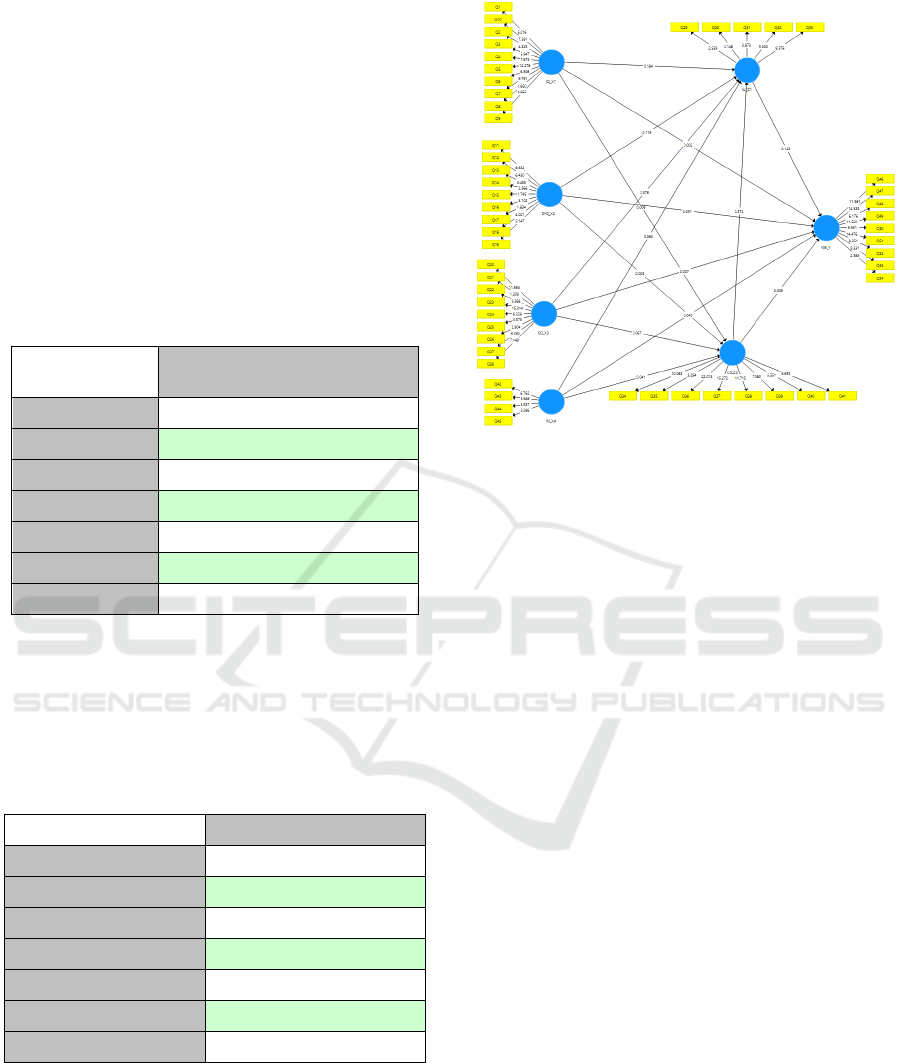
Figure 2. Structure Path Coefficient Values.
From the result of the path coefficient above can
be seen that all variables did not affect the value of t-
statistics generated for all variables <1.96. This
means that all alternative hypotheses are rejected
1. Influence of Information Quality on Intention of
use
From the table above we can see that the impact
of Information Quality on Intention of use has
an at-statistic value of 0.184 and p-value value
of 0.854. Because the amount of t <1.96 then
Information Quality does not affect the Intention
of Use.
2. Influence of Information Quality to User
Satisfaction
From the above table, the impact of Information
Quality on User Satisfaction has a t-statistic
value of 0.008 and p-value of 0.993. Because the
amount of t <1.96 then Information Quality does
not affect User Satisfaction.
3. Effect of System Quality on Intention of use
From the table above the impact of System
Quality on Intention of Use has a t-statistic value
of 0.119 and p-value value of 0.905. Because the
amount of t <1.96 then the System quality does
not affect the Intention of Use
4. Effect of System Quality on User Satisfaction
From the table above the influence of System
quality on User, Satisfaction has a t-statistic
value of 0.003 and p-value value of 0.997.
Because the amount of t <1.96 then System
Quality does not affect User Satisfaction.
Design of Reliability Applications Online Transportation in the Medan City Community with Perspective as Users
953

5. Effect of Service Quality on Intention of use
From the above table, the influence of Service
Quality on Intention of Use has a t-statistic value
of 0.376 and p-value of 0.707. Because the
amount of t <1.96 then Service Quality does not
affect the Intention of Use.
6. Effect of Service Quality on User Satisfaction
From the above table, the influence of Service
Quality to User Satisfaction has a t-statistic
value of 0.067 and p-value value of 0.946.
Because the amount of t <1.96 then Service
quality does not affect User Satisfaction.
7. Effect of User Satisfaction on Intention of use
From the table above the influence of User
Satisfaction on Intention of Use has a t-statistic
value of 0.372 and the value of p-value of 0.710.
Because the amount of t <1.96 then the
information quality does not affect the Intention
of Use.
8. Effect of Incentives on Intention of use
From the table above the influence of Incentives
to the intention of Use has a t-statistic value of
0.380 and the value of p-value of 0.704. Because
the amount of t <1.96 then Incentives does not
affect the Intention of Use.
9. Effect of Incentives on User Satisfaction
From the above table, the impact of incentives
on User Satisfaction has a t-statistic value of
0.041 and p-value value of 0.967. Because the
value of t <1.96 then Incentives no effect on
User Satisfaction.
10. Impact of Intention of use on Net Benefits
(Individual Impact)
From the table above the influence of intention
of use on Net Benefits (Individual Impact) hast-
statistic value of 0.123 and p-value value of
0.902. Because the amount of t <1.96 the
Intention of Use does not affect the Net Benefits
(Individual Impact).
11. Effect of User Satisfaction on Net Benefits
(Individual Impact)
From the above table, the influence of User
Satisfaction on Net Benefits (Individual Impact)
has an at-statistic value of 0.009 and p-value
value of 0.993. Because the amount of t <1.96
then User Satisfaction does not affect the Net
Benefits (Individual Impact).
Next, we see the Indirect Effect of the variable; we
can see the following table.
Table. 4: Specific Indirect Effect.
Specific
Indirect
Effects
IN_X4 -> US_Z2 -> IU_Z1 0,098
IQ_X1 -> US_Z2 -> IU_Z1 0,000
SQ_X3 -> US_Z2 -> IU_Z1 0,152
SYQ_X2 -> US_Z2 -> IU_Z1 0,020
IN_X4 -> IU_Z1 -> NB_Y 0,009
IQ_X1 -> IU_Z1 -> NB_Y 0,001
SQ_X3 -> IU_Z1 -> NB_Y 0,005
SYQ_X2 -> IU_Z1 -> NB_Y -0,003
IN_X4 -> US_Z2 -> IU_Z1 -> NB_Y 0,002
IQ_X1 -> US_Z2 -> IU_Z1 -> NB_Y 0,000
SQ_X3 -> US_Z2 -> IU_Z1 -> NB_Y 0,003
SYQ_X2 -> US_Z2 -> IU_Z1 -> NB_Y 0,000
IN_X4 -> US_Z2 -> NB_Y 0,078
IQ_X1 -> US_Z2 -> NB_Y 0,000
SQ_X3 -> US_Z2 -> NB_Y 0,121
SYQ_X2 -> US_Z2 -> NB_Y 0,016
From the table above can be concluded there is an
indirect influence that is:
1. Effect of Incentives on the intention of use
through User satisfaction of 0, 098 with
significant 5%.
2. Effect of Information Quality on Intention of Use
through User Satisfaction of 0,000 with
significant 5%
3. Effect of Service Quality on Intention of Use
through User Satisfaction of 0.152 with
significant
4. 5%.
5. Effect of System Quality on Intention of Use
through User Satisfaction of 0,020 with
significant 5%.
6. Effect of Incentives on Net Benefit through
Intention of Use of 0,009 with significant 5%.
7. Effect of Information Quality on Net Benefit
through Intention of Use of 0.001 with solid 5%.
8. Impact of Service Quality on Net Benefit through
Intention of Use of 0,005 with solid 5%.
9. Effect of System Quality on Net Benefit through
Intention of Use of -0,003 with solid 5%.
10. Incentive Effect on Net Benefit through User
satisfaction and intention of Use of 0,002 with
solid 5%.
ICOSTEERR 2018 - International Conference of Science, Technology, Engineering, Environmental and Ramification Researches
954

11. Effect of Information Quality on net benefit
through User satisfaction and purpose of use of
0.000 with solid 5%.
12. The influence of Quality Services on Net benefit
through User Satisfaction and plan of use is
0,003 with solid 5%.
13. Effect of System Quality on Net gain through
User Satisfaction and purpose of use of 0.000
with solid 5%.
14. Incentives influence net benefit through User
satisfaction of 0.078 with solid 5%.
15. Effect of Information Quality on net gain through
User satisfaction of 0,000 with solid 5%.
16. Impact of Service Quality on net benefit through
User satisfaction of 0.121 with solid 5%.
17. Effect of System Quality on net gain through
User satisfaction of 0.016 with solid 5%.
18. Considering the result of the research, it is known
that the model compiled related to Information
System Success Model proposed shows that the
variables used in the model are strongly
categorized, but all hypotheses are not
significant, this is contrary to Rosyadi
research[2]. Several factors among them can
cause the difference between the results of this
study with previous research has not fulfilled the
number of respondents who followed the survey.
But interviews and open-ended questions to the
respondents found that there are some indications
of new findings regarding the determinants of
successful online transport applications that are
related to Behavior User Issues about incentives
(punishment & rewards) that directly affect
income that will accept by them every day. Not
equal the position of application users and
application providers when a dispute over
incentive calculation also affects the usage level
(intense to use) and even user satisfaction. Thus
the reliability and success of an information
system application is not only determined by the
safety and success of the application itself but
also influenced by behavioral factors of both
application users and application providers.
19. The study also found that in general the
reliability of available online transport
applications for both motorcycles and cars is
relatively similar and we found that more than
30% of users use more than one online transport
application, indicating that other factors affect
the success of the transport application system
online. From the results of interviews and open
questions put forward, it is known that the
incentive factors affect the level of use of the
applications they use. This factor becomes the
driver of user behavior in using the available
online transportation. On the other hand, the
form of this incentive also has not satisfied the
user because there are still many weaknesses of
the application provider in detecting the fraud
happened by the users and or other user groups
such as fictitious travel order and false user.
Changed incentive schemes with unscheduled
also considered the user only benefits the
application provider. Unequal positions at
different calculations occur in the
implementation of incentives affecting the
drivers of online transport as users in
determining which transport applications will be
used. This is by the reward and punishment
theory[5]
5 CONCLUSION
The conclusion of this paper described are:
a. Information System Success Model developed by
Delone and Mclane can be used to see the
reliability and success of online transport
applications
b. The unsuccessful hypothesis proposed proves that
other determinants become factors that affect the
reliability and success of its particular information
system online transport even if the model used has
been valid.
c. Lack of some respondents in this study is
suspected to cause the research data obtained is
not sufficient for decision making in the
hypothesis.
d. Behavior Aspects (both Behavior Aspects) both
users and applications are also suspected to affect
the intensity of use (Intent to use) and user
satisfaction (User Satisfaction).
REFERENCES
W. H. Delone and E. R. Mclean, “The DeLone and McLean
Model of Information Systems Success: A Ten-Year
Update,” J. Manag. Inf. Syst., vol. 19, no. 4, pp. 9–30,
2003.
M. I. Rosyadi, Surabaya Analysis of Successfull Aplications
Uber Driver User Prespective Surabaya City
Community With Delone Model Approach Surabaya.
2017.
H. Utomo, E. Muh, A. Jonemaro, and M. T. Ananta,
“Perbandingan Usabilitas Aplikasi Taxi Online
Android ( Grab-car dan Uber ) Menggunakan Unified
Theory of Acceptance and Use of Technology (
UTAUT ),” J. Pengemb. Teknol. Inf. dan Ilmu Komput.
Design of Reliability Applications Online Transportation in the Medan City Community with Perspective as Users
955

Vol., vol. 1, no. 12, pp. 1708–1717, 2017.
A. Chan, M. Maharani, and W. Tresna, “( Study on Pt . Go-
Jek and Pt . Grab Indonesia Consumer in Dki Jakarta )
Perbandingan Pengalaman Pengguna Pada Aplikasi
Mobile Go-Jek Dan Grab ( Studi Pada Konsumen Pt
Go-Jek Dan Pt Grab Indonesia Di Dki Jakarta )
Abstrak,” vol. 2, no. 2, 2017.
J. M. Ivancevich, M. T. Matteson, and J. M. Ivancevich,
Organizational Organizational Behavior and
Management Tenth Edition. .
V. C. E. Tarigan et al., “Cybercrime case on social media
in Indonesia,” Int. J. Civ. Eng. Technol., vol. 9, no. 7,
2018.
S. Febrianti, M. Al Musadieq, A. Prasetya, F. I.
Administrasi, and U. Brawijaya, “Pengaruh Reward
Dan Punishment Terhadap Motivasi Kerja Serta
Dampaknya Terhadap Kinerja ( Studi pada Karyawan
PT . Panin Bank Tbk . Area Mikro Jombang ),” vol. 12,
no. 1, pp. 1–9.
W. H. Delone and E. R. Mclean, “The DeLone and McLean
Model of Information Systems Success,” J. Manag. Inf.
Syst., vol. 19, no. 4, pp. 9–30, 2003.
H. Von and U. Schäffer, GABLER EDITION
WISSENSCHAFT Research in Management
Accounting & Control. .
ICOSTEERR 2018 - International Conference of Science, Technology, Engineering, Environmental and Ramification Researches
956
