
Acetone Level and Salivary Oral Status Patient with Type 2 Diabetes
Mellitus (In Vivo)
Ameta Primasari
1
, Yumi Lindawati
1
, Yendriwati
1
, Almida Purnama Nasution
1
, and Tulus Ikhsan
Nasution
2
1
Department of Oral Biology Faculty of Dentistry, Universitas Sumatera Utara Medan, Indonesia
2
Departement of Physics, Faculty of Mathematics And Natural Sciences, Universitas Sumatera Utara Medan, Indonesia
Keyword: Salivary flow rate, pH salivary, and acetone level
Abstract: Diabetes mellitus is a chronic metabolic disease characterized by hyperglycemia due to lack in the production
of insulin produced by isled cell of pancreas, and systemic disease associated in oral manifestations.
Reduction of salivary flow is one of the oral complication in patients with diabetes mellitus that can cause dry
mouth, acidic pH and others. Acetone is the most abundant compound in the breath, acetone concentrations
increased in patients with diabetes mellitus. The objective of this research is to analyze acetone level in mouth
and salivary status (salivary flow rate and salivary pH) in type 2 diabetes mellitus patients, and to analyze the
relationship between blood sugar levels and acetone levels, salivary flow rate, and salivary pH. This research
is an analytical observational research with cross sectional and total sampling in this research were 31 patients
by purpossive sampling, measurement of acetone levels and salivary samples was carried out at Aviati Clinic
Medan. Stimulated saliva respondents has diagnose as DM was collected by spitting for 5 minutes in the
saliva pot. The salivary pH measurement using GC saliva test for pH and acetone level measurement using
Diasen. Data were analysis using fisher’s exact test. The results of this research showed the average salivary
flow rate is normal with value 1,5 ml/menit, pH salivary normal with value 7,2, and acetone levels normal
with value 377,38mV. Fisher Exact Test showed a significant relationship between blood sugar levels with
salivary flow rate (p< 0,05) but did not show a significant association between blood sugar levels with pH
salivary and acetone levels (p>0,05). Test graph to find out relationship between acetone levels with salivary
pH, relationship between acetone levels with salivary flow rate, and relationship between salivary flow rate
with salivary pH it was found there was correlation was significant. The conclusion of this research if salivary
status normal in patient type 2 DM, it would appeared normal the acetone levels.
1 INTRODUCTION
Diabetes mellitus is a metabolic disease characterized
by hyperglycemia due to absolute or relative decrease
in insulin secretion or due to insulin resistance which
results in a decrease in glucose into the cell and an
increase in blood sugar levels, and changes in fat,
protein and carbohydrate metabolism (Humairo,
2014).
Diabetes mellitus is divided into two types,
namely type 1 diabetes mellitus (insulin dependent
diabetes mellitus) and type 2 diabetes mellitus
(noninsulin dependent diabetes mellitus). World
Health Organization (WHO) estimates that in 2025
the number of people with diabetes mellitus will
increase to 300 million people and will increase to
438 million by 2030 world wide, including type 2 DM
patients. According to WHO estimates, 70% of the
prevalence of DM is found in developing countries.
The results of Regional Health Research
(RISKESDAS) in 2013, the prevalence of diabetes
mellitus in North Sumatra was 1.8% (Rikesdas and
Riskesdas, 2013).
In people with DM, there are often several
manifestations of the oral mucosa, some
manifestations that often occur in the form of
candidiasis, burning mouth syndrome, oral lichen
planus, recurrent aphthous stomatitis, xerostomia and
salivary gland dysfunction, in patients with type 2
DM there is a change in salivary flow rate and
salivary components , decrease in salivary flow rate
occurs due to parenchymal damage, changes in
500
Primasari, A., Lindawati, Y., Yendriwati, ., Nasution, A. and Nasution, T.
Acetone Level and Salivary Oral Status Patient with Type 2 Diabetes Mellitus (In Vivo).
DOI: 10.5220/0010076305000504
In Proceedings of the International Conference of Science, Technology, Engineering, Environmental and Ramification Researches (ICOSTEERR 2018) - Research in Industry 4.0, pages
500-504
ISBN: 978-989-758-449-7
Copyright
c
2020 by SCITEPRESS – Science and Technology Publications, Lda. All rights reserved

salivary gland microcirculation, dehydration, and
disturbances in glycemic contraction. Complications
that are often found in patients with type 2 diabetes
mellitus include, xerostomia, tooth loss, gingivitis,
periodontitis, odontogenic abscess, and soft tissue
lesions on the tongue and oral mucosa. In type 2
diabetes mellitus patients also have a significant
decrease in salivary pH compared with non diabetes
mellitus subjects and is associated with microbial
activity or decreased bicarbonate which occurs
simultaneously with salivary flow rates (Almeida,
2018), (Lopez, 2016).
Acetone (C3H6O) is one of the most abundant
compounds in human breathing. Acetone is produced
by heptocyse through decarboxylation from excess
acetyl-Coa. Acetone formed by decarboxylation
originating from lipolysis or lipid peroxidation.
Ketone bodies, such as acetone are oxidized through
the krebs cycle in peripheral tissues. Acetone
concentration in breathing increases in uncontrolled
patients with diabetes mellitus. The concentration of
acetone in breath of people who do not suffer from
diabetes mellitus is 800-900ppb, while patients with
diabetes mellitus range from 1800ppb. Acetone
causes bad breath, which is the smell of pears caused
by ketoacidosis. this is a complication of oral cavity
(Mitrayana, 2014), (Ozougwu, 2013).
2 MATERIALS AND METHODS
This study is an analytical observational research with
cross sectional, and the total samples in this study
were 30 patients and met the inclusion criteria are
ages 40-55, patient with diabetes mellitus controlled,
willing to participate in the study, in good health, has
no other complicated diseases, and exclusion are
alcoholic drinkers, copulate, smokers, not undergoing
radiotherapy, patient with other complicated diseases,
taking drug that affect secretion, mental disorders,
unwilling to participate in the study, and using
insulin.
Sampling of stimulated saliva and acetone levels
is done after obtaining approval from the Medical
Research Ethics committee of the Faculty of
Medicine, Universitas Sumatera Utara and the patient
has signed an informed concern sheet to be patient.
The subjects were asked to fasting 2 hours before
sampling, the sampling technique using draining
method, the subjects were asked to chew wax
paraffin, saliva accommodated on saliva pot for 5
minutes and labeled. Salivary flow rate (ml/minute),
salivary pH was measured using GC salivary test for
pH (Kasuma, 2015).
In the GC Saliva Check Buffer, normal values of
mean salivary flow rate stimulated in healthy
individuals range from 1.0 to 3.0 ml/min. It the value
is below 0,7 ml/min then the condition is
hyposalivated and if beetwen 0,1-0,25 ml/min then
the value is very low. Salivary pH normal ranges from
6,8-7,8 and acid range from 6,0-6,6, very acidic
ranges from 5,0-5,8. Furthermore, SPSS and
STATCAL were used to perform classical
assumption test and linear regression (Sutiksno,
2018), (Gio, 2013).
3 RESULT AND DISCUSSION
3.1 Result
Table 1 shows the average of normal salivary flow
rate, salivary pH, and acetone levels in type 2 diabetes
mellitus patients.
Table 1. Analysis of salivary flow rate, salivary pH, and
acetone levels in patient with type 2 diabetes mellitus
Diabetes Mellitus Type 2
Variable n
x
± SD
Salivary flow rate
(ml/minute)
31 1,5 ± 0,7
pH Salivary 31 7,2 ± 0,5
Acetone Levels
(mV)
31 377,38 ±171,20
Table 2 shows the analysis results of of the
relationship between blood sugar levels and salivary
flow rate and salivary pH as evidenced by the
significant Pearson Correlasion Test p <0.05 which
showed that there was no correlation between fasting
blood sugar levels and salivary flow rate, salivary pH,
and salivary buffer capacity with a positive
correlation type of closeness is very weak, which
means the tendency of blood sugar levels will
increase that cause salivary flow rates and salivary pH
will increase.
Acetone Level and Salivary Oral Status Patient with Type 2 Diabetes Mellitus (In Vivo)
501
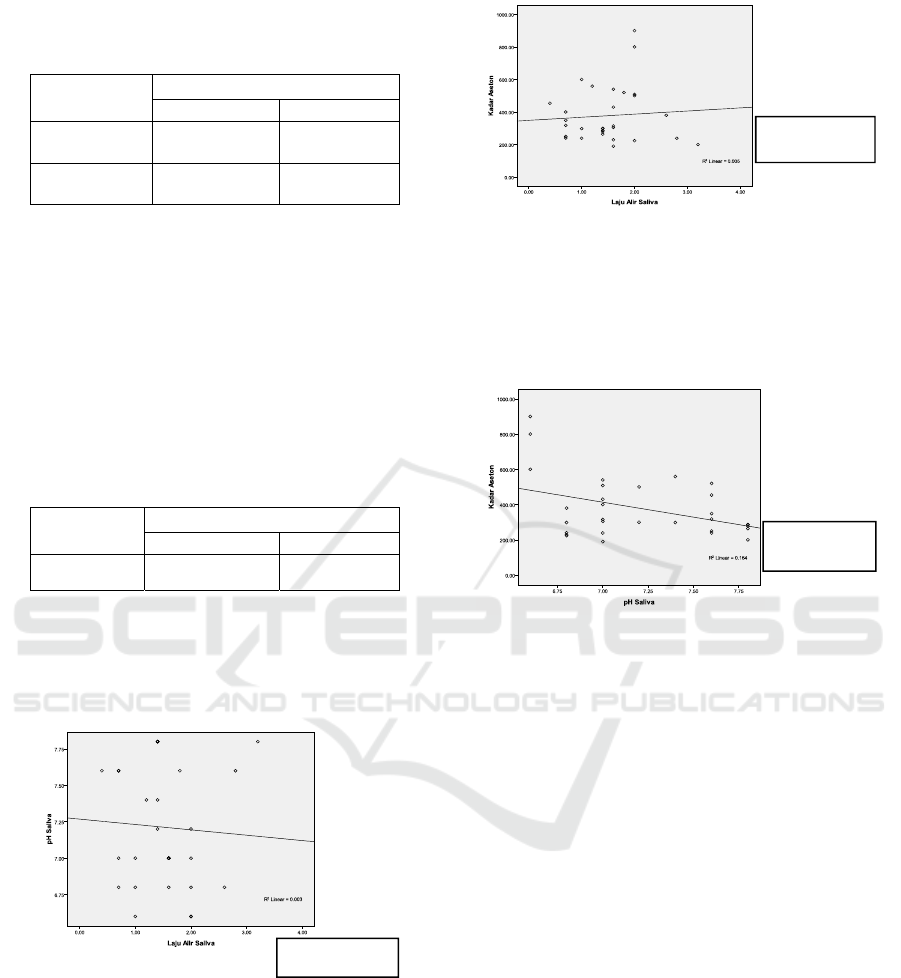
Table 2. Analysis between blood sugar levels and salivary
flow rate, Ph and salivary buffer capacity in type 2 diabetes
mellitus patients.
Variable Fasting Blood Sugar Levels
r p
Salivary flow
rate
0,181 0,527
pH salivary 0,043 0,820
Uji correlasi pearson
Table 3 shows the analysis results of the
relationship of blood sugar levels with acetone levels
using Pearson Correlation Test of significance p
<0.05. The results obtained there is no significant
relationship between blood sugar levels and acetone
levels with a very weak type of positive correlation
which means the tendency of sugar levels increased
blood will cause acetone levels to increase.
Table 3. Analysis of blood sugar levels in patient with type
2 diabetes mellitus.
Variabel Fasting Blood Sugar Levels
r p
Acetone Leve
l
0,078 0,678
Uji correlasi pearson
Figure 1 shows the analysis results of salivary
flow rate relationship with salivary pH using graph
test. The result of this research showed a significant
correlation
.
Figure 1. Relationship of salivary flow rate with salivary
pH
Figure 2 shows the analysis results of salivary
flow rate relationship with acetone levels using graph
test. The result of this research showed a significant
correlation between acetone levels and salivary flow
rate.
Figure 2. Relationship of acetone levels and salivary flow
rate.
Figure 3 shows the analysis results of salivary pH
relationship with acetone levels using graph test. The
result of this research showed a significant correlation
between salivary pH and acetone levels.
Figure 3. Relationship of acetone levels and salivary pH.
3.2 Discussion
In this research, the average patient had a normal
salivary flow rate with a value of 1.5 ± 0.64, a pH of
7.2 ± 0.41 (table 1), and this research had the same
results as the research of Bernadi et al ( 2007). The
results of his research stated that the mean value of
salivary flow rate (1.95 ± 0.73) and salivary pH (6.7
± 1.8) in patients with controlled diabetes mellitus
was normal. Research of (Prathibha, 2013) explains
the average prevalence of salivary flow rate and
salivary pH in uncontrolled type 2 diabetes mellitus
patients, which is different from this research, that
salivary flow rate 0.46 ± 0.02 categorized as
hyposalivation (< 0.7ml / min)
and value pH 6.69 ±
0.35 is categorized as low. The difference between
the results of this research due to differences in
research subjects and methods. Prathibha conducted
an uncontrolled test of subjects with diabetes mellitus
and methods of taking saliva with unstimulated
spitting, while in this research conducted a test with
controlled diabetes mellitus patients and used saliva
spitting stimulation sampling methods (Prathibha,
2013).
R
2
:0
,
003
R
2
:0,005
R
2
:0,164
ICOSTEERR 2018 - International Conference of Science, Technology, Engineering, Environmental and Ramification Researches
502

Research by Lasisi and Fasanmade shows that
salivary flow rate in uncontrolled diabetes mellitus
patients is lower than controlled diabetes mellitus
patients, with uncontrolled type 2 diabetes mellitus
patients having a low salivary flow rate (Lasisi and
Fasanmade, 2012).
(Karuniawani, 2015) stated that salivary gland
secretion can be stimulated in several ways, such as
with mechanical stimulation. By chewing food,
chewing can increase salivary secretion because
chewing activity will stimulate the parasympathetic
nerves, and dilate blood vessels in the salivary glands.
Salivary secretion is highly dependent on the
nutrients supplied by the blood vessels to the salivary
gland. (Roletta, 2002) states that stimulation with
paraffin mastication increases salivary pH and, in this
research, obtained an average salivary pH of 7.22, as
known salivary pH is affected by salivary flow rate.
The speed of stimulated salivary flow rate with
paraffin mastication has increased, so that the salivary
pH with stimulated flow rate will also increase
(Karuniawati, 2015), (Roletta, 2002).
Glucose is a small molecule that capable to move
easily inside the blood vessels membrane, which can
be removed from blood plasma to gingival fluid
through the gingival sulcus, and reach the saliva.
Enhancement of blood glucose level in diabetes
mellitus patients can lead to the increase of salivary
glucose level (Sumintarti and Rahma, 2015).
The relationship between fasting blood sugar
levels and salivary flow rate and salivary pH (table 2)
has been tested using the Pearson Correlation of
significance p <0.05. Pearson Correlation between
fasting blood sugar levels and salivary flow rate
shows that a non-significant value (p> 0.05) with a
very weak type of positive correlation (r = +0.181).
(Bernardi, 2007) stated that in the uncontrolled of
controlled diabetes mellitus group, there was a
change in salivary flow rate but not significant. In this
research showed that there was a relationship between
salivary flow rate and blood sugar levels. Blood
glucose concentration indicates hyperglycemia is
factor that influences salivary flow rates. In this
research has found the results of normal salivary flow
rate with high blood sugar levels. It can be influenced
by other things that can stimulate salivary secretion.
In this research using masticatory stimulation with
paraffin candy which can increase salivary secretion
(Bernardi, 2007).
Table 2 showed that there was not relationship
between blood glucose and salivary pH in type 2
diabetes mellitus patient. Salivary pH value in the
majorities of the research subjects had. Normal
salivary pH value in fasting blood glucose with high,
moderate, and normal categories, and there were only
3 patients had acid value. (Hedge, 2010) stated that,
there was a significant differences between diabetes
mellitus group and control group. Patients with
diabetes mellitus had acid value in salivary pH, and it
influenced by poor oral hygiene. Other research
stated a different results. According to (Priyanto,
2017), there were not significant relationship between
blood glucose level and salivary pH. There are several
assumption that can explained why there wasn’t any
relationship between blood glucose level with the
acidity of salivary pH. Blood glucose level had
variation value that sometimes up and down which
was due to the endogen factor of each respondents
and was also affected by several non-physics and
environmental factors. The decrease of medicine
effect will leads to the increase of blood glucose level.
while salivary pH affected by overall health factors
such as diabetes mellitus disorders. Xerostomia is
affected by local disturbances in salivary gland,
medicine effects, and stress (Hedge, 2010), (Priyanto,
2017).
Table 3 showed that there was not relationship in
blood glucose level with acetone level in type 2
diabetes mellitus patient. According to (Mitrayana,
2014), acetone is the most abundant compound in
human airway system, and acetone concentration in
airway system was increased in uncontrolled diabetes
patient. According to (Muttaqin, 2012), blood glucose
level and acetone concentration in saliva had a
relationship, that patient with higher blood glucose
will had higher acetone level in their saliva, however
this research was done using
spectroscopy. This
research used diasen to assess the relationship
between blood glucose and acetone level and this
research showed that there wasn’t any significant
relationship using diasen. Diasen is a tool to detect the
acetone level in breath that was applied to type 2
diabetes mellitus patient (Muttaqin, 2012).
Figure 1 showed that there was a relationship
between salivary flow rate and salivary pH. Normal
salivary pH value range 6-7 and depends on the flow
rate. An acidic pH will affect the flow rate become
viscous (Pandey, 2014).
Figure 2 showed that there was a relationship
between acetone level and salivary flow rate. In graph
3 showed that there was a relationship between
acetone level and salivary pH. There is a inverse
relationship between salivary pH and acetone level,
acid value in pH causes an increase in ketoacidosis,
therefore acetone level also increases.
Acetone Level and Salivary Oral Status Patient with Type 2 Diabetes Mellitus (In Vivo)
503

4 CONCLUSION
The subjects of this research, generally, had salivary
flow rate, normal salivary pH and normal acetone
levels with high fasting blood sugar level. The
relationship between fasting blood sugar level, flow
rate, and salivary pH is no significant relationship,
acetone levels also do not have a significant
relationship with fasting blood sugar levels. In this
research, the relationship between acetone levels with
salivary pH and flow rate has contained a significant
relationship, also there was significant relationship
between flow rate and salivary pH.
ACKNOWLEDGEMENTS
This study is funded by university of north sumatera
according to the TALENTA research executing
contract number : 2590/UN5.1. R/PPM/2018.16
march 2018.
REFERENCES
Humairo dan Apriasari. Studi Deskripsi Laju Aliran Saliva
pada Pasien Diabetes Melitus di RSUD Ulin
Banjarmasin. PDGI J 2014. 63(1): 8-13.
Badan penelitian dan pengembangan kesehatan depertemen
kesehatan RI. Hasil Riset Kesehatan Dasar
(RIKESDAS). Jakarta: badan penelitian dan
pengembangan kesehatan depertemen kesehatan RI;
2013.h. 87-90.
Loporan Hasil Riset Kesehatan Dasar (RISKESDAS)
Provinsi Sumatera Utara. Jakarta: badan penelitian dan
pengembangan kesehatan depertemen kesehatan RI;
2013. h. 91-92
Prathibha K.M, Johnson P, Mathangi Ganesh, Arcot S.S.
Evaluation of Salivary Profile Among Adult Type 2
Diabetes Mellitus Patients In South India. Clinical And
Diagnostic Research J 2013; 7(8):1592-1595.
Almeida PDV, Gregio AMT, Machado MAN, Antonio
Adilson, Luciana Reis Azevedo Machado. Saliva
Composition And Functions: A Comprehensive
Review. J Contemp Dent Pract 2008. (9)3: 1-11, 72-80.
Rosa Maria Lopez P, Elisabeth Casanas, Jose Gonzalez S,
Julia Serrano, Lucia Ramirez, Lorenzo d, dkk.
Xerostomia, Hyposalivation, and Salivary Flow In
Diabetes Patients. Diabetes Research J 2016. 1-3.
Mitrayana, M.A.J. wasono, M.R. ikhsan. Pengukuran
Konsentrasi Gas Aseton (C3H6O) Dari Gas Hembus
Relawan Berpotensi Penyakit Diabetes Mellitus dengan
Metode Spektroskopi Fotoakustik Laser. Fisika
Indonesia J 2014. 18(54): 94-96.
Ozougwu J.C, Obimba K.C, Belonwu C.D, dan
Unakalamba C.B. The Pathogenesis and
Pathophysiology of Type 1 and Type 2 Diabetes
Mellitus. J. Physiol. Pathophysiol 2013; 4(4): 46-57.
Nila Kasuma. Fisiologi dan Patologi Saliva. Padang:
Andalas University Press, 2015. 22-26.
Dian Utami Sutiksno et al 2018 J. Phys.: Conf. Ser. 1028
012244.
Gio, P. U., 2013, Aplikasi Statistika dalam SPSS,
USUpress.
Gio, P.U. and E. Rosmaini, 2015, Belajar Olah Data dengan
SPSS, MINITAB, R, MICROSOFT EXCEL,
EVIEWS, LISREL, AMOS, dan SMARTPLS,
USUpress.
Lasisi T.J dan Fasanmade A.A. Salivary Flow And
Composition In Diabetic And Non Diabetic Subjects.
Niger.J.Physiol.Sci 2012. 79-82.
Karuniawati, N.M.P., Ns. I Wayan Sukawana,
S.Kep.,M.Pd., Ns. Luh Gede Maryati, S.Kep (2015).
Pengaruh Pemberian Latihan Mengunyah
Menggunakan Permen Karet Terhadap Jumlah Sekresi
Saliva Pada Pasien Dengan Diabetes Melitus Tipe 2.
Diploma Thesis. Universitas Udayana.
Roletta H.E. Pengaruh Stimulasi Pengunyahan dan
Pengecapan Terhadap Kecepatan Aliran dan pH Saliva.
JKGUI. 2002. 9(1): 29-34.
Sumintarti dan Fildzah rahma. Korelasi Kadar Glukosa
Saliva dengan Kadar Glukosa Darah Terhadap
Terjadinya Kandidiasis Oral pada Penderita Diabetes
Melitus. Dentofasial. Februari 2015. 14(1): 29-31.
Bernardi M.J, Reis A, Loguecio A.D dkk. Study of The
Buffering Capacity, Ph and Salivary Flow Rate In Type
2 Well-Controlled and Poorly Controlled Diabetic
Patients. Oral Health Prev Dent J. 2007. 5: 73-78.
Hegde A, Shenoy R, D'MeIlo P, Smitha A, Tintu A,
Manjrekar P. Alternative markers of glycemic status in
diabetes mellitus. Biomedical Research.
2010.21(3):252-256.
Priyanto M.H, Rusdi A, Tjut M.Z. Hubungan Kadar Gula
Darah Sewaktu Dan HbA1c Dengan Derajat pH Saliva
Pada Pasien Diabetes Melitus di RSUDZA Banda
Aceh. Jurnal Ilmiah Mahasiswa Medisia. Februari
20017. 2(1): 28-34.
Muttaqin A, Mursaini T. Penentuan Kadar Gula Darah Pada
Penderita Diabetes Melitus (DM) Melalui Uji
Spektroskopi Aseton Dalam Air Liur. Ilmu fisika J.
maret 2012.4(1):8-13.Renigier-Biłozor, Małgorzata
dan Andrzej Biłozor 2015Oeconomia copernicana6(4)
139 – 157.
Pandey AK. Physiology of Saliva : An Overview. J Dent
Ind. 2014. 21(1): 32-38.
ICOSTEERR 2018 - International Conference of Science, Technology, Engineering, Environmental and Ramification Researches
504
