
On the Laboratory Testings to Characterize the Smear Zone
Rudi Iskandar
1
, A. Perwira Mulia Tarigan
2
, Roesyanto
3
1
Teaching Staff at the Civil Engineering Post Graduate Study Program, Faculty of Civil Engineering, Universitas
Sumatera Utara
2
Teaching Staff at the Civil Engineering Post Graduate Study Program, Faculty of Civil Engineering, Universitas
Sumatera Utara
3
Teaching Staff at the Civil Engineering Post Graduate Study Program, Faculty of Civil Engineering, Universitas
Sumatera Utara
Keywords: Smear Zone, Extent Ratio, Permeability Ratio, Laboratory Testing, PVD Instalation, Consolidation.
Abstract: Due its effect on the effectiveness of the PVD performance, the existence of the smear zone is a matter of
considerable interest. The objective of this paper is to review the laboratory testing of the previous studies
concerning the smear zone. Two main parameters are the focus in this study in order to characterize it, ie the
extent ratio and the permeability ratio. Differences in the laboratory set-up lead to the ranges of the values of
the two main parameters and difficulty to compare their values. It is suggested that a standarized laboratory
testing be established to obtain a more accurate and consistent laboratory results.
1 INTRODUCTION
The main parameters proposed for characterizing the
smear zone are the extent ratio and the permeability
ratio. The extent ratio s or s’ is the ratio of the radius
of the smear zone r
s
to the radius of the drain r
w
or to
radius of mandrel rm. The permeability ratio κ is the
ratio of the horizontal permeability k
h
at the
undisturbed location to that at the disturbed site k
s
.
The value of these ratio are important in soil
improvement planning using PVD and preloading. If
the s' and κ are not planned well, they will result in
the incorrect rate and duration of consolidation and
thus disrupt the schedule of infrastructure to be
built.One method that can be used to measure s' and
κ is by conducting laboratory testing. This method
most likely cost less and need shorter time then the
method using trial embankment in the field.
Although comprehensive set-up of equipment in
the laboratory has not been established, many
researchers have used the laboratory testing to obtain
the s' and κ (Bergado et al., 1991;Indraratna, and
Redana, 1998; Sharma and Xiao, 2000; Indraratna
and Rujikiatkamjorn, 2004; Sathananthan and
Indraratna, 2006; Fang and Yin, 2006; Shin et al.,
2009; Saowapakpiboon et al., 2010; Tran-Nguyen
and Edil, 2011; Ghandeharioon, et al., 2012; Chai et
al., 2013; Rujikiatkamjorn et al., 2014; Indraratna et
al., 2015; Joseph et al., 2015; Pajouh et al., 2015;
Sengul et al., 2016; Choudhary et al., 2016). Those
whose results are compared in this study can be seen
in column 2 in Table 1. There is no agreement on the
value of s’ and κ resulting from laboratory testing.
Therefore, it is important to review set-up laboratory
testing that has been used in studying the
characteristics of the smear zone and to comprehend
the main causes of why the values vary.
2 THE MAIN POINTS OF
LABORATORY WORKS
2.1 Laboratory Set-up of Equipment
The laboratory set-up used to determine the s' and κ
values involved at least 6 factors presented in Figure
1. Figure 2 shows an example of a large-scale
consolidation apparatus utilized by Indraratna and
Redana (1998).
Iskandar, R., Tarigan, A. and Roesyanto, .
On the Laboratory Testings to Characterize the Smear Zone.
DOI: 10.5220/0010084502730279
In Proceedings of the International Conference of Science, Technology, Engineering, Environmental and Ramification Researches (ICOSTEERR 2018) - Research in Industry 4.0, pages
273-279
ISBN: 978-989-758-449-7
Copyright
c
2020 by SCITEPRESS – Science and Technology Publications, Lda. All rights reserved
273
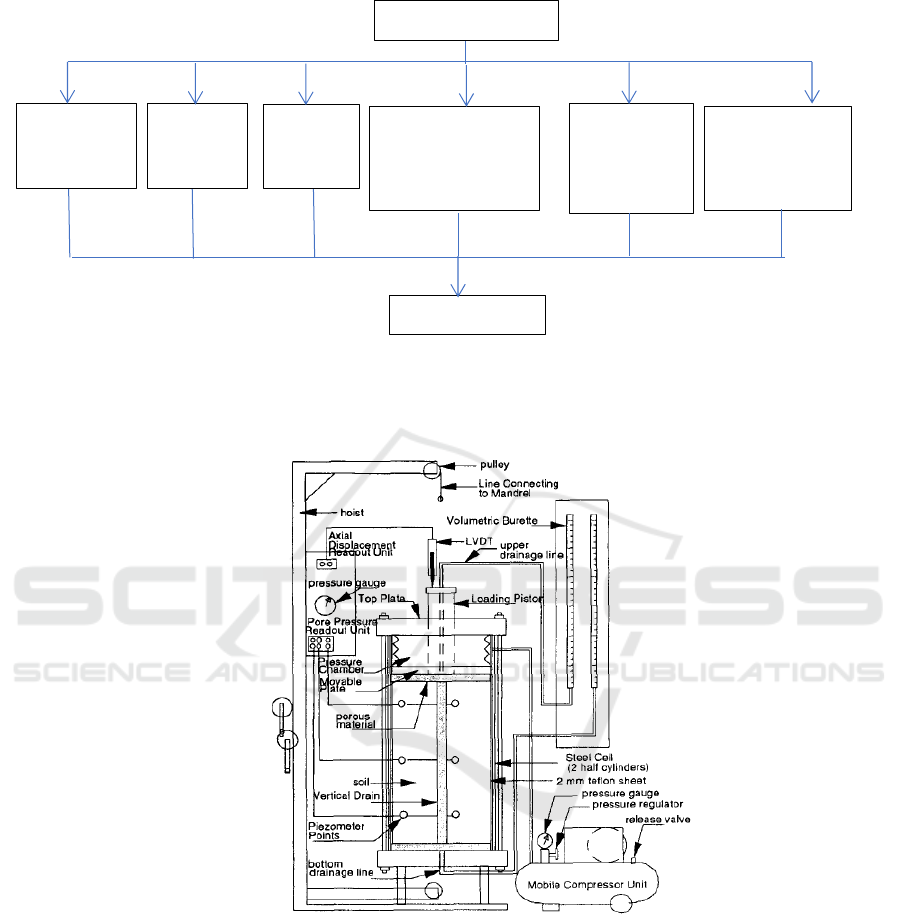
Figure 1. Set Up Testing Equipment at Laboratory
Figure 2. Large-Scale Consolidation Apparatus (Indraratna and Redana 1998 )
Laboratory Set-Up
Dimension
and Tank
Shape
Type of
Soil
Sample
Sample
Prepa-
ration
Preconsolidation
and
Consolidation
Stresses
Mandrel
Dimension
and Instala-
tion Speed
Method of
Determination
of s’ and κ
values
s’ and κ values
ICOSTEERR 2018 - International Conference of Science, Technology, Engineering, Environmental and Ramification Researches
274
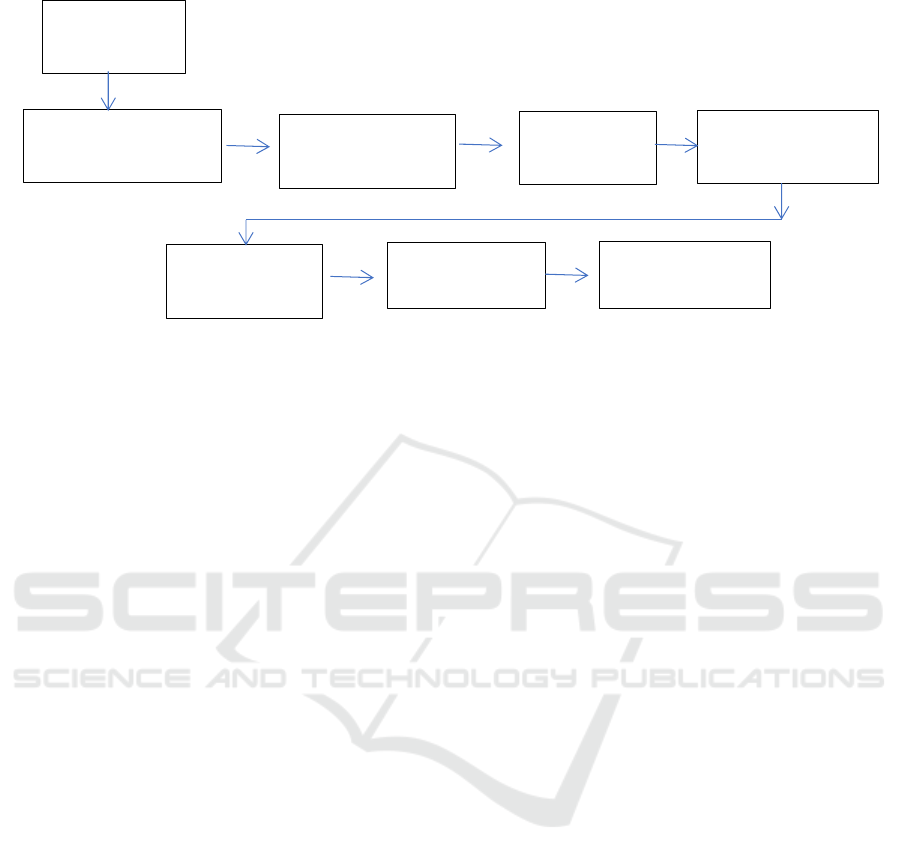
Figure 3. Sample Preparation And Determination Phases of Smear Zone Characteristics in Laboratory
2.2 Determination of Smear Zone
Characteristics in Laboratory
Testing normally starts from the sample preparation
stage. The sample preparation and the ensuing
determination stage of the smear zone characteristics
are presented in Figure 3. Columns 11 - 14 in Table 1
show the results of the 17 previous laboratory studies
on the characteristics of the smear zone composed
mainly of soft soils.
3 LABORATORY RESULTS
Bergado et al.(1991) concluded using PVD smear
effect is an important factor in evaluating the rate of
consolidation. Indraratna and Redana (1998)
conclude, there is significant decrease of k
h
towards
SD, where k'
v
is relatively unchanged. Where k'
v
is
soil permeability coefficient in the vertical direction
zone. Sharma and Xiao (2000) showed that there are
two remedial smear zone, parts located close to PVD
and reconsolidated zone that are located between the
remoulded zone and the intact zone. Fang and Yin
(2006) showed that the buckling effect on PVD will
increase the influence of well resistance and decrease
rate of consolidation. Indraratna and Rujikiatkamjorn
(2004) and Saowapakpiboon et al. (2010) combines
PVD, preloading and vacuum, proposing s' without
and using vacuum the same value.
Tran-Nguyen and Edil (2011) reported there were
two identifiable zones around PVD in the soil mass
after PVD installation. Ghandeharioon, et al (2012)
may present a variety of excess pore pressures at
different locations during PVD installation and
mandrel withdrawal. Pajouh et al. (2015) found a
slight increase in the decrease after excess pore
pressures dissipated in each of the loading stages that
may be associated with the creep phenomenon.
Sengul, et al. (2016) indicates that there are three soil
zones adjacent to PVD namely smear zone, transition
zone and undisturb zone. Choudhary et al. (2016)
evaluates the characteristics of the smear zone based
on changes in the hydraulic gradient derived from
excess pore water pressure data measured in the radial
direction.
Rujikiatkamjorn et al. (2014) stated that the soil
will significantly lose its structure after the
installation of PVD, especially in locations close to
PVD. Indraratna et al. (2015) reported the degree of
disturbance in soil in the field can be higher when the
installed PVD is longer, and the disturbance in the
soil is greater towards PVD.With reference to the
results of previous studies it is found that the extent
ratio s’ values vary between 2.0 - 6.3, and
permeability ratio κ values from 1.03 - 3.13. The
minimum values of s’=2.0, the maximum=6.0, and
the average=4.0. The range of the s’ values can be
classified as follows, low:1<s’<2, moderate: 2≤ s’
<4, and high : 4≤ s’<7. Then the value of s' laboratory
test results are mostly in the moderate to high. The
minimum values of κ = 1.03, maximum=3.13, and the
averaged= 2.0. The range of κ values can be
classified as follow, low:1< κ<4, moderate: 4≤ κ <7,
and high 7≤ κ<12. Then the value κ laboratory test
results are in the low range.
On the other hand, the range of κ value appears to
be limited within the low values.
Installation of
PVD/SD
Consolidation
Stress
Determination
s’ and κ values
Mixing the soil with
water until saturated
Putting it into a
consolidometer
Extracting
trapped air
Pre-consolidated
compression
Sample
Preparation:
On the Laboratory Testings to Characterize the Smear Zone
275
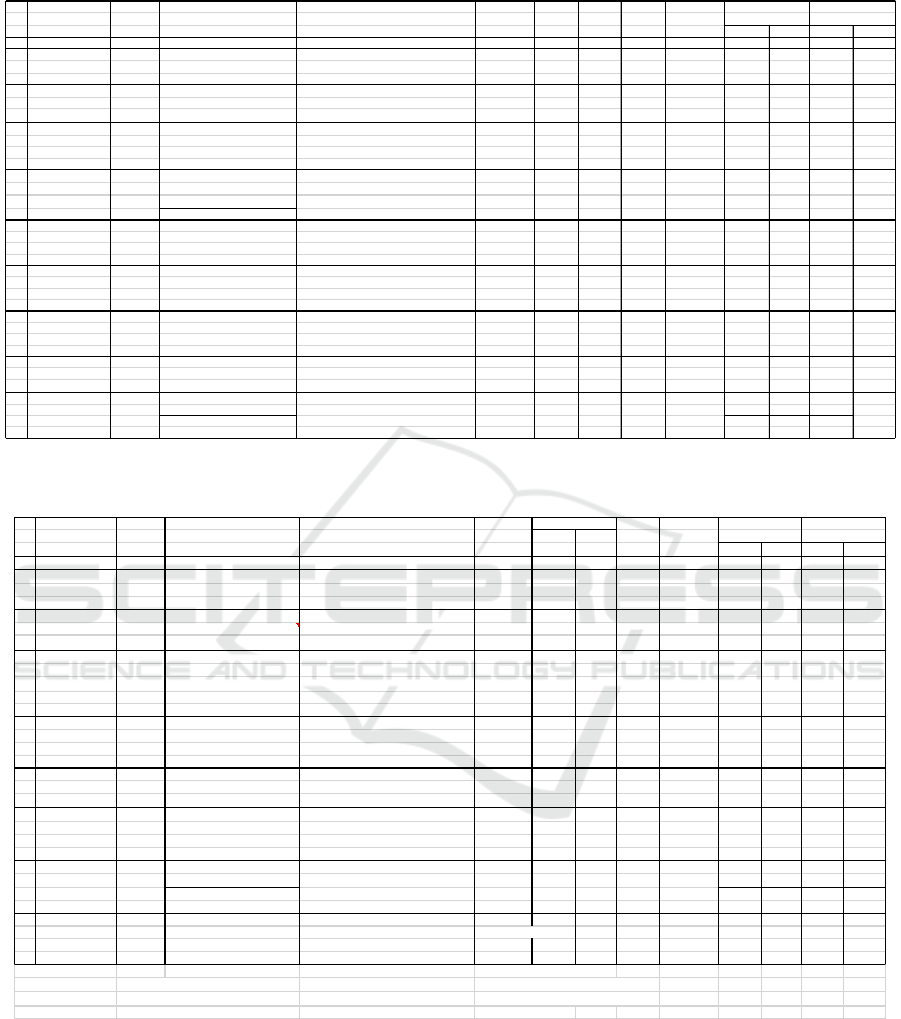
Table 1: Summary results of previous laboratory testings to characterize the smear zone
Table 2: Summary results of previous laboratory testings to characterize the smear zone (continued)
Tank Basic Soil Properties Sample Preparation Stress Speed of Determination
No. Researchers Dimension PVD Mandrel Installation Smear
(kPa) mm mm mm/s Zone r
s
/r
m
r
t
/r
m
k
h
/k
s
k
h
/k
t
12 3 4 5 6789101112
13 14
10 Ghandeharioon
h =900 mm
Reconstituted Lucustrin
Sample is mixed with water until w = 1.1
Po=20 100 x 4 - - Small 2.65 5.8 kh/kv= kh/kv=
et al. (2012) d =650 mm LL = 55 %, PL =27 %, e =1.46 x LL , placed in cell consolidometer ΔP=50 sampels 1.2-1.6 1.6-1.8
h/d =1.38 layer by layer, and compacted.
11 Chai et al. h =700 mm Reconstituted Soft Bangkok Clay Samples are placed in cell consolido- Po=50 50 x 3.5 81.9x18.2 - Back- 2,0 - 3.0 -
et al.(2013) d =450 mm w =113%,LL =104%,PL =45%, meter layer by layer. ΔP=100 recta- Calcula-
h/d =1.56
G
s
=2.66,
=14.7 kN/m
3
ngular tion
12 Rujikiatkamjorn h =561 mm Undisturb Bulli Clay The soil around the sample is dug andPo=20w=50 55x5 - Small 3.7 5.5 1.33-2.85 1.11-1.33
et al.(2014) d =345 mm w =41%, LL = 50%, PL =25%, cut from base, wrapped to ΔP=200 recta- sampels
h/d =1.60 Gs
=18.5 kN/m
3
prevent loss of w, stored in a humidity- ngular
controlled room, and placed into cell
consolidometer.
13 Indraratna et al h =25,4 mm Undisturb Ballina Clay Samples for Oedometer testing - 100x3 120x60 - Oedometer 6.3 - 2.7 -
(2015) d =63,5 mm w =94,7%,LL =98%,PL =32%, are collected from around the PVD ΔP=200 recta- test
h/d =0.40 Gs =2.58,e =2.44,γ=16.5 kN/m3 installed in the field. A series ngular
oedometer testing is performed.
14 Joseph et al. (2015) h =600 mm Reconstituted Cochin Marine Clay Sample is placed into the tank Po=5 SD. diam.50 hammer Small 5.0-6.0 - 1.3-1.4 -
d =600 mm w =112%,LL= 156%, consolidometer, with w = LL layer by ΔP=120 diam.46 circular w=2.6 kg sampels
h/d =1.00
PL =34%,G
s
=2.62 layer. h=30 cm
15 Pajouh et al.(2015)
h =200 mm
Reconstituted Kaolinite, bentonite
Samples are mixed with water to w =(1.4-1.8)
Po=20 SD. diam.25 - Directly 3.0xr
w
-4.0-
d =250 mm w =120%,LL =67-87%,PL =27-34% LL , placed into Rowe cell, and given stress ΔP=200 diam.22 circular at cell
h/d =0,80 PI =40-43% cell =110 kPa,back pressure = 100 kPa Rowe
for saturation.
16 Sengul et al. (2016) h =530 mm Reconstituted HRK,LL =51%, Samples with w equal to the Po=25 130x18 120x15 2-5 Directly 3.3 7.3 2.0 1.21
w = 350 mm
PL =26%,IP =25%,G
s
=2.60 field are placed on the box, ΔP=hydraulic recta- at SZM
t = 130mm Reconstituted CID,LL =51%, placed in SZM instrument coating, Head= ngular instrument 2.3-2.4 5.2-5.8 2.86-3.13 1.75
PL =30%,,IP =21%,Gs =2.76 and compressed with vibrator. 50
17 Choudhary et al. h =450 mm Reconstituted Balina Clay Clay is taken 2 m below ground surface, Po=20 100x4 115x10 - Directly 2.5 - 1.3 -
(2016) d =650 mm w =94%, LL = 98%, mixed with distilled water ΔP=Additional recta- at cell
h/d =0.69 PL =32%, Gs =2.6 with w = 1.4 LL , placed into cell end ngular Consoli-
consolidometer and given a light vibration. load dation
h = high r = radius Po = Pra-consolidatiion stress (+v) = With PVD + vacuum preloading
d = diameter
HRK = Hydrite R Kaolinite
ΔP = Consolidation stress
k
t
= Permeability of soil at transition zone
w = wide
CID = Craney Island Dredgings
i = Gradient hydraulic
r
t
= Equivalent radius of transition zone
t = thickness SZM = Smear Zone Model (l),(s)=Mandrel long and short axis SD = Sand Drain
Extent Ratio Permebility RatioDimension
Tank Basic Soil Properties Sample Preparation Stress Dimension Mandrel Speed of Determination
No. Researchers Dimension PVD Installation Smear
(kPa) mm mm mm/s Zone r
s
/r
m
r
t
/r
m
k
h
/k
s
k
h
/k
t
1 2 3 4 5 6 7 8 9 10 11 12
13 14
1 Bergado et al. h =920 mm Reconstituted Soft Bangkok Clay Samples are placed in cell consolidation Po=10.2 40x6 60x60 - Small 2.0 - 1.5-2.0 -
(1991) d =455 mm
=14.7 kN/m
3
, Cc =0.80, layer by layer. Sand of 5 cm thick is given ΔP=47.8 recta- sampels
h/d =2.02 Cs =0.13,e =2.3 on the surface. ngular
2 Indraratna and
h =950 mm
Reconstituted Allivial Clay, Sydnay Samples are mixed with water, placed in Po=20 SD diam.50 - Small 4.0-5.0 - kh/kv= -
Redana (1998) d =450 mm w =40%,LL =70%,PL =30%, a consolidometer cell and compacted ΔP=200 diam.46 circular sampels 1.15
h/d =2.11
G
s
=2.6,γ=17.0 kN/m
3
layer by layer.Surface is given sand 5 cm.
3 Sharma and
h =400 mm
Reconstituted Kaolinit
Kaolinite is mixed water up to w = 2 x LL ,
Po=100 SD diam.50 5.0 Small 4.0xr
w
-1.30 -
Xiao (2000) d =1.000 m
m
w =65%, LL =70%,PL =40%, put into consolidation tank and be ΔP=1,102 diam.50 circular sampels
h/d =0.40 e=1.4,Gs=2.61 vacuumed for stress at 90 kPa for
several days.
4 Indraratna and
h =950 mm
Reconstituted Allivial Clay, Moruya Samples are mixed with water up to w Po=20 100x3 125 x 25 - Small 3.0xr
w
- kh/kv= -
Rujikiatkamjorn.
d =450 mm w =45%,LL = 42%, PL=17%,
slightly larger than LL, placed in a coating, ΔP=30+50 recta- sampels 3.0xr
w
(+v) - 1.17-1.20 -
(2004)
h/d =2.11
G
s
=2.6,γ=17.0 kN/m
3
compacted using consolidometer cell. ngular
5 Sathananthan and h =1040 mm Reconstituted Allivial Clay, Moruya Clay is mixed with water, kept on Po=20 100x3 125 x 25 8.3 Small 2.5 - 1.34 -
Indraratna (2006) d =650 mm w =45%, LL = 42 %, PL =17%, container for several days, placed ΔP=200 recta- sampels
h/d =1.60 Gs =2.6,
=17.0 kN/m3 in coating consolidometer cell ngular
(150 mm/Layer), and compacted.
6 Feng and h =450 mm Reconstituted Hongkong Marine Clay is mixed with water and stored in Po=20 50x5 60x13 - Direct 2.0 - 2.00 -
Yin (2006) d =300 mm Clay, w =85,6 %, LL = 51.1 %, container for several days, placed in ΔP=80 recta- at cell
h/d =1.50 PL =26.1 %, Gs =2.58. coating consolidometer cells (150 mm/ ngular consoli-
layer) and compacted. dation
7 Shin et al. (2009) h =1000 mm Reconstituted Busan Clay The test sample passed the sieve No.40. Po=50 85x6.4 100x50 20.0 Direct 4.0-4.2 (l) - - -
d =700 mm w =56 %, LL = 46.4 % is mixed with water up to w = 2 x LL . ΔP=200 recta- at cell 3.3-3.4 (s) - - -
h/d =1.43 PL =24.1 %, Gs =2.64 The trapped air is removed by vacuum ngular consoli-
during mixing. dation
8 Saowapakpiboon h =500 mm Reconstituted Soft Bangkok Clay The sample is taken into 3-4 m from - 100 x 3.5 - - Back- 2.0 - 2.70 -
et al. (2010) d =305 mm w =113%,LL = 102%,PL =40%, the ground surface and placed in the cell ΔP=100 Calcula- 2.0 (+v) 2.50
h/d =1.64
G
s
=2.66,
=14.7 kN/m
3
. consolidometer coating. tion
9 Tran-Nguyen h =530 mm Reconstituted HRK, LL =49 %, Sample with w equal to the Po=25 100 x 3.2 15x120 1.0-2.5 Directly 3.0 (HRK) - 1.03 -
and Edil (2011) w = 350 mm PL =24 %, Gs =2.59. field is placed on the box. ΔP=Gradien. recta- at SZM -
t = 130mm Reconstituted CID LL =49 %, Placed in SZM instrument coating, hydraulic ngular instrument 4.2 (CID) - 1,25
PL =20-25 %,Gs =2.71 compressed with vibrator. i=20-30
Extent Ratio Permebility Ratio
ICOSTEERR 2018 - International Conference of Science, Technology, Engineering, Environmental and Ramification Researches
276

4 DISCUSSION
4.1 Shape and Ratio of H/Diameter of
Tank
Tank soil in the laboratory is typically cylindrical and
box. Researchers variously designed dimensions of
consolidometer tank cylinder. In column 3 of Table 1,
the diameter of the tank (d) varies from 300 mm-700
mm, the height (h) varies from 400 mm-1,000 mm,
and the h/d ratio varies from 0.4 to 2.11. There is no
agreement whether the ratio h/d>1, h/d =1 or h/d <1.
Generally the tank used has a ratio h/d > 1. However
Joseph et al. (2015) used the ratio h/d=1, while
Sharma and Xiao (2000), Indraratna et al. (2015), and
Choudhary et al. (2016), used a h/d ratio of <1. The
tank-shaped box was made by Tran-Nguyen and Edil
(2011), and further developed by Sengul et al. (2016).
4.2 Basic Soil Properties Tested
Soil stiffness depends on basic properties of the soils.
According to Sengul et al. (2015), and Sathananthan
and Indraratna (2015) the r
s
/r
m
and
r
t
/r
m
ratios depend
on the soil stiffness. For a more stiff soil the ratio is
larger than for a less stiff soil. When compared to the
soil characteristics data in column 4 of Table 1, the
sample water content w values vary between 40%-
112%, liquid limit LL between 42% -102%, plastic
limit PL between 17%-34%, specific gravity G
s
between 2.56-2.76 and unit weight γ between 14.7
kN/m
3
-18,5 kN/m
3
. The inheritance properties of the
soil tested resulted in differences in stiffness, the r
s
/r
m
and
r
t
/r
m
ratios generated.
4.3 Preparation of Soil Sample
The sample preparation data can be seen in column 5
of Table 1 of. In the disturbed sample, w when mixing
varies from the natural w in the field up to 2 times the
LL of soil. Saturation time varies from a few days to 6
months. The technique of removing the air trapped in
the soil during mixing also varies. Some use the
technique of compressing, vibrating, or vacuum. The
similar conditions occur in undisturb samples. Large
and intact samples were taken from the field for
testing on consolidometer cells with small samples
taken for oedometer testing. Different preparation of
soil samples resulted in different s' and κ ratios being
generated.
4.4 Pre-consolidated Stress P
o
This Stress represents the amount of existing stress
acting on the soil. Refering to column 6 of Table 1 the
magnitude varies from 5 kPa-1,100 kPa. This
difference results in the difference in s' and κ values
generated.
4.5 Consolidation Stress ΔP
Refering to column 6 of Table 1 the consolidation
stress varies from 80 kPa-1,102 kPa. Sengul, et al.
(2016) concluded the decrease of k
h
/k
s
and k
h
/k
t
in
smear and transition zone is affected by the increased
of the consolidation stress. Sharma and Xiao (2000),
and Sathananthan and Indraratna (2006) concluded
that κ decreases with the increasing pressure of
consolidation on the ground. Indraratna and Redana
(1998) concluded that smear effects are limited within
short to medium term consolidation. The difference in
consolidation stress causes the variation in s' and κ
ratios.
4.6 Use of Reconstituted Soil Samples
Tran-Nguyen and Edil (2011) who used reconstituted
samples reported that the extent and permeability
ratios measured in their laboratory study were at the
lower limit reported in the literature. This is due to the
fact that soils were very disturbed and had no
structure, thus less susceptible to disturbance. The
laboratory testing using undisturbed soil samples was
done by Rujikiatkamjorn et al. (2014) who found that
permeability reductions were almost twice as much as
those using disturbed soil. On the other hand Bo et al.
(2003) suggested that the smear zone could become
larger in undisturbed soils due to the destruction of the
soil structure. Nevertheless the condition of the soil in
the field is typically intact, leading to the higher
values of s’ and κ ratios. Tests that use reconstituted
and undistub samples are indicated in column 4 of
Table 1.
4.7 Mandrel Shape and Dimensions
The PVD installation in the laboratory is performed
using a mined mandrel of unequal shape and size as
presented in column 8 of Table 1 of. Sathananthan and
Indraratna (2015) said the s’ ratio depends on the
dimensions of mandrel used. Tran-Nguyen and Edil
(2011) suggested the size and shape of mandrel is an
important factor affecting s'. Shin et al. (2009)
denoted a non-spherical shape of the smear zone but
the ellip with a greater range on the longer mandrel
On the Laboratory Testings to Characterize the Smear Zone
277

side compared to the short side. These differences in
mandrel shape and dimensions cause the resulting s'
and κ values to be different.
4.8 Speed of PVD Installation
Due to the absence of a standardized speed, the
researchers used varied between 0.5 mm/s-20 mm/s as
presented in column 9 of Table 1. Sathananthan and
Indraratna (2006) said the s’ ratio value depends on
the installation speed. If the installation speed is
faster, the disturbance on the ground will increase and
thus the permeability ratio κ will increase. The
existence of the speed difference affect the value of s'
and κ generated.
4.9 Determination Method of Smear
Zone Characteristics
There are three ways to determine the characteristics
of smear zone in the laboratory use of small diameter
samples, back calculation and direct measurements in
large-diameter consolidation cells. Using small
diameter samples was performed by sampling small
diameters of large diameter consolidation cells for
oedometer testing. The determination of value is done
using Terzaghi 1-D consolidation theory. With the
measured distance of sampling to PVD and k value,
the changes of k value to PVD distance can be
detected and the smear zone characteristics can be
determined. The method of back calculation of
laboratory testing data to determine the value of
consolidation coefficient in horizontal direction c
h
based on the Asaoka method [1978] and Hansbo
[1987] is done by adjusting the time-settlement curve,
then obtaining s' and κ. Measuring directly in SZM
(Smear Zone Model) intruments, cell Rowe and
consolidation cells was also performed by
researchers. The methods of determination of smear
zone characteristics are presented in column 10 of
Table 1.
5 CONCLUSIONS
There are no standards established to be used as
references in laborary testing. The resulting smear
zone parameter values are various due partly to
different set up of laboratory equipment. With
reference to the results of the previous studies it is
found that the extent ratio s’ values varies between 2.0
- 6.3 and the permeability ratio κ values from 1.03 -
3.13.
ACKNOWLEDGEMENTS
The authors gratefuly acknowledge the financial
assistance from the University of Sumatera Utara
(Research Contracts Fiscal Year 2018, Number:
2590/UN5.1.R/ PPM / 2017 dated March 16, 2018).
The contribution from Nurhayani Simamora in typing
and formating the paper is appreciated.
REFERENCES
Bergado, D. T., Asakami, H., Alfaro, M. C, and
Balasubramaniam, A.S., 1991. “Smear effects of
vertical drains on soft Bangkok clay, Geotechnical
Engineering”, ASCE, Vol. 117, No. 10, pp 1509-1529.
Indraratna, B. and Redna, I. W., 1998 “Laboratory
determination of smear zone due to vertical drain
installation”, ASCE, J. Geotechnical &
Geoenvironmental Engineering, Vol. 124, No. 2, pp 180
- 184.
Sharma, J. S. and Xiao D. 2000. “Characterization of a
smear zone around vertical drains by large-
scalelaboratory tests”, Canadian Geotechnical, Vol. 37,
No. 6, pp 1265-1271.
Indraratna, B. and Rujikiatkamjorn, C., 2004. “Laboratory
determination of efficiency of prefabricated vertical
drains incorporating vacuum preloading”, the 15
th
Southeast Asian geotechnical conference, vol. 1, pp
453-456.
Sathananthan, I., and Indraratna, B., 2006 “Laboratory
evaluation of smear zone and correlation correlation
between permeability and moisture content, Journal of
Geotechnical and Geoenvironmental Engineering”,
ASCE, Vol. 132, No. 7, pp 942 - 945.
Fang, Z., and Yin, J. H., 2006. “Physical modelling of
consolidation of Hong Kong marine clay with
prefabricated vertical drains, Canadian Geotechnical
Journal, Vol. 43, pp 638-652.
Shin, D.H., Lee, C, Lee J.S., and Lee, W., 2009. “
Detection of smear zone using micro-cone and electrical
resistance probe”, Canadian Geotechnical Journal,
Vol. 46(6), pp 719-726.
Saowapakpiboon, J., Bergado, D. T., Youwai, S., Chai,
J.C., Wanthong, P., and Voottipruex, P., 2010.
“Measured and predicted performance of prefabricated
vertical drains (PVDs) with and without vacuum
preloading Geotextiles and Geomembranes”, 28 Issue
1, pp 1–11.
Tran-Nguyen, H.H., Edil,T.B., “The characteristic of PVD
smear zone”, Geo-Frontier 2011 @ASCE 2011, pp
748-757. 2011.
Ghandeharioon, A., Indraratna, B., and Rujikiatkamjorn, C.,
2012 “Laboratory and finite-element investigation of
ICOSTEERR 2018 - International Conference of Science, Technology, Engineering, Environmental and Ramification Researches
278

soil disturbance associated with the installation of
mandrel-driven prefabricated vertical drains”, J
Geotech Geoenviron Eng 138(3) pp 295–308.
Chai, J.C., Bergado, D. T., and Shen, S. L., 2013.
“Modelling prefabricated vertical drain improved
ground in plane strain analysis”, Proceedings of the
Institution of Civil Engineers pp 65-77.
Rujikiatkamjorn,C.. Indraratna, B., and Ardana,M.D.W.
2014.,“Smear zone characterization associated with
vertical drain installation”, Proceedings of Soft Soils
October 20-23
rd
2014 pp. F1-1 - F1-8.
Indraratna, B. , Perara, D.,Rujikiatkamjorn C., and Kelly,
R., 2015. “Soil Distubance analysis due tovertical drain
instalation, Proceedings of the institution of Civil
Engineering”, Geotechnical Engineering, 168 (3)
pp.236-246.
Joseph,A, Chandrakaran.S,Sankar.N, Jose.B.T., 2015.
“Laboratory Evaluation of Extent of Smear Zone Due to
Columnar Intrusion for Cochin Marine Clays”, 50
th
Indian Geotechnical Conference, 17
th
–19
th
December
2015.
Pajouh,A.P., Fatahi,B.,and Khabbaz,H., 2015.
“Experimental and Numerical Investigations to
Evaluate Two-Dimensional Modelling of Vertical
Drain–Assisted Preloading”, Int. J. Geomech. pp1-14.
Sengul, T., Edil, T., and Ozaydin, K., 2016. “Laboratory
determination of smear and transition zones Due to
prefabricated vertical drain installation”. Marine
Georesources & Geotechnology, pp.
Choudhary, K., Indraratna, B., and Rujikiatkamjorn C.,
2016. “Pore pressure based method to quantify smear
around a vertical drain”, Géotechnique Letters pp 1–
5.
ASTM D 2435-96 Standard Test Method for One-
dimensional Consolidation properties of Soils
Liu, M. D., and Carter J. P., 2000. “Modelling the
destructuring of soils during virgin
Compression”,Géotechnique, 50(4), pp 479 – 483.
Bo, M.W., Chu, J., and Choa, V., 2003. “Soil improvement:
Prefabricated Vertical drain techniques”, Thompson,
Singapore, 341 pp.
Tavenas, F. et al., 1986. “In situ Measurement of
Permeability in Soft Soil”, ASCE Special Conference
on Use of In-Situ Test in Geotechnical Engineering, pp
1034-1048.
Asaoka, A., 1978. “Observational procedure of settlement
prediction”, Soil Found., 8(4) pp 87-101.
Hansbo, S., 1987. “Design aspects of vertical drains and
lime column installation”. Proc, 9
th
Southeast Asian
Geotech. Conf., Bangkok, Thailand pp 8-1-8-12.
On the Laboratory Testings to Characterize the Smear Zone
279
