
Application of Buoyancy Weighing-bar Method to Measure the
Droplet Size Distribution of Kerosene in Water
R. Tambun
1*
, P. Sibagariang
1
, B. Alphantaria
1
, A. A. Silaen
1
, A. M. Rambe
1
and F. Batubara
1
1
Chemical Engineering Department, Universitas Sumatera Utara, Padang Bulan, Medan 20155, Indonesia
Keywords: Buoyancy Weighing Bar, Droplet Size Distribution, Kerosene, Water, Separation Time.
Abstract: Buoyancy Weighing-Bar Method has been proven to be capable of measuring the particle size distribution of
the settling particles and floating particles. Besides a simple operations and low-cost equipment, the Buoyancy
Weighing-Bar Method could produce high accuracy results in measurement of particle size distribution. In
this study, the Buoyancy Weighing-Bar Method is developed to measure droplet size distribution in the liquid-
liquid systems. The samples used in this study are the mixture of kerosene of 1% in water of 99%, the mixture
of kerosene of 2% in water of 98%, the mixture of kerosene of 3% in water of 97%, the mixture of kerosene
of 4% in water of 96%and the mixture of kerosene of 5% in water of 95%. This study also decides the
separation time of kerosene – water mixtures. The weighing-bar’s diameter is 15 mm, and the vessel’s
diameter is 65 mm. The result by the Buoyancy Weighing-Bar Method are checked by using the gas
chromatography to verify the purity of sample, and the droplet size distribution of kerosene in water is
calculated by Stokes formula and compared to that measured by Coulter LS100. Based on the results obtained,
the Buoyancy Weighing-Bar Method can decide the separation time of kerosene and water mixtures, and the
droplet size distribution that calculated by Stoke formula is proportional to the Coulter L100.
1 INTRODUCTION
Application of buoyancy weighing-bar method had
been done for measurement particle size distribution
either floating particles or settling particles (Obata, et
al., 2009; Motoi, et al., 2010). In this
Buoyancy
Weighing-Bar Method, the density change of solution
due to droplet migration is determined by weighing
buoyancy against a weighing bar hung in the
suspension. Theoretically, the Buoyancy Weighing-
Bar Method also could be applicable to measure
droplet size distribution either in Stoke region or
Allen region (Obata, et al., 2009; Motoi, et al., 2010;
Tambun, et al., 2011; Tambun, et al., 2012a; Tambun,
et al., 2012b; Tambun, et al., 2018). In this study, the
Buoyancy Weighing-Bar Method will determine the
measure droplet size distribution for liquid-liquid
systems with the different density. The measure
droplet size distribution had been investigated by
using light scattering method (Mao, et al., 1998),
microscope (Boxall,et al., 2010), nuclear magnetic
resonance (Fridjonsson, et al., 2014), and laser
diffraction with a Coulter LS-230 (Jurado, et al.,
2007). In a short time, all methods can give highly
precise results but require extremely expensive
equipment. Hence, the
Buoyancy Weighing-Bar Method
will be a low cost method in droplet size distribution
determination.
The principle of Buoyancy Weighing-Bar Method
that measurement the density change in a suspension
due to liquid migration is determinated by weighing
buoyancy against a weighing bar hung in the
suspension. The tools of Buoyancy Weighing-Bar
Method consists of an analytical balance with a hook
for under-floor weighing and a weighing bar, which
is used to determine the density change of suspension
(Obata, et al., 2009; Motoi, et al., 2010). Besides, the
Buoyancy Weighing-Bar Method has been proven to
be able to estimate the fine particles by using the
Rosin-Rammler equation (Tambun, et al., 2016).
In this study, Buoyancy Weighing-Bar Method
will be applied in liquid-liquid systems of different
densities, where in this experiment the sample used is
kerosene and water (O/W) mixture. The Buoyancy
Weighing-Bar Method used to investigate the
measure droplet size distribution of kerosene in water
(O/W) and the separation time of kerosene – water
mixture. The principle of this study is similar to
distributions system of the settling particles and
floating particles, where the initial buoyant mass of
Tambun, R., Sibagariang, P., Alphantaria, B., Sialaen, A., Rambe, A. and Batubara, F.
Application of Buoyancy Weighing-bar Method to Measure the Droplet Size Distribution of Kerosene in Water.
DOI: 10.5220/0010087402910296
In Proceedings of the International Conference of Science, Technology, Engineering, Environmental and Ramification Researches (ICOSTEERR 2018) - Research in Industry 4.0, pages
291-296
ISBN: 978-989-758-449-7
Copyright
c
2020 by SCITEPRESS – Science and Technology Publications, Lda. All rights reserved
291
the weighing bar according to the mixtures of liquid
between the bottom and top of the weighing bar in a
suspension (Tambun, et al., 2018a; Tambun, et al.,
2018b).
2 METHODS
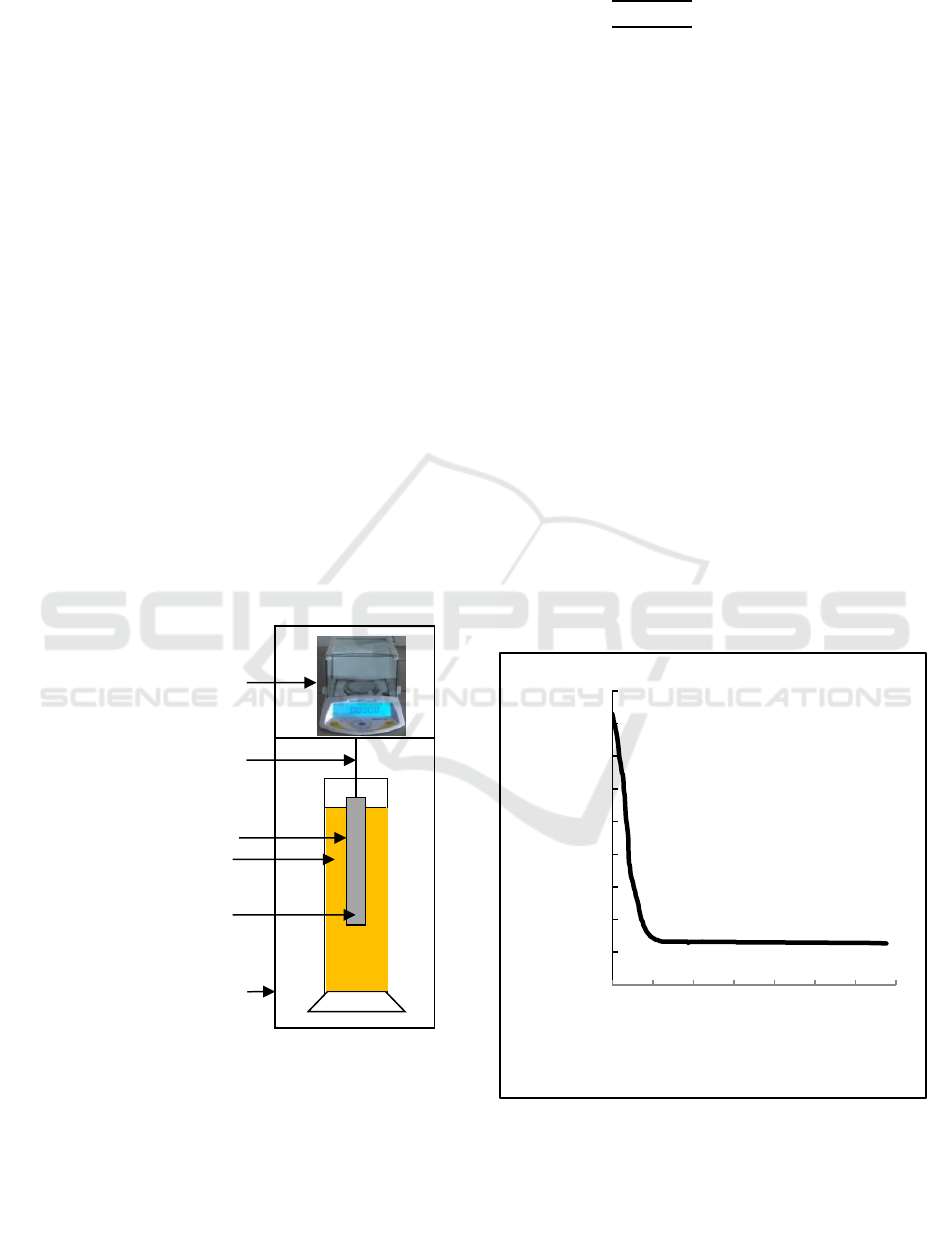
The illustration of the experimental apparatus is
shown at Figure 1. The weighing bar is made of
aluminum rod with the diameter of 15 mm, the length
of 210 mm, and the density of 2700 kg/m
3
. The
sample materials are water (ρ= 0.99708 g/cm
3
) and
kerosene (ρ= 0.810 g/cm
3
). The material samples is
put into glass cylinder with volume 1000 ml
(diameter: 65 mm) with the mixture of kerosene of
1% in water of 99%, the mixture of kerosene of 2%
in water of 98%, the mixture of kerosene of 3% in
water of 97%, the mixture of kerosene of 4% in water
of 96%and the mixture of kerosene of 5% in water of
95%. All experiments are operated at room
temperature (approximately 298 K). The measuring
time is 1 h and the measure droplet size distribution
is calculated by Stokes formula and the result is
compared to that measured by Coulter LS100.
Figure 1: Schematic diagram of experiment to measure
droplet size distribution of O/W by using Buoyancy
Weighing-Bar Method.
The Stokes formula can be seen in equation 1 below:
𝑥
(1)
where g is the gravitational acceleration and
μ
L
is the
viscosity of the solution. The stokes equation applies
only to laminar flow types with Reynold Numbers,
Rep < 0,2 (Allen T, 1990). After the separations time
of samples are obtained from this research, the purity
of samples are then analyzed by using gas
chromatography.
3 RESULTS AND DISCUSSION
3.1 Effect of Time on Apparent Mass of
the Weighing-Bar When
Comparison of O/W Water is 1 % :
99%
Figure 2 shows the correlation between apparent mass
of the weighing-bar and time when comparison 1% :
99% of O/W is used. In the figure 2, the apparent
mass of the weighing-bar decreased until all the
kerosene floated above the weighing-bar, and then the
apparent mass of the weighing-bar become constant.
Figure 2: The correlation between apparent mass of the
weighing-bar with the time separation when comparison of
O/W is 1 % : 99%.
The mass of weighing bar is decreased rapidly
from beginning (at 0 second) until at 100 seconds and
68,56
68,57
68,58
68,59
68,60
68,61
68,62
68,63
68,64
68,65
0 100 200 300 400 500 600 700
Apparent Mass (10⁻⁶ kg)
Time (second)
Analytical balance
Hanging wire
Weighing bar
Insulation vessel
Graduated cylinder
Liquids (O/W)
ICOSTEERR 2018 - International Conference of Science, Technology, Engineering, Environmental and Ramification Researches
292
then the mass of weighing-bar tends to be constant. In
this experiment, the weighing bar detect that all of the
larger droplets have floated after 100 seconds. This is
because the largest droplets will float first, then the
medium droplets and the smaller droplet, so the
weighing-bar mass decrease gradually and then
constant after all the droplets is floating above the
weighing bar. The results obtained by the Buoyancy
Weighing-Bar Method are compared with those
measured by gas chromatography. At 100 seconds of
experiment, the purity of water is 94.9496% and at
680 seconds the purity of water is 97.1326%. At this
experiment, at 680 seconds the mass of weighing-bar
had not changed again and the water and kerosene are
already separate but not complete. Hence, the
separation time of O/W had been detected by using
the Buoyancy Weighing-Bar Method.
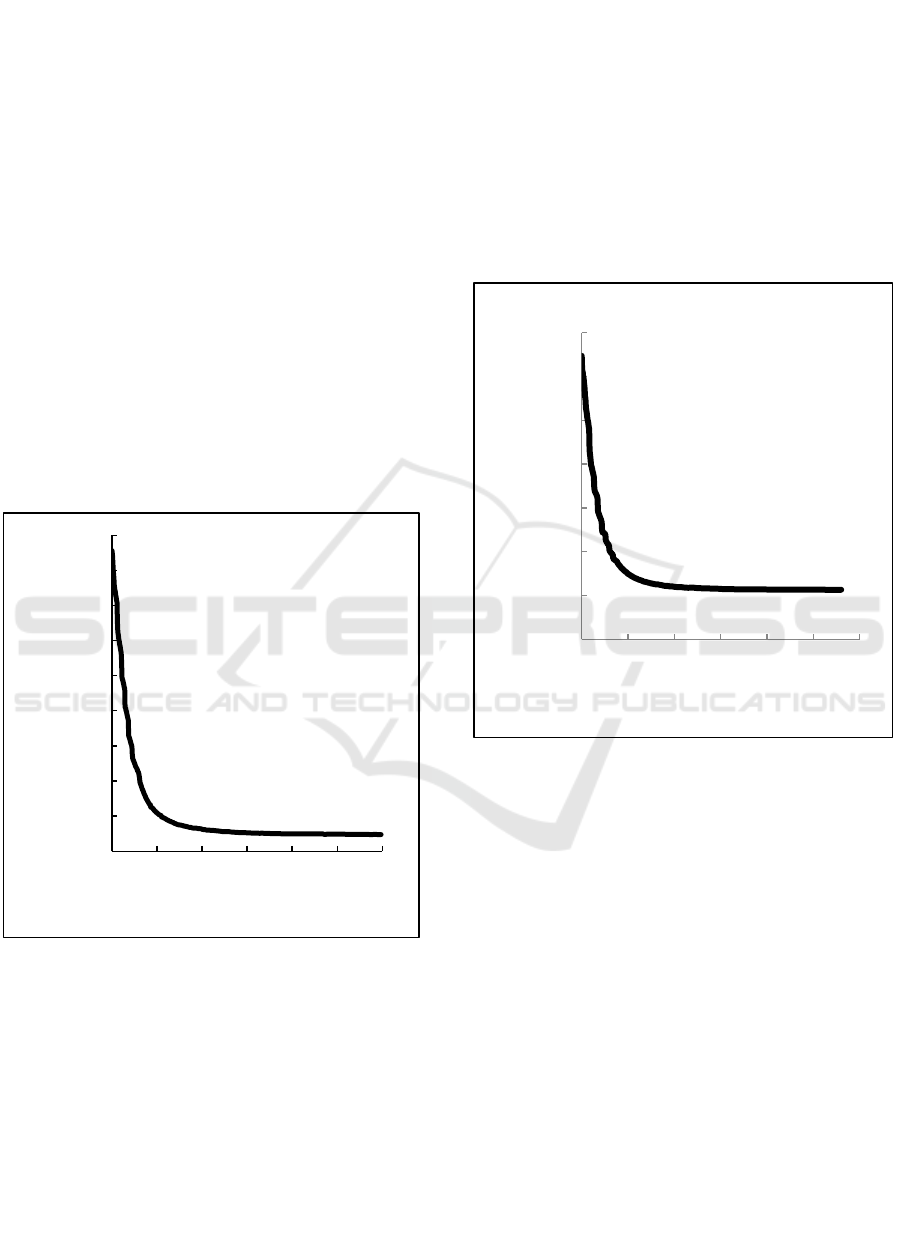
3.2 Effect of Time on Apparent Mass of
the Weighing-Bar When
Comparison of O/W is 2 % : 98%
Figure 3: The correlation between apparent mass of the
weighing-bar with the time separation when comparison of
O/W is 2 % : 98%.
Figure 3 shows the correlation between apparent
mass of the weighing-bar with the time separation
when comparison of O/W is 2 % : 98%. Similar with
the figure 3, the mass of weighing bar is decreased
rapidly from beginning until at 146 seconds and then
the mass of weighing-bar tends to be constant. In this
experiment, the weighing bar detect that all of the
larger droplets have floated after 146 seconds. This is
because the largest droplets will float first, then the
medium droplets and the smaller droplet, so the
weighing-bar mass decrease gradually and then
constant after all the droplets is floating above the
weighing bar. At this experiment, at 597 seconds the
mass of weighing-bar has been constant and the water
and kerosene are already separate but not complete.
3.3 Effect of Time on Apparent Mass of
the Weighing-Bar When
Comparison of O/W is 3 % : 97%
Figure 4: The correlation between apparent mass of the
weighing-bar with the time separation when comparison of
O/W is 3 % : 97%.
Figure 4 shows the correlation between apparent
mass of the weighing-bar with the time separation
when comparison of O/W is 3 % : 97%. At this
comparison, the mass of weighing bar is decreased
rapidly from beginning until at 157 seconds and then
the mass of weighing-bar tends to be constant. In this
experiment, the weighing bar detect that all of the
larger droplets have floated after 157 seconds. This is
because the largest droplets will float first, then the
medium droplets and the smaller droplet, so the
weighing-bar mass decrease gradually and then
constant after all the droplets is floating above the
weighing bar. At this experiment, at 560 seconds the
mass of weighing-bar has been constant and the water
and kerosene are already separate but not complete.
68,78
68,8
68,82
68,84
68,86
68,88
68,9
68,92
68,94
68,96
0 100 200 300 400 500 600
Apparent Mass (10⁻⁶ kg)
Time (second)
67,80
67,85
67,90
67,95
68,00
68,05
68,10
68,15
0 100 200 300 400 500 600
Apparent Mass (10⁻⁶ kg)
Time (second)
Application of Buoyancy Weighing-bar Method to Measure the Droplet Size Distribution of Kerosene in Water
293
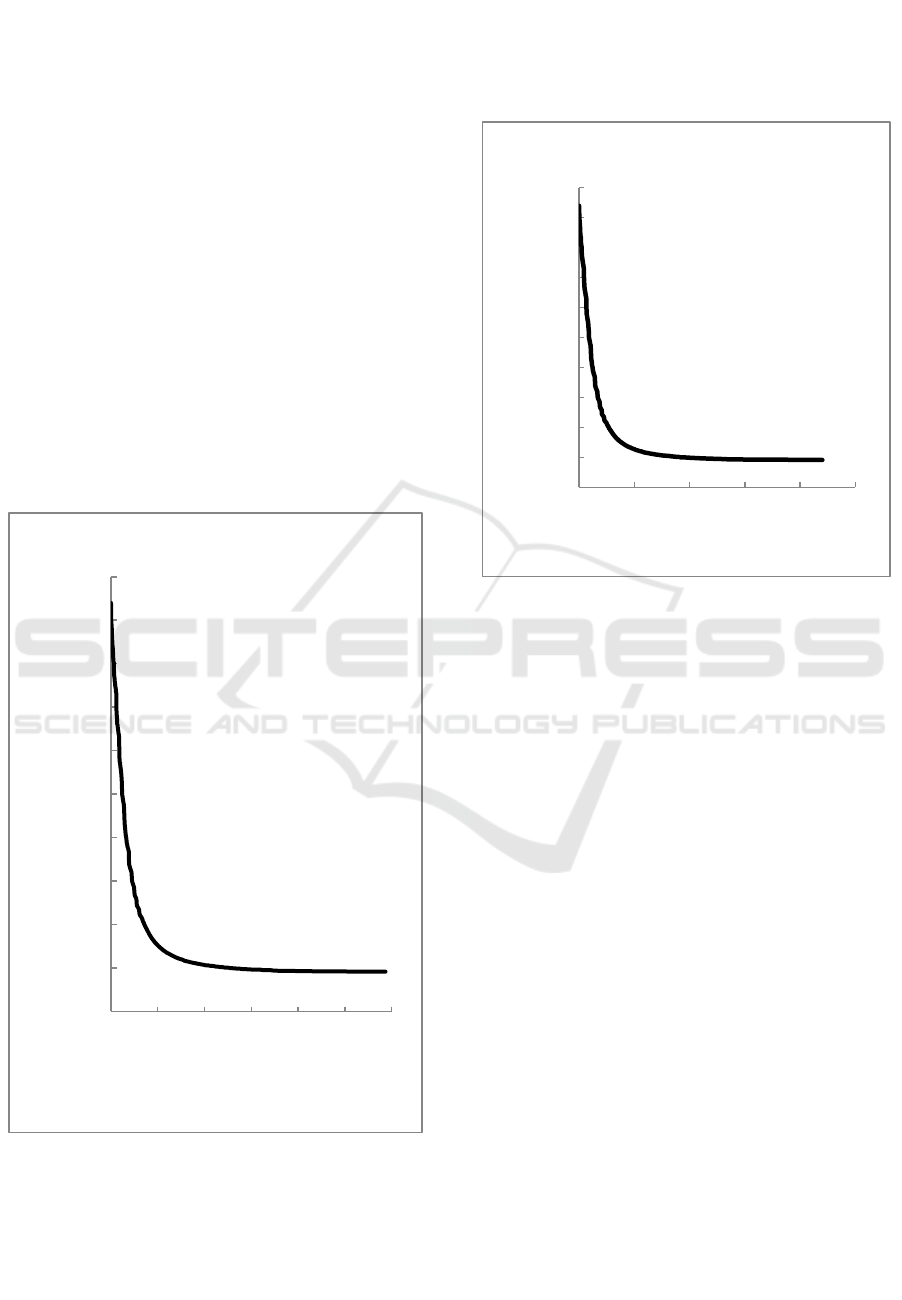
3.4 Effect of Time on Apparent Mass of
the Weighing-Bar When
Comparison of O/W is 4 % : 96%
Figure 5 shows the correlation between apparent mass
of the weighing-bar with the time separation when
comparison of O/W is 4 % : 96%. At this comparison,
the mass of weighing bar is decreased rapidly from
beginning until at 164 seconds and then the mass of
weighing-bar tends to be constant. In this experiment,
the weighing bar detect that all of the larger droplets
have floated after 146 seconds. This is because the
largest droplets will float first, then the medium
droplets and the smaller droplet, so the weighing-bar
mass decrease gradually and then constant after all
the droplets is floating above the weighing bar. At this
experiment, at 870 seconds the mass of weighing-bar
has been constant and the water and kerosene are
already separate but not complete.
Figure 5: The correlation between apparent mass of the
weighing-bar with the time separation when comparison of
O/W is 4 % : 96%.
3.5 Effect of Time on Apparent Mass of
the Weighing-Bar When
Comparison of O/W is 5 % : 95%
Figure 6: The correlation between apparent mass of the
weighing-bar with the time separation when comparison of
O/W is 5 % : 95%.
Figure 6 shows the influence of time separation on
apparent mass of the weighing-bar when comparison
of O/W is 5 % : 95%. At the figure 6, we could see
that mass of weighing bar is decreased rapidly from 0
second until at 245 seconds and then the mass of
weighing-bar tends to be constant. In this experiment,
the weighing bar detect that all of the larger droplets
have floated after 245 seconds. This is because the
largest droplets will float first, then the medium
droplets and the smaller droplet, so the weighing-bar
mass decrease gradually and then constant after all
the droplets is floating above the weighing bar. At this
experiment, at 880 seconds, the mass of weighing-bar
has not changed again and the water and kerosene are
already separate but not complete.
3.6 Determination Measure Droplet
Size Distribution by using
Buoyancy Weighing-Bar Method
Figure 7 shows the measure droplet size distribution
measured by using Buoyancy Weighing-Bar Method
when the concentration 99% water : 1% kerosene.
The measure droplet size distribution is calculated by
68,55
68,60
68,65
68,70
68,75
68,80
68,85
68,90
68,95
69,00
69,05
0 150 300 450 600 750 900
Apparent Mass (10⁻⁶ kg)
Time (second)
68,55
68,60
68,65
68,70
68,75
68,80
68,85
68,90
68,95
69,00
69,05
0 200 400 600 800 1000
Apparent Mass (10⁻⁶ kg)
Time (second) Time (second)
ICOSTEERR 2018 - International Conference of Science, Technology, Engineering, Environmental and Ramification Researches
294
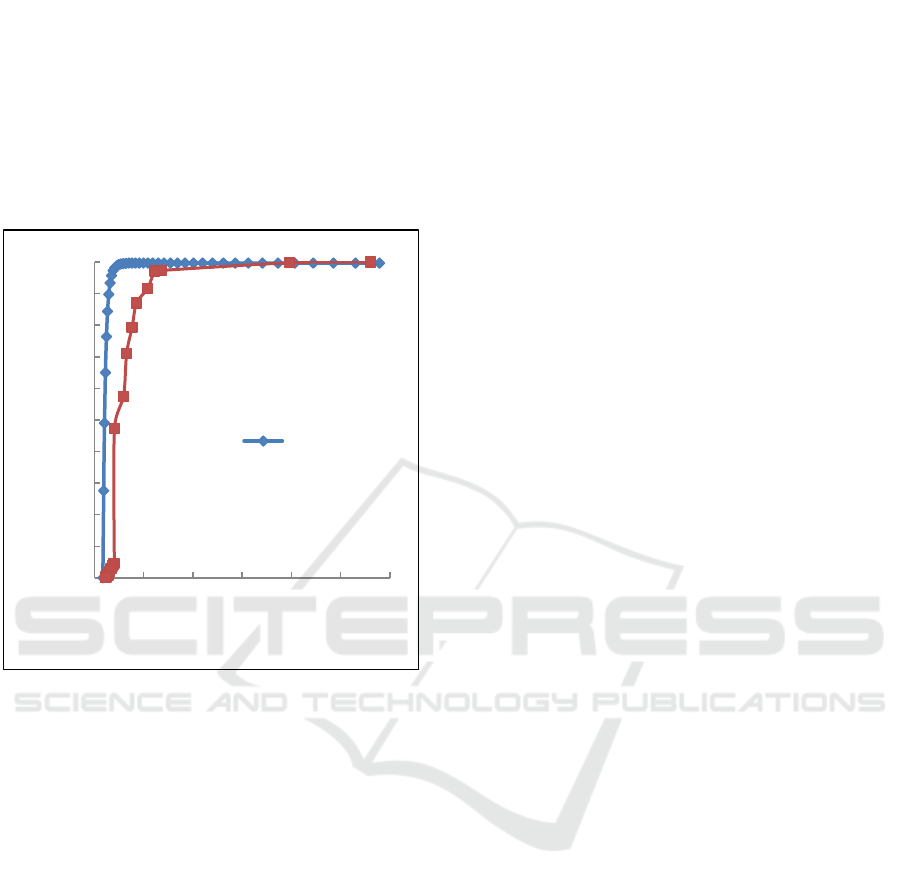
Stokes formula, and the results obtained are
compared with Coulter LS 100. The result obtained
by measuring the BWM is comparable to that
measured by Coulter LS100. In figure 5 can be seen
that the results obtained by Buoyancy Weighing-Bar
Method and Coulter are close. According to these
results, Buoyancy Weighing-Bar Method could identify
the measure droplet size distribution of O/W when
comparison of O/W is 1% : 99%.
Figure 7: The measurement comparison of droplet size
distribution of O/W between BWM and Coulter LS 100
when comparison of O/W is 1 % : 99%.
4 CONCLUSION
The Buoyancy Weighing-Bar Method has been
applied to experimentally investigate the droplet size
distribution of O/W and to detect the separation time
of O/W mixtures. The conclusions of this study are:
1. The Buoyancy Weighing-Bar Method could
identify the droplet size distribution of O/W when
comparison of O/W is 1% : 99% by using Stoke
equation, and the precision of result is near to that
measured by a Coulter LS100.
2. The
Buoyancy Weighing-Bar Method could decide
the separation time of O/W mixtures when
comparison of O/W are 1% : 99%, 2% : 98%, 3% :
97%, 4% : 96% and 5% : 95%.
3. The separation time for each comparison of O/W
is different.
ACKNOWLEDGEMENT
This research is supported by Directorate of Research
and Community Service (DRPM) of the Ministry of
Research, Technology, and Higher Education of
Republic Indonesia for Research Grant, under
Fundamental Research scheme, 2018.
REFERENCES
Allen, T, Particle Size Measurement, Fourth Edition,
London : Chapman and Hall, 1990.
Boxall, J. A., Koh, C. A., Sloan, E. D., Sum, A. K., and Wu,
D. T. (2010). Measurement and calibration of droplet
size distribution in water in oil emulsion by particle
video microscope and focused beam reflectance
method. Ind. Eng. Chem. Res. 49(3) pp 1412-1418.
Fridjonsson, E. O., Graham, B. F., Akhfash, M., May, E. F.,
and Johns, M. L. (2014). Optimized droplet sizing of
water in crude oil emulsion using nuclear magnetic
resonance. Energy & Fuels. 28(3) pp 1756-1764.
Jurado, E., Bravo, V., Camacho, F., Vicaria, J. M., and
Arteaga, A. F. (2007). Estimation of the distribution of
droplet size, interfacial area and volume in emulsions.
Colloids and Surfaces A: Physicochem. Eng. Aspects.
295 pp 91-98.
Mao, Y., Yong, L., Tao, H., Shimin, W., and Yiqian, X.
(1998). In situ measurement of droplet size distribution
by light scattering method. Wuhan University Journal
of Natural Sciences. 3(4) pp 418-422.
Motoi, T., Ohira, Y., and Obata, E. (2010). Measurement of
the floating particle size distribution by buoyancy
weighing–bar method. Powder Technology. 201 pp
283–288.
Obata, E., Ohira, Y., and Ohta, M. (2009). New
measurement of particle size distribution by buoyancy
weighing–bar method. Powder Technology. 196 pp
163–168.
Tambun, R., Furukawa, K., Hirayama, M., Shimadzu, M.,
Yamanaka, S., and Ohira, Y. (2016). Measurement and
estimation of the particle size distribution by the
buoyancy weighing-bar method and the Rosin-
Rammler equation. Journal of Chemical Engineering of
Japan. 49 (2) pp 229-233.
Tambun, R., Motoi, T., Shimadzu, M., Ohira, Y., and
Obata, E. (2011). Size distribution measurement of
floating particles in the allen region by a buoyancy
weighing–bar method. Advanced Powder Technology.
22 pp 548–552.
Tambun, R., Nakano, K., Shimadzu, M., Ohira, Y., and
Obata, E. (2012). Sizes influences of weighing bar and
vessel in the buoyancy weighing-bar method on
floating particle size distribution measurements.
Advanced Powder Technology. 23 pp 855-860.
Tambun, R., Shimadzu, M., Ohira, Y., and Obata, E.
(2012). Definition of the new mean particle size based
0
0,1
0,2
0,3
0,4
0,5
0,6
0,7
0,8
0,9
1
0 25 50 75 100 125 150
Cumulative mass undersize (%)
Droplet size (μm)
Coulter LS
100
Application of Buoyancy Weighing-bar Method to Measure the Droplet Size Distribution of Kerosene in Water
295

on the settling velocity in liquid. Journal of Chemical
Engineering of Japan. 45 (4) pp 279-284.
Tambun, R., Sibagariang, P., Alphantaria, B., and Rambe,
A. M. (2018). Droplet size distribution measurement of
water in kerosene by the buoyancy weighing-bar
method. MATEC Web of Conferences. 154.
Tambun, R., Sibagariang, Y., J Manurung, J.2018.
Influence of the Weighing Bar Size to Determine
Optimal Time of Biodiesel-Glycerol Separation by
Using the Buoyancy Weighing-Bar Method.
TALENTA-CEST 2017. IOP Conf. Series: Materials
Science and Engineering. 309.
Tambun, R., Sihombing, R. O., Simanjuntak, A., F Hanum,
F. 2018. Influence of the weighing bar position in
vessel on measurement of cement’s particle size
distribution by using the buoyancy weighing-bar
method. TALENTA-CEST 2017 IOP Conf. Series:
Materials Science and Engineering. 309.
ICOSTEERR 2018 - International Conference of Science, Technology, Engineering, Environmental and Ramification Researches
296
