Sensornet Early-warning System Integration
Stefania Nanni
1
and Gianluca Mazzini
2
1
Area R&P, LepidaSpa, Viale della Liberazione 15, 40128 Bologna, Italy
2
Engineering Department, University of Ferrara, Via Saragat 1, 44122 Ferrara, Italy
Keywords: Sensornet Platform, Early-warning System, Hydrological Simulation Model, Meteorological Modeling,
Extreme Rainfall Phenomena.
Abstract: In order to increase the resilience of the regional territory to extreme rainfall phenomena, LepidaSpA has
enhanced an already existing IOT platform, Sensornet, created to manage heterogeneous sensor networks
extended all over the entire territory of the Emilia-Romagna Region, introducing some new data not related
to physical measures, such as rivers level or amount of rainfall, but to their forecast. The novelty and the
strategic importance of the project presented in this paper is the incremental integration within Sensornet
platform of virtual sensors, based on hydrological simulation models and meteorological modelling, sharing
the same data model initially defined for physical ones, thus making available not only the continuous
monitoring of phenomena and their evolution, but also the generation of early warning in case of critical
thresholds with a forecast up to 12/24 hours. The capability to detect forerunners constitutes a fundamental
requirement to increase the ability to recognize in advance critical scenarios and to support their
management.
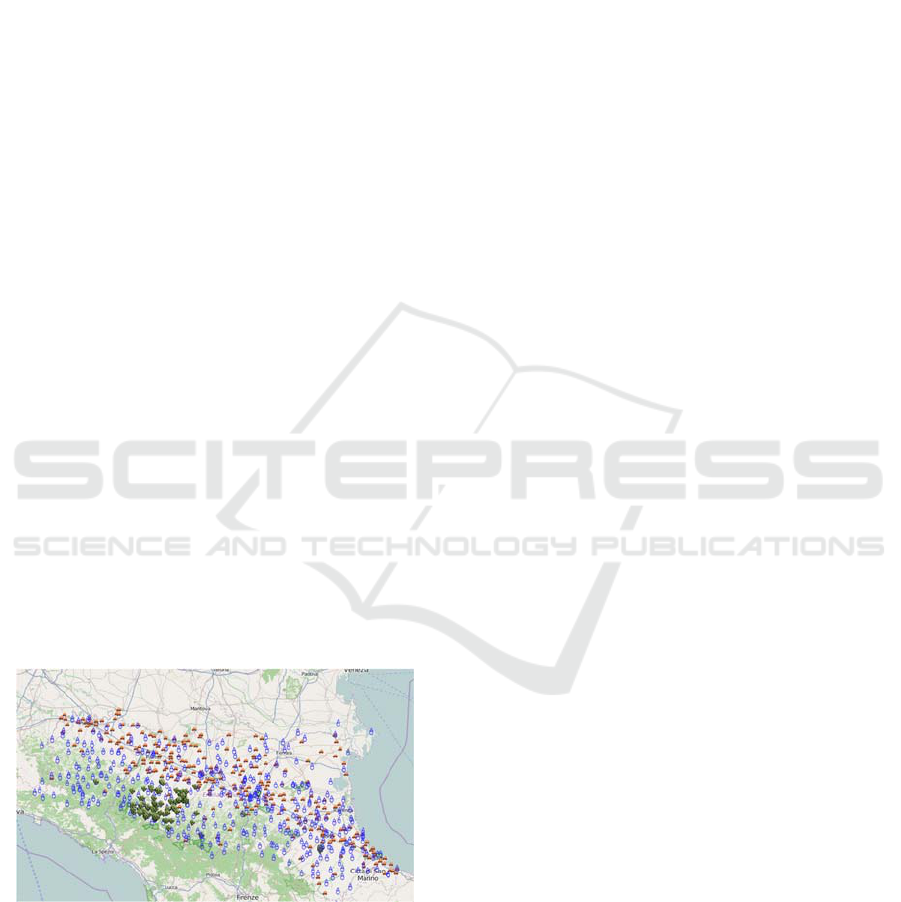
1 INTRODUCTION
Sensornet is the Internet of Things Platform of the
Emilia-Romagna Region, collecting data and
information from thousands of objects distributed
across the territory, and building in time a digital
map of the reality we live in Figure 1.
Figure 1: Sensornet platform.
Whether they are generated by inclinometers for
landslide monitoring, hydrometric sensors for the
level river control, or inductive coils for the traffic
monitoring, data generated by the sensors define a
snapshot of a reality made of continuously updating
information, allowing a better knowledge of what is
happening in cities and in territories (Nanni and
Mazzini, 2015).
The platform collects measures taken in real time
from different sensors and handles automatic
reporting when critical conditions are detected such
as exceeding thresholds or rapidly evolving
phenomena (Figure 2).
The first part of this paper illustrates the needs
and objectives from which a new project, related to
the support management of extreme rainfall
phenomena, has been conceived, with a short
digression on the difference between hydrological
models to be used in the case of medium and large
rivers and in the case of the small ones.
Next section will describe how, after the flooding
event of 2014 involving the city of Parma of Emilia-
Romagna region, ArpaE (the Regional Agency for
Prevention, Environment and Energy of Emilia-
Romagna) has developed a hydrological simulation
model that allows to know in advance, with a given
degree of probability, the approach of critical
thresholds of the hydrometric level at some points of
observation of the main rivers of Emilia-Romagna
region.
The second part of the document outlines the
results obtained by the integration of forecast data
Nanni, S. and Mazzini, G.
Sensornet Early-warning System Integration.
DOI: 10.5220/0006533100770084
In Proceedings of the 7th International Conference on Sensor Networks (SENSORNETS 2018), pages 77-84
ISBN: 978-989-758-284-4
Copyright
c
2020 by SCITEPRESS – Science and Technology Publications, Lda. All rights reserved
77
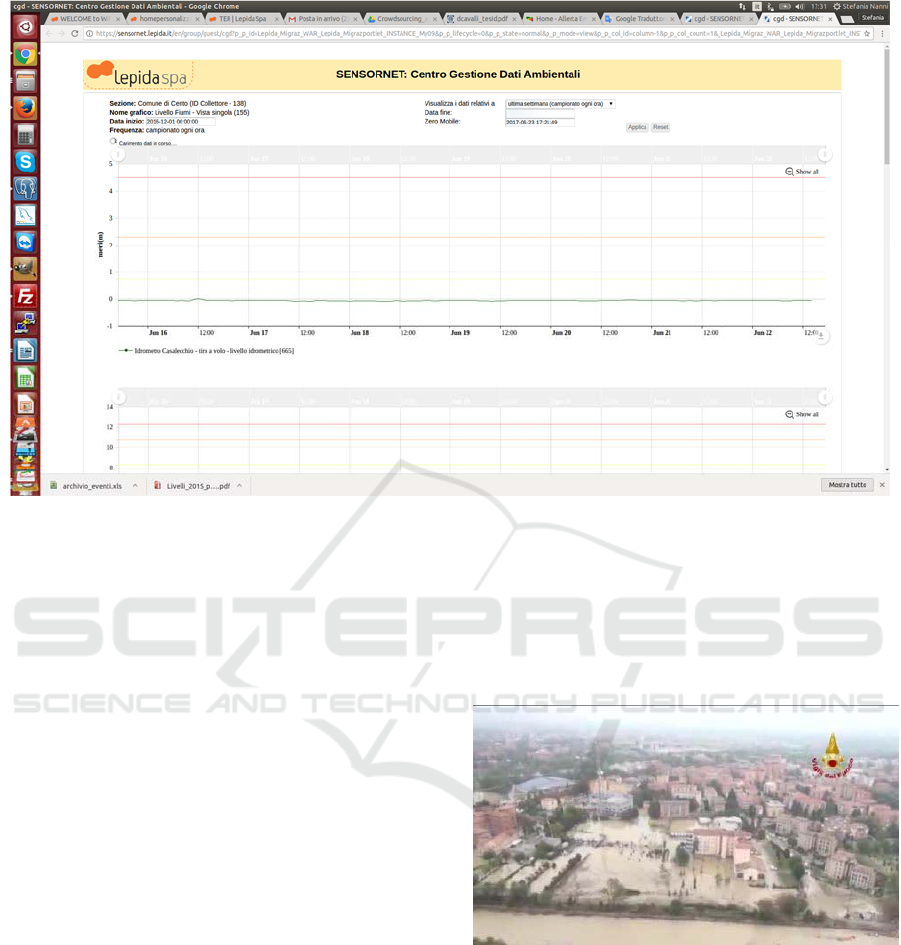
Figure 2: Hydrometric level and relative thresholds.
with the observed ones, related to the management
of extreme rainfall phenomena, within the Sensornet
platform.
The final part describes the future expected
developments.
2 THE STATE OF THE ART
Climate change is affecting all regions in Europe
causing a wide impact on society and environment.
Recently, extreme weather events as heat waves,
floods and droughts have caused rising damage costs
across Europe. In future, further impacts are
expected to rise societal vulnerability, potentially
causing high damage costs, as published by the
European Environment Agency (http://www.eea.
europa.eu/media/publications/climate-impacts-and-
vulnerability-2012).
Recent studies focused on climate change
projections over Northern Italy and Emilia-Romagna
region reveal that a peak of changes on minimum
and maximum temperature is expected during the
summer season at the end of the century (2071-
2099), when the increase in the average could reach
3.5- 4°C with respect to present climate 1961-1990.
On the other hand, significant changes on
precipitations are expected during summer, also at
the end of century, when a reduction up to 40% is
foreseen.
The most obvious effects of these climate
changes are the increase in the number of extreme
rain events and consequent flooding events, which
can have critical consequences especially in urban
areas where the concentration of the population and
services is higher (Figure 3).
Figure 3: Parma flash-flood October 2014.
Many studies are currently addressing the
problem of predicting critical environmental
phenomena, including flooding.
Some of them are not based on forecasting
system, but rather on real-time monitoring systems
(Baxter and Francis, 2000). or on certain
percutaneous parameters of the phenomena
(Chaczko and Ahmad, 2005, July).
In other cases, the forecasting system is based on
the integration of the predictive algorithm in
physical sensor networks, and is strictly bound to all
SENSORNETS 2018 - 7th International Conference on Sensor Networks
78

the problems and limitations associated with this
type of solution (Basha et al., 2008). In other cases,
the predictability aspect of the phenomenon is only
mentioned as one among many others involving in
the management of critical events (Basha and Rus,
2007, December).
The preparation and reaction to such disruptive
phenomena can increase the resilience of the
territory in short time as early warning of hazardous
conditions and in medium term as territorial
planning and preparation to emergency response.
The management of extreme rain events can not,
therefore, solely rely on traditional real time
monitoring systems, but must also include new
forecasting systems based on hydrological
simulation models and meteorological modeling.
3 RainBO LIFE
The analysis of climate variability over the
municipality of Bologna, as resulted from the
BlueAp LIFE project (Bologna Local Urban
Environment Adaptation Plan for a Resilient City
2012-2015), reveals important changes observed in
the main climatological variables.
During the last two decades, years with intense
precipitation have been frequently registered in
Bologna, having an important impact on the city and
its citizens.
The quantity of precipitation shows a slightly
negative trend during winter, spring, and summer
and a positive trend during autumn, over the period
1951-2011.
With regards to seasonal extreme of
precipitations, the dry days index presents a positive
tendency over 1951-2011 period, more intense
during summer.
Analysis performed on intense precipitation time
series evidence a slightly positive trend of the
frequency of days with intense precipitation (based
on 90th percentile as a threshold) in all season,
except on spring.
The flooding risk of small water courses is a
major problem in several urban areas (especially in
Italy): the constant growth of urbanization, with the
consequent decrease of soil permeability and loss of
space for river and stream beds, is leading to
increased flood hazard and vulnerability; in such
conditions, severe rainfall events over steep
catchments of limited area can produce dramatic
consequences; in addition, ongoing climate changes
are likely to increase the occurrence of severe
precipitation events, thus increasing flash flood
hazard.
Historical and recent records report that the
urban areas of Bologna located beneath the highland
are prone to severe flood events caused by small
water courses.
The most severe event occurred in 1932, when
rainfall of 134 mm within a few hours caused
flooding of a large urban area, including a portion of
the Ravone catchment area.
Another severe flood event occurred in the
Bologna area in 1955, while in 2002 a further flood
event affected several small municipalities nearby.
In all of these cases, the recorded hourly peak
intensity exceeded 50 mm/h.
Despite its relevance, the risk of flooding of
small water courses in urban areas is often
underestimated and few measures are taken for
prevention and mitigation (Grazzini et al., 2013).
The high level objective of RainBO LIFE project
(2016-2019), that is a follow-up of BlueApp one, is
the improvement of knowledge, methods and tools
for the characterisation and forecast of heavy rains
potential impact due to the hydrological response,
not only of medium and large basin, but also of the
small ones and for the evaluation of the vulnerability
of assets in the urban areas.
4 HYDROLOGICAL MODELS
4.1 Medium and Large Basins:
Random Forest Method
Following the flooding of the Baganza river in
Parma on October 2014 (Figure 3), caused by heavy
rains, which flooded several neighborhoods
southwest of the city, the Civil Protection Agency of
the Emilia-Romagna region required ArpaE the
development of a hydrological simulation model to
be able to recognize in advance the probability of
overcoming the three alert thresholds fixed for the
main rivers of Emilia-Romagna region: Warning
(threshold 1), Pre-alarm (threshold 2), Alarm
(threshold 3).
Hydrological modeling for medium and large
basins is based on a statistical method, Random
Forest, which uses decision trees.
The Random Forest model, applied to hydraulic
modeling, provides the probability of overcoming
the alert thresholds of some observation point of the
medium and large basins, for the next 6-8 hours,
depending on the dynamics of the river.
In particular, the Random Forest hydrological
model gives the following forecast data:
Sensornet Early-warning System Integration
79
1. Probability of not exceeding threshold 1
2. Probability of exceeding threshold 1
3. Probability of exceeding threshold 2
4. Probability of exceeding threshold 3
4.2 Small Basins: Criteria 3D Model
Forecasting models of heavy rainfall initiating flash
flood from small basins are different from other
models (e.g from large basins or waterways).
The size of the small basin results in very rapid
response times to heavy rainfall.
In other words, the time interval between the
start time of the precipitation and the span peak can
be reached in less than two hours, which in reality
would make the prediction of the event very difficult
and therefore the alert system.
For this reason, it is considered essential to
develop a hydraulic simulation model for small
basins, and the installation of specific measuring
points, allowing hydrometric observations to its
validation.
Figure 4: Ravone creek.
Criteria3D is a three-dimensional hydrological
model, which also simulates water infiltration into
the soil, developed by ArpaE-SIMC of Emilia-
Romagna region.
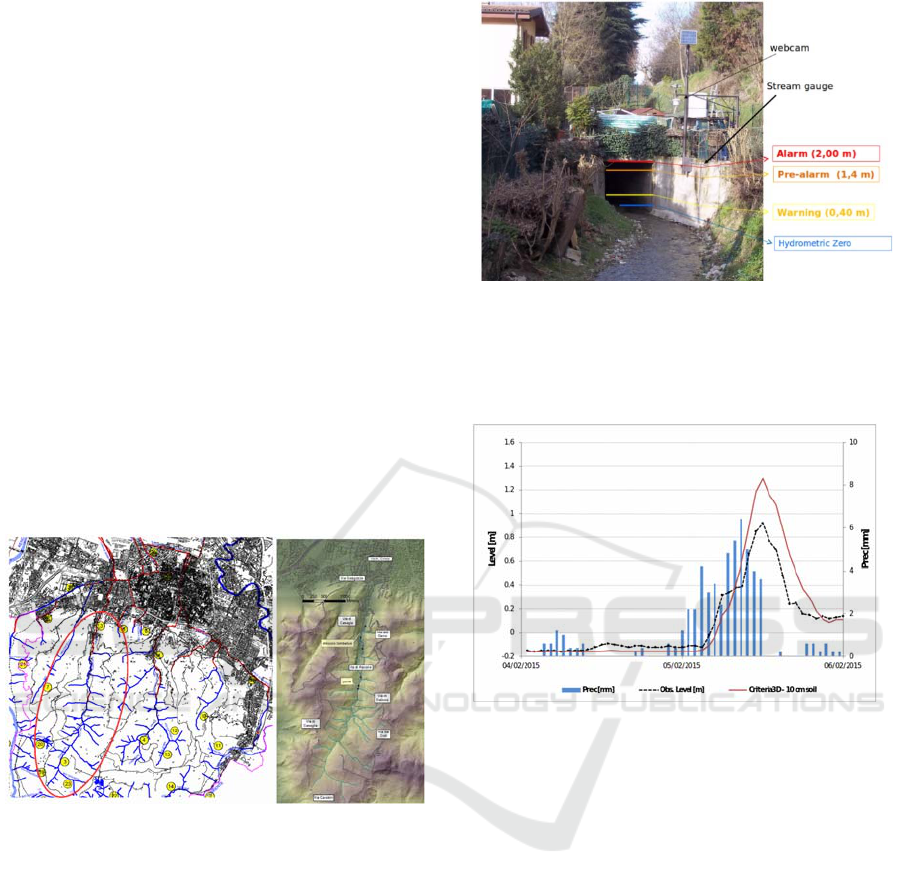
The model was developed starting from the study
of the river Ravone, which is one of the creek that
from the hills south of Bologna goes down to the
city (Figure 4).
In this basin, all those critical and valuable
factors that are present in the hilly waters, such as
the effects of the strong anthropization that currently
characterizes the end of the valley and the crossing
of the city, are also present. (Figure 5)
Figure 5: Ravone's suture and measure point.
Figure 6 shows the good result of the test of
simulation of the water level at the stream gauge of
Ravone in the event of 2015-02-05.
Figure 6: Criteria3D simulation of the water level at the
stream gauge of Ravone in the event of 2015-02-05.
5 METEOROLOGICAL
MODELING COSMO-LAMI
The numerical meteorological model limited area
Cosmo-Lami (https://www.arpae.it/dettaglio_general
e.asp?id=2584&idlivello=32 ), called Lami for
brevity, carried out in consortium between national
civil protection department, USAM Air Force, Harp
ArpaE Piemonte and ArpaE Emilia-Romagna,
provides numerical forecasts with a spatial
resolution at 7km and 2.8Km and temporal validity
respectively three and two days.
Predictions based on this model are carried out
twice a day, at 00 and at 12 UTC, at the
supercomputing Cineca center, in accordance to a
contract with the IdroMeteoClima Service and the
Department of National Civil Protection.
Data are provided in grid format, GRIB
(http://apps.ecmwf.int/codes/grib/format/grib1/overv
SENSORNETS 2018 - 7th International Conference on Sensor Networks
80
iew), and each file contains forecast data for various
meteorological parameters, including precipitation,
either at the surface or close to it, at an hourly or
three-hourly in dependence on the parameter.
The data relating to the meteorological modeling
can be used both at the level of maps to have, for
example, an overview of the precipitation forecast,
but also at the numerical level to have, for example,
the detail on hourly precipitation provided on a
given grid cell, as in the case of Ravone creek,
which constitutes the basic information for the
prediction of the hydrometric level corresponding
starting from the product simulations scenarios
resulted from the 3D hydrological model for small
basins.
Data from meteorological modelling, limited to
the Emilia-Romagna region, are distributed GRIB
format on the open date platform of ArpaE of
Emilia-Romagna.
6 SENSORNET
EARLY-WARNING SYSTEM
INTEGRATION
Sensornet early-warning system integration is based
on the integration of forecast data into the platform
through the configuration of new virtual sensors
based on hydrological simulation models and
meteorological modelling.
The integration of these new virtual sensors into
the Sensornet platform has been accomplished in a
simple and immediate way, using the same data
model defined for the physical sensors, without the
need for any extension or specialization and
providing the platform with a new feature crucial for
recognition and generation of early-warning reports.
6.1 Sensornet Forecast Data
Integration
Sensornet constitutes the monitoring subsystem of
RainBO platform.
In addition to the data coming from the
traditional real-time monitoring system of ArpaE,
mainly consisting of regional hydrometers stations
to measure temperature, rain and hydrometric levels,
it also integrates those belonging to the forecast
systems, for the scope illustrated before.
The integration of sensors data coming from
different monitoring systems in Sensornet is realized
through a federated approach whose main advantage
is to preserve the investments made on already
existing systems and to protect the technical,
technological and organizational autonomy of the
individual systems and of their owners.
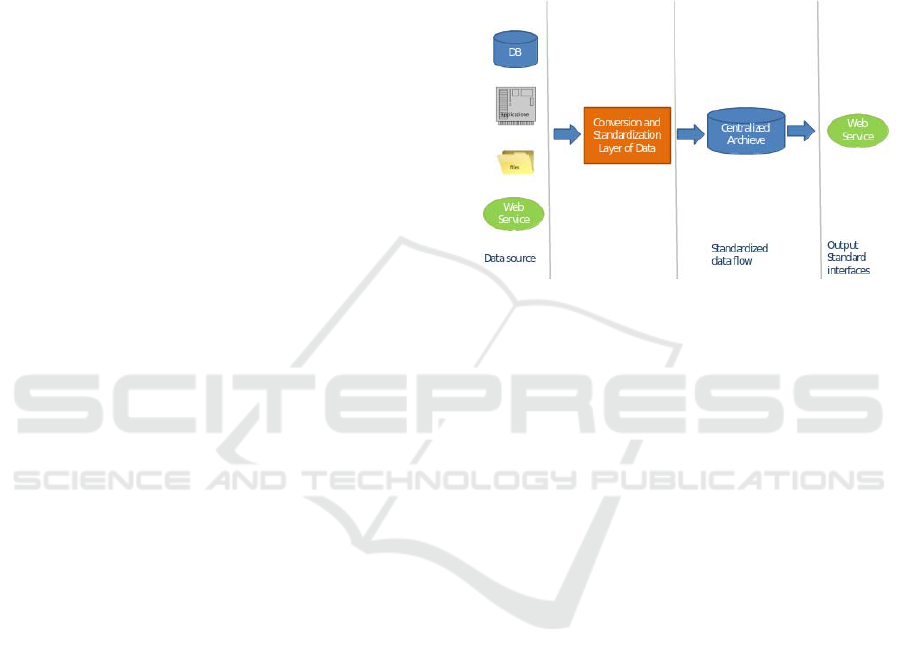
The architecture implemented in Sensornet
platform provides an interconnection middleware
between the different data sources and the central
system, acting as a data collector from different
sources and a data normalizer towards the central
system, as shown in Figure7.
Figure 7: Flow of collection, standardization, storage and
access of the data.
It consists of a series of atomic modules for data
retrieval from individual sources and of their
manager, which oversees their activation and
coordination.
Each module contains the access rules and the
required commands for retrieving data from a
specific source or database and for storing them in a
standard format on the centralized database.
In order to acquire data from heterogeneous
sources and use them in a contextual and correlated
mode, a standardization process is necessary.
The creation of a standardized data stream is one
of the added values offered by Sensornet platform,
which transforms the data from the different sources
into a single standard format, regardless of the
technologies, the interfaces, formats and data type of
the sources (Nanni and Mazzini, 2015).
The integration of the hydrological simulation
models and meteorological modelling data in
Sensornet has been achieved through the definition
of "virtual" sensors, which, unlike the real, are not
associated with physically measured data, but to the
forecasted ones provided by the models.
This type of solution allowed to completely
integrate these new types of "virtual" sensors with
the real ones, while maintaining the consistency of
data and their modeling within the Sensornet
platform.
Sensornet Early-warning System Integration
81

6.1.1 Lami Virtual Sensor Integration
The new "virtual" Lami sensor has been defined in
Sensornet platform to allow the integration of the
GRIB data related to the modeling of the weather,
needed for the 3D hydrological simulation model for
small streams.
In the case of the Ravone stream, as in most
small streams, the size of the basin is contained in a
single cell of the reference grid, whose data can then
be represented by a sensor placed within the cell
itself.
From the datum for cumulative rain, collected
from GRIB data at the beginning of each run for
each cell, it is possible to calculate the
corresponding precipitation per hour.
Once a precipitation threshold has been
established, it is possible to determine when a
precipitation starts and when it finishes, to infer the
duration as well as the peak and the accumulated of
the corresponding event.
The algorithm to calculate the significant
parameters of a rainy event, starting from the data
for the cumulative hourly precipitation, can be
described as follows:
starting from the GRIB data (the cumulative
hourly precipitation from the beginning of the
run), the hourly precipitation is extracted with
simple subtractions;
the hours in which rain is expected and when it is
not (0-1) are calculated according to the
established threshold (normally 0,2 mm);
depending on the distribution of 0 and 1, it is
estimated when a rainy event starts and when it
ends;
at this point it is possible to calculate the
duration, the accumulated (constitutes from all
the hourly precipitation included in the event)
and the maximum intensity relative to the event
(peak).
The storage of the main parameters of a rainfall
event, calculated as it has been described, is made by
defining four corresponding measures associated
with each "virtual" Lami sensor:
hourly precipitations
event
cumulative hourly precipitations
peak
The integration of the new type of Lami virtual
sensor inside the Sensornet platform, indeed,
required the implementation of a new GRIB data
acquisition and processing module, the definition of
a new type of Lami sensor, to which the four
measures previously described are associated, and
the configuration of a new Lami type sensor at the
Ravone stream, identified by the coordinates of the
corresponding grid cell.
The integration of other sensors related to the
meteorological forecasts at another stream, simply
requires the configuration of another Lami type
virtual sensor associated with the coordinates of the
corresponding grid cell.
Figure 8 shows an example of graphing data for
the Lami sensor defined for the Ravone cell (lat
44.46 and lon 11.31) provided at 00:00 on
30/06/2017 and valid for 72 hours later.
In the example shown, the expected rainfall is
below the defined threshold (normally 0,2 mm) and
is therefore not a source of rain for a rainfall event.
Figure 8: Example of graphic data of Lami virtual sensor.
6.1.2 Random Forest Virtual Sensor
Integration
The new "virtual" Random Forest sensor has been
defined to allow the integration the data related to
hydrological modeling for medium and large basins.
The integration of the new type of Random
Forest virtual sensor inside the Sensornet platform
required the implementation of a new data
acquisition and processing module of the .csv files
(provided by ArpaE every 10 minutes on a
ftpServer, hosted by LepidaSpa), the definition of a
new type of Random Forest sensor, to which the
previously described four probabilities are
associated, and the configuration of two new
Random Forest type sensors in correspondence of
Parma and Baganza rivers, identified by the station
ID of the corresponding hydrometer.
The integration of other data related to
hydrological modeling for medium and large basins,
simply requires the configuration of others Random
Forest type virtual sensor associated to
corresponding .csv files.
SENSORNETS 2018 - 7th International Conference on Sensor Networks
82
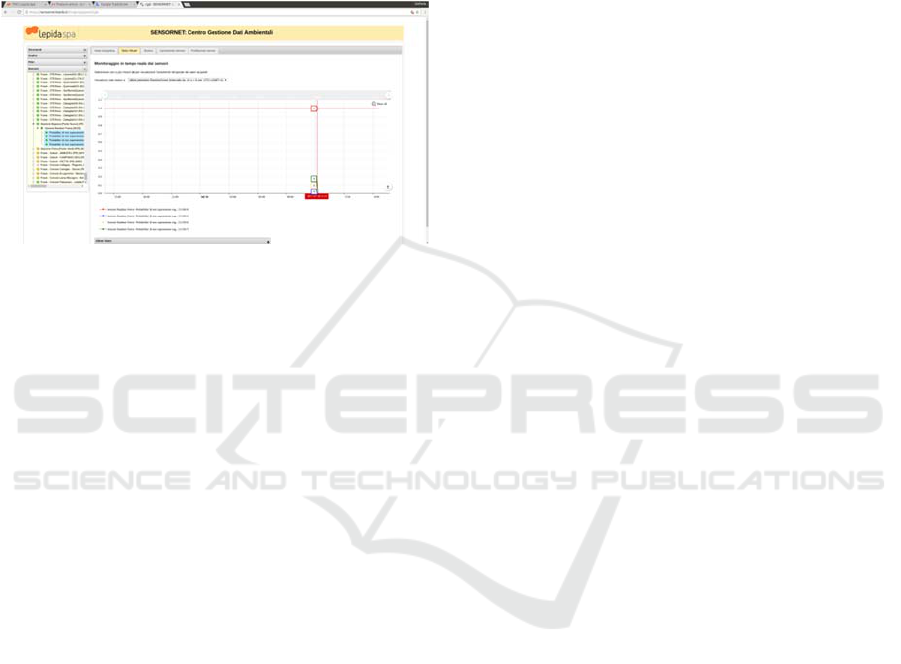
Figure 9 shows a graphical representation data
for the Random Forest sensor defined for the
Baganza river provided at 14:40 of 18/07/2017 and
valid for 6 hours later.
In the example, the probability of the river level
of not exceeding threshold 1 in the point of
observation is equal to one, while the probability of
exceeding threshold 1, threshold 2, and threshold 3
is equal to zero.
Figure 9: Example of virtual sensor Random Forest data
graphication.
7 SENSORNET
EARLY-WARNING SYSTEM
INTEGRATION RESULTS
The term early warning (EW) indicates alarms that
arise in the time interval between the moment in
which phenomena potentially triggering a dangerous
event are observed and the time at which the event
happens.
Time scales characteristic of early warning are
different for different types of events:
from seconds to tens of seconds for earthquakes;
from minutes to hours for tsunamis;
from hours to days for weather events;
from hours to days to floods and landslides;
from hours to weeks to volcanic eruptions.
The adoption of early warning (EW) methodologies
is considered as essential to cope with disasters (not
just natural) in a world where the population is not
only increasing, but it is concentrated in megacities
of several (or even tens) millions of inhabitants.
In fact, the EW appears as a keyword in all
documents addressing the problem of risk reduction,
both nationally and internationally (Baxter and
Francis, 2000).
With regards to hydraulic risk, the possibility of
early detection of extreme precipitation events and
their effects on the river level allows to recognize in
advance critical scenarios and to support their
management or, vice versa, to give evidence of the
absence of critical conditions.
Figure 8, for example, shows the rain forecast for
the next 72 hours on Ravone's cell.
The graph gives evidence of the expected rainfall
and its cumulated level, whose duration and
intensity are not sufficient to generate a significant
event to report.
Figure 9 shows that the probabilities of the level
of Baganza River to not exceeding threshold 1 is
one, while it is equal to zero the probability that it
exceeds any of the three defined alert thresholds, for
the next 6 hours.
Integration of forecast model data is the right
prerequisite for the creation of an early-warning
system that allows recognition and signaling of
critical thresholds over with an anticipation that
depends on the simulation model used.
In particular, the integration of forecast data
related to the hydrometric level for medium-sized
basins and rainfall events for small ones allows to
identify critical scenarios in advance with a margin
of some hours in the case of medium-sized basins
and up to a few days for those little ones.
According to the previous time scales the
forecast data integrated in Sensornet platform
provides the right conditions for the provision of an
early-warning system effective and useful for the
management of extreme rain events and floods
events.
8 CONCLUSIONS
RainBO LIFE is a very ambitious project that aims
to provide a support platform for the management of
extreme precipitation events both in the medium
term as territorial planning and preparation to
emergency response and in short time as early
warning of hazardous conditions.
Sensornet platform, that constitues RainBO
monitoring subsystem, was already integrating the
data of the major traditional monitoring systems, but
its modular, flexible and configurable architecture
allowed immediate integration of the forecasts ones,
from which it depends the increase of resilience of
urban areas through the early warning of hazardous
conditions.
The support for the management of extreme
precipitation events in the short term also includes
the integration of innovative technology-based
monitoring systems, such as microwaves links,
Sensornet Early-warning System Integration
83

which can provide rainfall measurement from the
attenuation level of radio signals of the base radio
stations of the cellular networks.
Once the radio data acquisition module will be
finalized, Sensornet will also integrate new virtual
sensors corresponding to the intermediate point of
the radio links, for which the signal attenuation data
stream will be available.
This new type of virtual sensors will be another
added value of Sensornet platform, and therefore of
the monitoring subsystem of the RainBO project.
REFERENCES
Nanni, S., and Mazzini, G., 2015. From the Smart City to
the Smart Community, model and architecture of a
real project: SensorNet, JCOMSS journal Vol. 10,
No.3.
http://www.eea.europa.eu/media/publications/climate-
impacts-and-vulnerability-2012.
Grazzini, F., Dottori, F., Di Lorenzo, M., Spisni, A., and
Tomei, F., 2013. Nubifragi e rischio idraulico nella
collina bolognese: il caso studio del Ravone.
https://www.arpae.it/dettaglio_generale.asp?id=2584&idli
vello=32.
http://apps.ecmwf.int/codes/grib/format/grib1/overview.
Jochen, Zschau, Andras, N., and Kuppers, 2003. Early
Warning Systems for Natural Disaster Reduction.
Baxter, J., and Francis, J., 2000. Early warning detection
and notification network for environmental conditions.
U.S. Patent No. 6,023,223.
Basha, Elizabeth, A., Sai Ravela, and Daniela Rus, 2008.
Model-based monitoring for early warning flood
detection. Proceedings of the 6th ACM conference on
Embedded network sensor systems.
Chaczko, Z. and Ahmad, F., 2005, July. Wireless sensor
network based system for fire endangered areas. 2005.
ICITA 2005. Third International Conference on
Information Technology and Applications.
Basha, E. and Rus, D., 2007, December. Design of early
warning flood detection systems for developing
countries. 2007. ICTD 2007. International Conference
on Information and Communication Technologies and
Development.
SENSORNETS 2018 - 7th International Conference on Sensor Networks
84
