
Hotspot Analysis of the Spatial and Temporal Distribution of Fires
Chien-Yuan Chen
1
and Qi-Hua Yang
2
1
Dept. of Civil and Water Resources Engineering, National Chiayi University, Syufu Rd., Chiayi City, Tawian, China
2
Tainan City Government Fire Bureau, Yonghua Rd., Anping Dist., Tainan City, Taiwan, China
Keywords: Geographic Information System, Hotspot, Fire Prevention, Geo-Statistical Analyis.
Abstract: Fire can take lives and destroy structures. However, modern technology can assist authorities to make
decisions on fire disaster prevention. Geographic information systems can play a vital role in fire prevention
and mitigation by predicting potential hotspots for fires. This study collected and analysed data on fires in
Tainan City in southern Taiwan. Spatial statistics analysis tools employing average nearest neighbour
analysis and global analysis through Moran's I were used to analyse whether the fires had a clustered pattern
and to plot a fire hotspot map using Getis-Ord Gi* analysis. The results showed that the highest fire risk
index is that for people over 80 years old, followed by those between the ages of 60 and 80. The spatial
distributions of fire locations, injuries, deaths, factory fires, house fires, and wild fires have clustered
patterns in the city. The fire hotspots surround the downtown districts, which have high population density
and highly developed commercial and industry areas. The fire cold spots are located in the lowly developed
mountainous and coastal areas, which have lower population density. Residents in hotspots should be able
to better understand their fire risk through studying the hotspot map. Moreover, authorities can identify
hotspots for decision making on fire prevention and urban development planning.
1 INTRODUCTION
The incidence of fires has been reduced with the
progress of fireproof technologies for buildings and
products. However, injuries and deaths due to fires
still continuously occur, and more attention must be
paid to the fire warning signs. Further reduction in
the number of fires requires communities to promote
disaster prevention cognition and the establishment
of public safety warning systems. More than 60% of
fires occur in houses, as statistics by the National
Fire Agency in Taiwan demonstrate
(http://www.nfa.gov.tw/). This indicates that
although society is generally concerned with public
safety, people often lose sight of safety within their
daily environment.
Spatial statistics analysis has been used in
various areas for disaster mitigation. Applications
that have employed spatial statistics analysis tools
include the spatial analysis of crimes committed in
the Taichung port area (Lee et al., 2012). The
gathering mode used to collect criminal cases was
identified using average nearest neighbour analysis,
and hotspot analysis was employed to assess cold
spot and hotspot positions regarding crime for the
reference of coastguards.
In one analysis of spatial clusters of dengue fever
in Kaohsiung city (Yan and Hsueh, 2010), research
was conducted from the perspective of the
geography of the disease, and a geographic
information system (GIS) was employed to create a
disease map and study the spread of dengue fever.
Whether there was a spatial aggregation in the city
was determined using the average nearest neighbour
method and point density analysis to locate the
village with the highest incidence of dengue fever.
Hotspot analysis using Getis-Ord Gi* and spatial
autocorrelation coefficients Moran’s Index (Moran’s
I) was also employed to study the spread of
Anopheles gambiae and Anopheles funestus in
Kenya (Kelly-Hope et al., 2009).
Spatial analysis was used to examine betel nut
plantation hotspots in the upper Shui-Li Creek
watershed using the autocorrelation coefficients of
Moran’s I and the G-statistic, with the objective of
investigating the management strategy of betel nut
plantations (Yeh et al., 2013). Liang et al. (2014)
used spatial analysis to perform a risk assessment of
invasive species and employed hotspot analysis
Chen, C. and Yang, Q.
Hotspot Analysis of the Spatial and Temporal Distribution of Fires.
DOI: 10.5220/0006638600150021
In Proceedings of the 4th International Conference on Geographical Information Systems Theor y, Applications and Management (GISTAM 2018), pages 15-21
ISBN: 978-989-758-294-3
Copyright
c
2019 by SCITEPRESS – Science and Technology Publications, Lda. All rights reserved
15

Getis-Ord Gi* to identify hotspot areas and plan
management strategies. Truong and Somenahalli
(2011) used the spatial autocorrelation coefficient
Moran’s I to identify pedestrian–vehicle crash
hotspots and unsafe bus stops using hotspot analysis
Getis-Ord Gi*. Pedestrian–vehicle crash hotspots
were concluded to correlate strongly with the
locations of bus stops.
Hotspot analysis Getis-Ord Gi* and spatial
autocorrelation coefficient Moran’s I were also used
to map forest fire risk zones in the Yeguare Region
of Honduras (Cáceres, 2011). Factors such as slope,
elevation, and distance to tribute affected the risk of
a forest fire. Fires exhibit a spatial aggregation
distribution and can be related to population density.
The characteristics of fires are well-suited to the use
of spatial statistics and an autocorrelation analysis to
identify hotspot areas and risk factors for disaster
prevention and management.
2 STUDY AREA AND
METHODOLOGY
The M
L
6.4 earthquake on 3 March 2010, which had
its epicentre in Jianxin village in southern Taiwan,
caused a building owned by a spinning and weaving
company in Tainan City to catch fire. Furthermore, a
technology factory caught fire on 28 July 2011,
causing substantial economic losses in the city. The
fire on 23 October 2012 at the Beimen branch of
Sinying Hospital in the Beimen District of Tainan
City resulted in the deaths of 13 elderly people and
injured 69 others. These serious fires and various
other factors led us to choose Tainan City as a study
area because of its variety of lifestyles and areas,
including villages, mountainous areas, coastal areas,
and industrial areas. The diversity of the city has
caused both its population and industrial
development to increase rapidly.
This analysis was completed through three steps:
a literature review and data collection, statistics
analysis, and GIS spatial statistics analysis. The
study area was divided into a grid, each square of
which was 1000 × 1000 m
2
in size. Fire-related data
were separated by injuries and deaths, age and
gender of the injured and deceased individuals, fire
location, land use, and population density. The
coordinates of the fires were overlaid onto an
administrative map to create a fire point density map
to represent fire locations.
Tools for average nearest neighbour and global
analysis using Moran's I and Getis-Ord Gi* analysis
were employed to analyse if the fires displayed a
clustered, dispersed, or random pattern on the fire
hotspot map. The null hypothesis was the default
hypothesis and states that there is no association
between fire occurrence and the factors. The null
hypothesis was assumed to be true until evidence
indicated otherwise. The rejection of the null
hypothesis concluded that there were reasons to
believe that a relationship between fire and the other
factors existed. The tools used for spatial statistics
analysis are explained:
(1) Average nearest neighbour analysis
Euclidean distance was used in the nearest
neighbour analysis. The average nearest neighbour
distance tool measures the distance between each
feature centroid and its nearest neighbour’s centroid
location to predict the nearest neighbour index. Five
values obtained by the analysis included observed
mean distance, expected mean distance, nearest
neighbour ratio, z-score, and p-value. The z-score
and p-value were used for judging the possibility to
reject the spatial random pattern of the null
hypothesis. A z-score less than −2.58 or greater than
2.58 and a p-value lower than 0.01 with a confidence
level of over 99% were used to reject the null
hypothesis and confirm a clustered pattern.
The average nearest neighbour ratio (NNR) is
calculated using the observed average distance
divided by the expected average distance, with the
expected average distance being based on a
hypothetical random distribution with the same
number of features covering the same total area. If
NNR is less than 1, the study pattern is clustered; if
the index is greater than 1, the trend is toward a
dispersed pattern.
(2) Global analysis by Moran's I
The spatial autocorrelation tool global Moran's I
measures spatial autocorrelation based on both
feature locations and feature values simultaneously.
The method measures each feature centroid and its
nearest neighbour’s centroid location to analyse the
spatial autocorrelation of each fire. The eigenvalues
of this technique included the Moran's I, expected
index, variance, z-score, and p-value. The same
conditions for z-score, p-value, and confidence level
as for average nearest neighbour analysis were used
to reject the null hypothesis. The method evaluates
the pattern of fires as clustered, dispersed, or
random. If Moran’s I is greater than 0 (positive
value), the fires were clustered; the fires were
dispersed if the index is less than 0 (negative value),
and the fires were randomly distributed if the index
is close to 0.
(3) Hotspot analysis using Getis-Ord Gi*
The point density tool calculates the density of point
GISTAM 2018 - 4th International Conference on Geographical Information Systems Theory, Applications and Management
16
features around each raster cell; the tool yields a heat
map for visualization. However, the hotspot analysis
using the Getis-Ord Gi* method yields a true
statistical hotspot analysis.
The Getis-Ord Gi* value of the target feature
shows where fire hotspots (clusters of high values)
and cold spots (clusters of low values) exist in the
area accompanied by the z-score and p-value. The z-
score and p-value were used to support the rejection
of the null hypothesis. The values could help to
judge the clustered pattern in high or low values and
whether the fires exhibited a random pattern in the
analysis. Fires in highly clustered patterns have a
higher z-score and lower p-value; fires in a highly
dispersed pattern have a lower z-score and a lower
p-value. The closer the z-score is to 0, the less
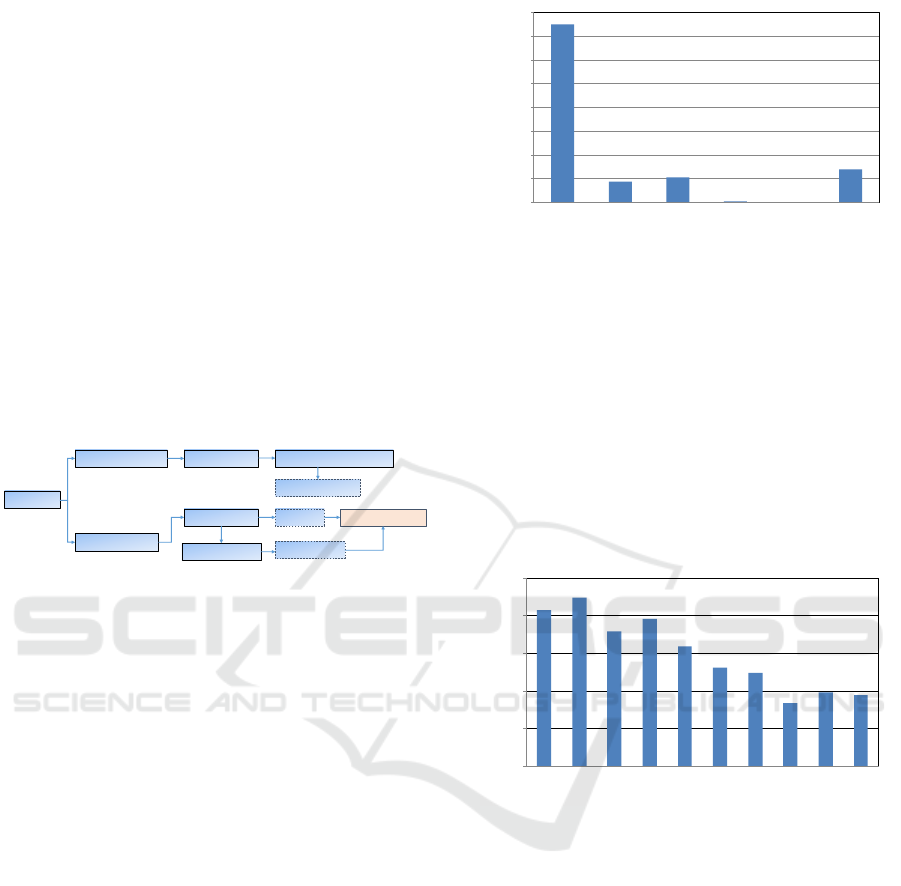
visible the clustered pattern. Figure 1 shows the
flowchart of the spatial statistics analysis tools used
in this study.
Fire events
Coordinate analysis
Global analysis
Attribute analysis
Global analysis Nearest neighbor analysis
Moran's I
Getis-Ord Gi*
Hotspot analysis
Fire hotspot map
Point density map
Figure 1: Method and tools used for the fire hotspot
analysis using the GIS.
3 RESULTS AND DISCUSSION
3.1 Statistics Analysis of Fires
3.1.1 Number and Types of Fire Events
The number of fires totalled 2179 in 10 years (2004-
2013) in the city, which included 1502 building fires
(68.94%), 216 traffic-accident fires (9.91%), 176
wild fires (8.07%), 1 boat fire (0.05%), and 284
other type of fires (13.03%) (Figure 2). There were
217.9 fires per year on average, which is equivalent
to 0.6 fires per day and three fires every 5 days on
average.
Buildings such as houses, factories, shops, and
warehouses, are the main buildings used by city
residents in daily life. Fire disaster prevention is
emphasized in buildings to reduce the threat to
human life and economic losses. In relation to fires
in buildings, this study demonstrates that there were
0.41 building fires per day, which is equivalent to
two building fires every 5 days on average.
1502
176
216
1
0
284
0
200
400
600
800
1000
1200
1400
1600
Building Wild traffic boat aircraft others
Number
Type of fires
Figure 2: Statistics on the types of fires in the study area.
In general, building fires have decreased in the
city in recent years. There were 193.8 building fires
per year on average, with a total of 969 building
fires in the years 2004–2008. The number of
building fires decreased to 106.6 per year in the
period 2009–2013, with a total of 533 building fires.
The reduction ratio was thus 45% (Figure 3). This
finding may be a result of progress in fireproof
technologies and the implementation of fire disaster
prevention strategies such as those that increased
public awareness.
208
225
180
196
160
132
124
84
98
95
0
50
100
150
200
250
2004 2005 2006 2007 2008 2009 2010 2011 2012 2013
Number
Ye a
r
Figure 3: Statistics on building fires in the study area.
3.1.2 Fire Death Rate and Fire Risk Index
The fire death (or injury) rate is the number of
fatalities (injuries) per million people in the
population. The fire risk index is based on the
average death (injury) ratio and calculated as the fire
death (injury) ratio in various ages divided by the
fire death (injury) ratio in the total population
according to the U.S. Fire Administration’s report
(https://www.usfa.fema.gov/):
Fire death (injured) rate = number of fire
deaths (injuries)/ population (in millions)
(1)
Fire risk index = fire death (injury) ratio in
various ages/fire death (injury) ratio in the
total population
(2)
Hotspot Analysis of the Spatial and Temporal Distribution of Fires
17
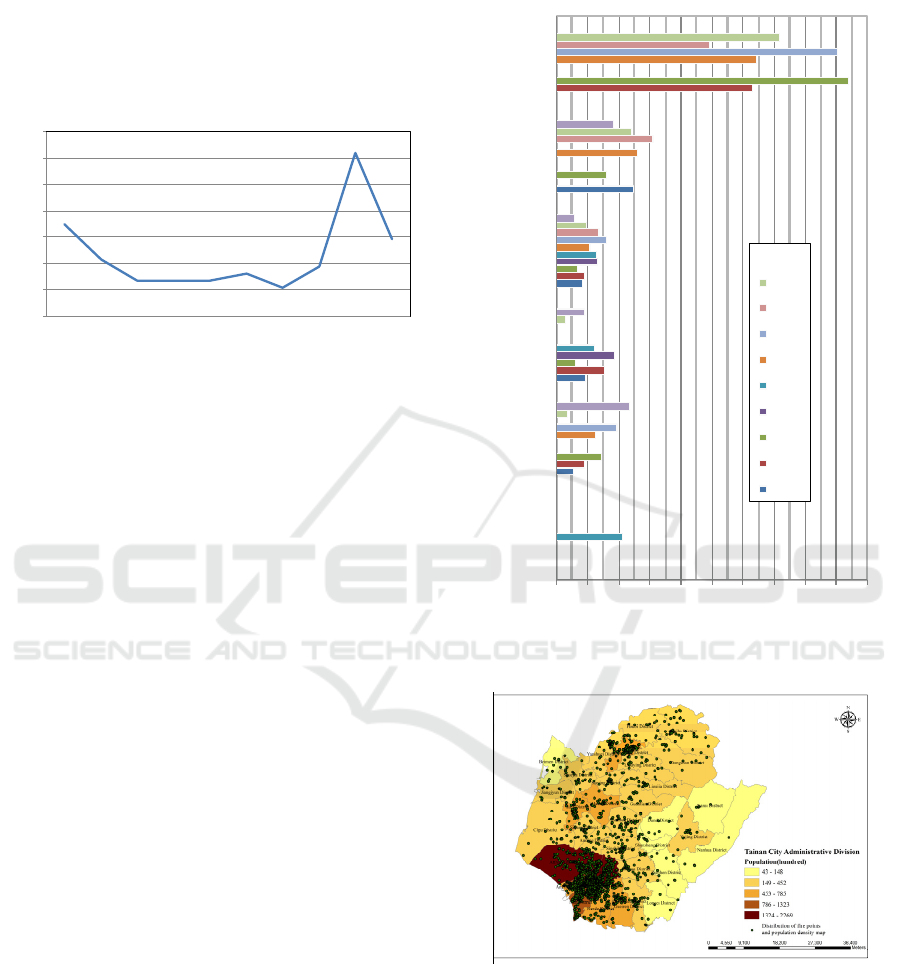
The fire death rate was 6.99 in 2004 in the study
area, but only 2.13 in 2010. The rate increased
abruptly to 12.37 in 2012 because a deadly hospital
fire occurred in this year, causing 13 deaths. The
average fire death rate was 4.65 over the 10 years
this study examined, but would be lower than 6.0 if
the year 2012 was excluded, as shown in Figure 4.
6.99
4.3
2.65
2.67 2.67
3.2
2.13
3.73
12.37
5.86
0
2
4
6
8
10
12
14
2004 2005 2006 2007 2008 2009 2010 2011 2012 2013
Fire death rate
Ye a r
Figure 4: Changes in the fire death rate in the study area.
The statistical analysis discovered that the fire
risk index was less than 1.0 on average for those
under 60 years old, 1.76 for those aged 60–79, and
4.27 for those aged over 80 years old in the city
(Figure 5). This indicates that those aged over 60 are
a high-risk group regarding fires. The result
coincides with the statistics provided by the Tokyo
Fire Department (http://www.tfd.metro.tokyo.jp/),
which states that more than 90% of fire deaths are of
individuals over the age of 65. The results perhaps
reflect the fact that elderly people are less able to
escape due to mobility issues and are therefore more
exposed to the effects of a fire.
The fire risk index was highest in the Beimen
District due to the fire on 23 October 2012 at the
Beimen branch of the Sinying Hospital, which
caused 59 injuries. These statistics were compared
with the spatial statistics analysis for further analysis.
3.1.3 Spatial Statistics Analysis of Fires
This study used the coordinates of fire locations to
create a fire point density map and overlaid this with
the population density to perform relevance analysis
using a GIS. A total of 2179 fires were imported into
the spatial analysis for 2004
–2013. The fires were
concentrated in the southwest area of the city. The
highest fire density area was the industrial area of
Yongkang District, with 261 fires, including 194
building fires (Figure 6).
There were 163 fire injuries and 69 deaths in
2004–2013 in the city. The fire point density map
shows that a high density of fires was concentrated
in the high human activity areas surrounding the
downtown for industry and commercial purposes
(Figures 7 and 8).
012345678910
0~9
10~19
20~39
40~59
60~79
> 80
Fire ris k inde x
Age
2013
2012
2011
2010
2009
2008
2007
2006
2005
2004
Ye a r
Figure 5: Fire risk index in different ages in the study area.
Figure 6: Distribution of fire points and population density
map in the study area.
GISTAM 2018 - 4th International Conference on Geographical Information Systems Theory, Applications and Management
18
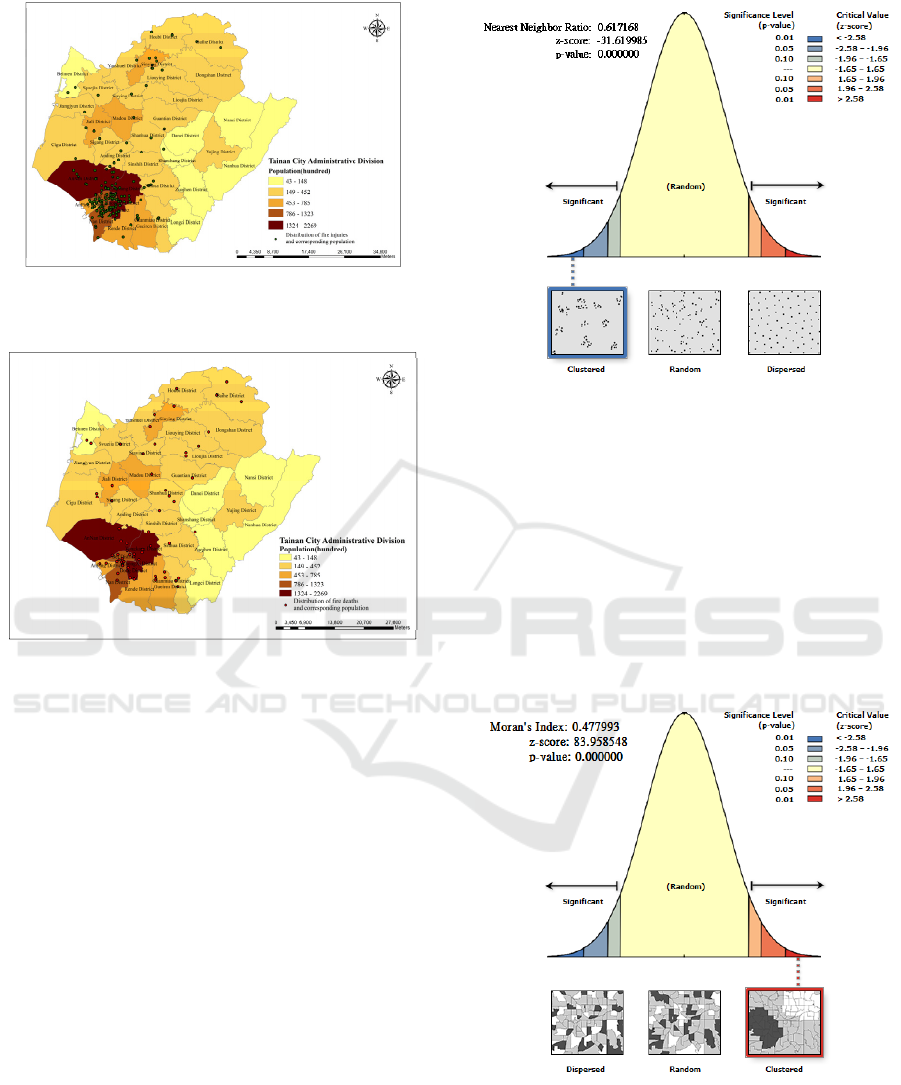
Figure 7: Distribution of fire injuries and corresponding
population in the study area.
Figure 8: Distribution of fire deaths and corresponding
population in the study
area.
3.1.4 Spatial Aggregation Pattern of Fires
(1) Average nearest neighbor analysis
In the nearest neighbor analysis, the calculated
observed mean distance was 334.6 m and the
expected mean distance was 542.2 m. The average
NNR was thus 0.62, which is smaller than 1.0 and
indicates a clustered pattern of fires. The z-score was
−31.62, which is smaller than −2.58, and the p-value
was 0.00; thus, the null hypothesis, was rejected.
These values demonstrate that the fires were in a
clustered pattern in the city, with a less than 1%
probability of their being in a random pattern. The
results of the average nearest neighbor analysis for
fires are shown in Figure 9.
Figure 9: Results of the NNR distribution obtained using
average nearest neighbor analysis.
(2) Global Moran's I analysis
Global Moran's I analysis showed that the Moran’s I
was 0.48, which is larger than 0.00, and that the fires
had a positive clustered pattern. The z-score was
83.96, larger than 2.58, and the p-value was 0.00,
which rejects the proposition of complete spatial
randomness (null hypothesis). In summary, the fires
in the city had a clustered pattern, with a less than
1% probability that they could be in a random
pattern (Figure 10).
Figure 10: Moran’s I obtained using global Moran's I
analysis.
The types of fires including house, industry, and
wild fires and those fires that caused injuries and
deaths were all found to exhibit a clustered pattern
Hotspot Analysis of the Spatial and Temporal Distribution of Fires
19
by using the GIS spatial statistics analysis in the
study area (Table 1).
Table 1: Summary of the spatial analysis results for fires
in 2004–2013 in the study area.
All
types
of
fire
Industry
fire
House
fire
Wild
fire
Average
nearest
neighbor
NNR 0.62 0.47 0.58 0.68
Z-score
-
31.62
-16.06 -23.43 -7.78
p-value 0.00 0.00 0.00 0.00
Global
Moran's I
Moran’
s I
0.48 0.17 0.41 0.04
Z-score 83.96 29.85 72.02 6.68
p-value 0.00 0.00 0.00 0.00
Type of distribution clustered
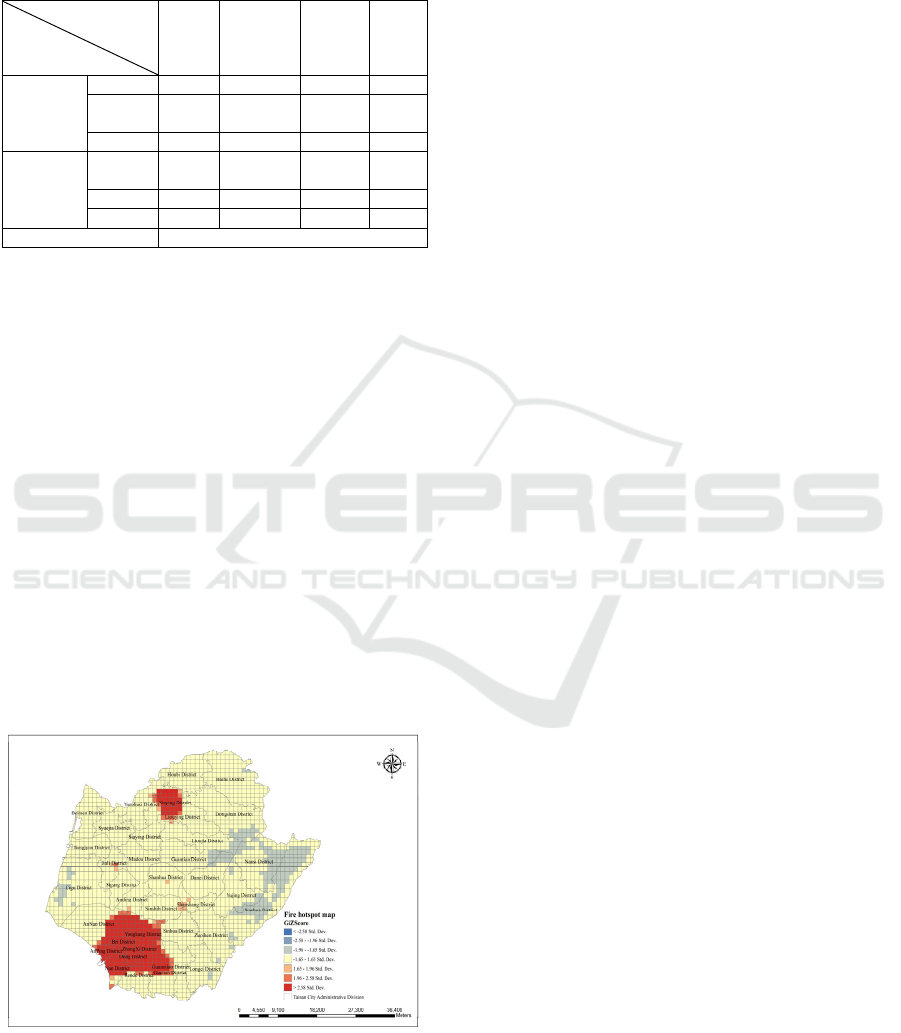
(3) Fire hotspot analysis
The outlines of fire concentration areas were
analyzed using the tool Getis-Ord Gi* to identify
fire hotspots in the city. Figure 11 displays the fire
hotspot map of the city. Two major hotspots
(standard deviator larger than 2.58) are displayed on
the map. The largest fire hotspot surrounds the
administrative area of the rapidly developing
districts, which is close to the downtown center
where more jobs are available, as well as good
educational and medical facilities and living
conditions. The other hotspot is located at the deputy
downtown center, Hsinying District, which has
similar conditions to those of the largest hotspot.
A review of the fire spatial distribution on the
point density and hotspot maps reveals that all types
of fires occurred in the area surrounding the city’s
administration center, which has a population
density of more than a million residents per square
kilometer.
Figure 11: Fire hotspot map in the study area.
(4) Fire cold spot area
Two major fire cold spot areas exist in the map in
Figure 11. One is located in the mountainous area,
which has a considerably lower population and a
low amount of land developed for economic use, as
the land is unsuitable for agricultural use. The other
is located in the coastal area, which has a similarly
small population and low use of land; most of this
area is used for fish farms and a limited amount is
used for agricultural use.
3.2 Deployment of Firefighters
The ratio of the general population to each
firefighter is 1773:1 in Taiwan, and the ratio is
2047:1 in the study area of Tainan City (National
Fire Agency in Taiwan http://www.nfa.gov.tw/ on
May 2014). The ratio is higher than that in some
other developed countries, such as the United States,
where the ratio was 1000/1.33 in New York in
2009–2010 (UFOA, 2011). In some districts of
Tainan such as Yongkang District, the ratio is as
high as 3668:1 in the hotspot area, which is close to
the 4000:1 absolute maximum population that can be
adequately served by firefighters. The deployment of
firefighting teams must be focused on the hotspot
areas of the city.
4 CONCLUSIONS
This study used GIS spatial statistics analysis to
investigate the fire hotspot area distribution in the
study area, Tainan City in southern Taiwan, using
fire data from the years 2004-2013. The point
density map shows the fire, injury, and death
distributions in the city. Spatial statistics analysis
tools for the average nearest neighbor and global
analysis using Moran's I were employed to analyze
whether the fires had a clustered pattern and to plot
the fire hotspot map using the Getis-Ord Gi*
analysis. The results showed the following:
(1) The highest fire risk index is for people over the
age of 80, followed by those aged 60–80.
(2) The spatial distribution of fire locations, injuries,
deaths, industrial fires, house fires, and wild
fires had clustered patterns.
(3) The fire hotspot is the downtown area, which has
high population density, and the cold spot areas
are located in underdeveloped mountainous or
coastal areas with lower population density.
(4) Fire hotspots are highly correlated with house
fires, and fire deaths are concentrated in the
downtown area.
Finally, the results can provide valuable insights
for governments in relation to land development and
GISTAM 2018 - 4th International Conference on Geographical Information Systems Theory, Applications and Management
20

urban planning, and could help plan future
firefighting resource requirements. This study
suggests that other type of disasters can be included
in the analysis because non-fire-related disasters also
require the assistance of firefighters.
REFERENCES
Cáceres, C.F., 2011. Using GIS in hotspots analysis and
for forest fire risk zones mapping in the Yeguare
region, southeastern Honduras, Saint Mary’s.
University of Minnesota University Central Services
Press, Winona, MN, Resource Analysis, 13, 14pp.
Kelly-Hope, L.A., Hemingway, J. and McKenzie, F.E.,
2009. Environmental factors associated with the
malaria vectors Anopheles gambiae and Anopheles
funestus in Kenya, Malaria Journal, doi:
10.1186/1475-2875-8-268.
Lee, Q.C., Chen, C.W., Luo, D.C., Hong, F.F., 2012. A
spatial analysis of criminal cases in Taichuang port
area. Journal of Taiwan Maritime Safety and Security
Studies, Vol 3, No 4, 39-60. (in Chinese with English
abstract).
Liang, L., Clark, J.T., Kong, N., Rieske, L.K. and Fei, S.,
2014. Spatial analysis facilitates invasive species risk
assessment, Forest Ecology and Management, 315,
22-29.
National Fire Protection Association, http://
www.nfpa.org/.
Truong, L.T. and Somenahalli, S.V.C., 2011, Using GIS to
Identify Pedestrian-Vehicle Crash Hotspots and
Unsafe Bus Stops, Journal of Public Transportation,
14(1), 99-114.
UFOA, 2011 available: http://www.ufoa.org/researchfiles/
file00000009.pdf.
Yan, L.E., Hsueh, Y.H., 2010. The Analysis of Spatial
Cluster of Dengue Fever in Kaoshiung City 2010. The
International Conference on Eco-Society and
Sustainable Development, 129-153. (in Chinese with
English abstract).
Yeh, C.K., Chuang, Y.C., Liaw, S.C., 2013. The Spatial
Analysis of Betel Nut Plantation Hotspots in the
Upper Shui-Li Creek Watershed. Journal of Chinese
Soil and Water Conservation, 44(3):202-214.
Hotspot Analysis of the Spatial and Temporal Distribution of Fires
21
