
MedClick Health Recommendation Algorithm
Recommending Healthcare Professionals Handling Patient Preferences and
Medical Specialties
Rui Miguel Dos Santos Patornilho
1
and Andr
´
e Vasconcelos
1,2
1
Instituto Superior T
´
ecnico, Department of Computer Science and Engineering, Lisboa, Portugal
2
Instituto de Engenharia de Sistemas e Computadores, Investigac¸
˜
ao e Desenvolvimento, Lisboa, Portugal
Keywords:
Diagnosis, Recommendation, Health, Interactivity, Reliability.
Abstract:
Today’s health has a determinant role and it is a subject of concern by society. Diagnosing a disease or obtai-
ning a medical specialty, given a set of symptoms, is not a trivial task and different decisions and approaches
can be adopted to solve and handle this problem. Expert systems advise patients about a possible diagnosis,
associated diseases, treatments and more concrete information about a disease considering simple symptoms.
However, most systems don’t have the recommendation component of a medical doctor, which will be the
differentiating factor of this research. The aim of this paper is to develop an algorithm capable of determining
the medical specialties associated with a set of symptoms and diseases, and based on the medical specialties
obtained, recommend the most suitable specialists. The algorithm is divided into two phases: Health Scree-
ning and Healthcare Professional Recommendation. Health Screening has the purpose of determining and
computing all the medical specialties probabilities, given a set of patient symptoms and applying a statistical
model based on all the relations symptom→disease and disease→medical specialty. Healthcare Professional
Recommendation has the purpose of recommending the best healthcare professionals, given a set of patient
preferences, applying a weighted mean average, where each weight of a healthcare professional feature is
given by a patient according to his preferences. This algorithm was evaluated through a set of test cases, ha-
ving a database with information about symptoms, diseases and medical specialties. This algorithm was later
compared to other systems that have the same purpose, to access its quality. The comparison result between
the algorithm and WebMD system indicates that the diseases found by the solution are in 80% of all the cases
equal to the diseases found and pointed by WebMD system.
1 INTRODUCTION
Health today has been more and more often a sub-
ject of continuous research and improvements. These
improvements are ranging from new treatments, new
medicines, new improvements into how to diagnose a
patient, among others. Added to these improvements,
an easier way of exchanging information about disea-
ses, symptoms, treatments, among other health topics
have been performed. Numerous platforms as web
health blogs and health applications allow scheduling
of medical services as appointments, medical diag-
nosis based on symptoms and biometric data, among
many other functionalities available.
This research has the goal of developing a he-
alth algorithm that based on a patients symptom set
must determine and compute all the medical special-
ties probabilities, having into account all the relations
between: symptom → disease and disease → medi-
cal specialty. After computing all the medical speci-
alties probabilities, the algorithm must recommend a
set of healthcare professionals most suitable to deal
with the medical specialty set obtained previously. A
set of features such as Rating, Price and Distance, be-
side the medical specialty probability can influence
the recommendation process.
A variety of different techniques and a set of sy-
stems that are able to perform diagnosis have been
analyzed in Background Section. These techniques
and systems are the research and the basis of the solu-
tion definition and respective implementation, descri-
bed in Health Recommendation Algorithm Section.
This solution has been tested with a dataset, a set of
different test cases and compared with other similar
systems, in order to measure its accuracy and reliabi-
lity. These results are presented in Results And Dis-
Miguel Dos Santos Patornilho, R. and Vasconcelos, A.
MedClick Health Recommendation Algorithm.
DOI: 10.5220/0006672103870396
In Proceedings of the 20th International Conference on Enterprise Information Systems (ICEIS 2018), pages 387-396
ISBN: 978-989-758-298-1
Copyright
c
2019 by SCITEPRESS – Science and Technology Publications, Lda. All rights reserved
387

cussion Section. This article ends with conclusions
and future work that can be done to improve the solu-
tion.
The major contribution of this work is to deve-
lop a new system capable of recommending the most
suitable healthcare professionals given a set of patient
symptoms and that fulfils as most as possible all the
patient preferences.
2 BACKGROUND
This section presents the state of the art of the met-
hodologies and techniques used to perform diagnosis
and systems able of performing diagnosis and|or re-
commending healthcare professionals according to a
set of features and considering all the patient’s pre-
ferences. A comparative analysis to all the different
methodologies and technologies is performed, in or-
der to point all the advantages and disadvantages as-
sociated. A comparative analysis to all the different
systems analyzed is also performed, in order to point
the main differences and decide which systems are the
most suitable to be a base for the solution.
2.1 Machine Learning
Machine learning is an approach that has the objective
of learning from data and making predictions from
data. Machine Learning is characterized for making
predictions or decisions with all the inputs received,
building a knowledge model and applying the know-
ledge model to a new entry. Based on the previous
experience, one algorithm developed according to a
Machine Learning approach can learn by its own and
it will be able to react with a new experience, in order
to reach a solution or predict something (Mannilat,
1996; Munoz, 2014). Applying Machine Learning
techniques to self-diagnosis is possible, for example
if there is information available about diseases, rela-
tions symptom(s) → disease(s) able to build a know-
ledge model, which can learn and infer conclusions
based on a set of inputs given. Afterwards the algo-
rithm will be able to apply the knowledge model built
to a new input in order to infer a conclusion (diagno-
sis).
2.2 Bayesian Network
A Bayesian network is a probabilistic model that re-
presents a set of variables and their conditional de-
pendencies via a directed acyclic graph. For example,
a Bayesian Network could represent the probabilistic
relationships between diseases and symptoms. Given
all the symptoms, a network can be used to compute
the probabilities of the presence of various diseases.
A directed acyclic graph is composed by nodes and
nodes are linked by edges. Nodes represent random
variables. Meanwhile edges represent the conditional
dependencies between nodes, but two nodes can be
conditionally independent (no path that link the two
nodes). A probability function is associated with each
node, that receive as input a set of values from the
node’s parent variables, and gives as output the pro-
bability of the variable represented by the node (Bay-
esianas and Fred, 1993; Leung, 2007).
2.3 Decision Trees
A decision tree is a decision support tool that uses a
tree-like graph or model of decisions and their possi-
ble consequences, including chance event outcomes,
resource costs, and utility. A decision tree can be li-
nearized into decision rules, for example:
if Fever and Cough and Migraine then Flu
These decision rules represent conditions derived by
association rules that are methods implemented for
discovering relations between variables. For example
if we have Fever, Cough and Migraine it is a possi-
ble sign of Flu. So starting with a main decision node
the tree is traversed by a set of decisions until it’s re-
ached a leaf node that corresponds to a derived con-
clusion based on all the decisions made (Kami and
Jakubczyk, 2017; Quinlan, 1987). Applying a deci-
sion tree to a self-diagnosis algorithm is possible if
we have a set of relations symptom(s) → disease(s),
the tree is traversed using symptoms and reached an
outcome that corresponds to a disease.
2.4 Fuzzy
Fuzzy logic is a form of many-valued logic where va-
riables can have values between 0 and 1. A value is
considered as completely true if equals 1 and com-
pletely false if equals 0. Fuzzy logic is used in cases
where it is not linear to identify if a variable is ab-
solutely true or false, due to the variable’s value and
respective interpretation is ambiguous (different vie-
wpoints) to people (Zadeh, 1996).
An example of a set of rules is:
IF cough and migraine then Flu is moderate
IF cough, migraine and fever then Flu is high
With these rules it is possible to obtain outputs that
correspond, in this case, to the degree of expressive-
ness of Flu given a set of symptoms. Fuzzy logic can
be applied to self-diagnosis with a fuzzy set of each
disease probability given a set of symptoms.
ICEIS 2018 - 20th International Conference on Enterprise Information Systems
388

2.5 Comparative Analysis
Machine Learning offers the ability of discovering
data patterns and possible associations between the
input data. It is also possible to apply different techni-
ques, from artificial neural networks to learning clas-
sifier systems. Machine Learning approaches can suf-
fer from performance issues, due to processing a large
input dataset (mandatory) or indexing data updates. It
is necessary to train the system with several examples
(large dataset), in order to reduce the risk of bad le-
arning, incorrect calculations and to minimize system
performance issues.
Decision Trees can become very big structures if
the number of characteristics and relations between
the data is very large. As such this poses a perfor-
mance issue as computations will become more com-
plex, the greater the tree is. Operations like recompu-
ting a tree, in order to represent a new variable or va-
lue will have a greater delay, diminishing the perfor-
mance of the overall system. However, this approach
is intuitive and easy to learn and use. It is also pos-
sible to represent data such as a hierarchical structure
with levels. It is also possible to combine decision
trees with other different techniques.
Fuzzy Inference is a process which is both flex-
ible and intuitive. It represents a natural way of ex-
pressing uncertain information (possibility of incom-
plete data). This system however can have poor per-
formance due to a large amount of fuzzy inference
rules. The system is also prone to error if the fuzzy
inference rules given are too generic or too specific.
These process can be used in combination with other
techniques, like machine learning.
Bayesian network is a graphical model that repre-
sents probabilistic relationships among variables and
that applies the Bayesian probability. With a Baye-
sian network it is possible to handle incomplete data
sets, learn and infer knowledge about a set of casual
data relationships. It allows the representation and in-
formation extraction from two factors that are belie-
ved to be correlated (a priori knowledge). It is also
possible to update the weight of the directed edges,
based on new data. There are disadvantages associ-
ated as: the computational difficulty of exploring a
previously unknown network, due to the need of cal-
culating all the branches of the network to obtain a
value of one branch. The second disadvantage is that
the prior knowledge must be reliable to have a use-
ful network. An excessively optimistic or pessimistic
expectation of the quality of these prior beliefs, will
distort the entire network and invalidate the results.
2.6 WebMD Symptom Checker
This application has the purpose of inferring a list of
possible conditions, indicated by a set of questions
performed to a user such as: age, gender, followed
by a series of questions including a part of the body
where symptoms occur. A user must answer the fol-
lowing questions to obtain a more precise diagnosis,
however the system is able to determine a possible
diagnosis in cases of lack of information. After pre-
senting the list with all the possible conditions, if a
user clicks on a condition will be presented to him
more information about that condition,(how common
is the disease, the degree of severity, among others).
This application is also able to point the most suitable
medical doctors (specialists) to deal with that condi-
tion. A user is able to choose the feature that will be
responsible for ordering a set of medical doctors, ran-
ging from name, years of experience to distance. Here
the user’s preferences are taken into account at the
time of decision (WebMD, 2017a; WebMD, 2017b;
Whysel, 2012).
2.7 Isabel Symptom Checker
This application is responsible for promoting the
search of medical knowledge to all people, using
the professional Isabel Diagnosis Check-list System,
used by doctors around the world when they’re unsure
of a diagnosis. To obtain diagnosis information it is
only necessary for a user to indicate his symptoms
(unlike most symptom checkers, a user can put in as
many symptoms as he wishes) and it will be provided
a list of the most possible diagnoses that are related to
those symptoms. Each diagnosis has medical infor-
mation associated that complement and explain dise-
ases, treatments and other symptoms. It can also be an
auxiliary way to understand, obtain more information
about a health care status, in order to discuss a possi-
ble health topic with a medical doctor. It is also possi-
ble for a user to find a doctor, offering a functionality
composed by a set of links to various web resources
that offer this functionality. These links take into ac-
count the medical specialty obtained and location, in
order to return the most relevant medical doctors (Isa-
bel, 2017).
2.8 Mayoclinic Symptom Checker
This application is responsible for providing informa-
tion, not diagnosing, a given symptom. The idea is for
the patient to initially choose a symptom. After choo-
sing the symptom, a user needs to point at least one
related factor, in order to complement the information
MedClick Health Recommendation Algorithm
389

that the application will need to determine the possi-
ble related diseases. After a user points his symptoms
and associated causes, a set of diseases that match at
least one cause is presented to a user. If the user clicks
on one of the presented diseases, information about
itself as all the symptoms related and a description,
for example the expressiveness on a population (age,
gender, severity, among others) will be presented to
a user. To each disease it is also present another link
that describes all the associated factors, highlighting
in Bold the user’s selection. This application doesn’t
take into account information related with user’s pro-
file as (age, gender, location, among others). It is also
possible for a user to request a medical appointment,
however it doesn’t have any recommendation tool that
points the best medical doctors to deal with the disea-
ses obtained (MayoClinic, 2017).
2.9 Results and Comparative Analysis
In terms of the number of symptoms insertion, only
”WebMD” and ”Isabel” allow an insertion of any
number of symptoms as a user want, differing from
”Mayoclinic” that only allows a insertion of one
symptom. In terms of the profile information, only
”Mayoclinic” does not take into account the biometric
information about a user (age, gender, weight, among
others). All the other systems, except ”Isabel”, per-
form a set of questions, in order to obtain more infor-
mation that will increase and improve the diagnosis.
In other words, the answers to the set of questions
will provide complementary information that will re-
sult into a more precise and accurate diagnosis (not to
generic). All the systems, if a user requests a more
detailed information, are able to provide a more con-
crete and detailed explanation about all the diseases
obtained with information about risk factors, symp-
toms associated and treatments.
In terms of medical doctors recommendation, only
”WebMD” and ”Isabel” are able to provide a clear
way of recommending the most suitable medical doc-
tors to deal with a specific diagnosis. Isabel differs
from ”WebMD”, due to the recommendation being
done with external applications that can take or not
into account patient preferences such as location, ye-
ars of experience, rating, among others. The most
complete system, considering all the functionalities is
”WebMD”, due to being able to recommend a medi-
cal doctor, ask a user for complementary information
with a set of questions, introduce as many symptoms
as a user needs (no restrictions) and by providing a
detailed and complete information about a health to-
pic (for example, disease). This information will dot
the user with more medical knowledge and provide to
him the basic knowledge to discuss the results obtai-
ned with his medical doctor.
3 HEALTH RECOMMENDATION
ALGORITHM
The methodology adopted to develop the solution was
to divide Health Algorithm into two different parts:
Health Screening and Healthcare Professional Re-
commendation identifying all the dependencies bet-
ween them.
3.1 Solution Overview
In Figure 1 it is represented a diagram that presents
all the components that interact directly with the so-
lution component, including all the interactions bet-
ween them:
Figure 1: Solution Component Algorithm Diagram.
Figure 1 represents all the interactions between
the Health Algorithm component and all the remai-
ning components Database, Server and Application
components. It is possible to see that the Health
Application components interacts with the Database
component, in order to request data, healthcare pro-
fessional data or the health diseases data. Otherwise,
this component connects with the Server component,
in order to obtain the most significant symptom of a
patient. That symptom will feed the algorithm and
being responsible for starting the diagnosis process.
Finally, the last interaction represented is between the
Application and Server component, which is repre-
sented by the symptom exchange between the two
components.
3.2 Health Screening
Health Screening starts by interpreting the most sig-
nificant patient symptom, in other words, the most
important symptom or more expressive. The result
from the symptom interpretation is a set of diseases
ICEIS 2018 - 20th International Conference on Enterprise Information Systems
390

that have the symptom and all the remaining symp-
toms. This result is going to be used to compute each
symptom relevance, in order to obtain complemen-
tary information (if possible). Each symptom rele-
vance corresponds to the number of diseases where
the symptom is present, higher the number of di-
seases present, higher the probability of having the
symptom.
The relevance of each symptom is computed by
the Equation 1:
symptom relevance =
number of diseases
total diseases
(1)
where:
• number of diseases, corresponds to the number of
diseases that have the most important symptom.
• total diseases, corresponds to the total number of
diseases existing.
Equation 1 computes the degree of how a symptom
is presented into all the diseases set (including the di-
seases that don’t have the most significant symptom).
After computing all the symptoms relevances, the al-
gorithm will ask a set of questions to a patient, in or-
der to look for complementary information (presence
of a symptom), improving the accuracy of a diagno-
sis. Having all the patient answers and the respective
information, the algorithm is now able to compute the
diseases weight.
The disease weight is computed by the Equation
2:
disease weight =
∑
relevance symptom
total relevance symptom
(2)
where:
• relevance symptom, corresponds to the relevance
of a patient symptom present in the disease symp-
toms set.
• total relevance symptom, corresponds to the total
relevance value of all the symptoms that a patient
has.
Equation 2 computes the relation between the sum of
the relevance associated with the set of symptoms pre-
sented by a patient and that are present in a disease,
divided by the total relevance of all the symptoms pre-
sented by a patient. Computed all the diseases weig-
hts the algorithm will compute all the medical speci-
alties probabilities associated with all the diseases.
The medical specialty probability is computed by
the Equation 3:
specialty probability =
∑
disease weight
number diseases specialty
total specialties mean
(3)
where:
• disease weight, corresponds to the weight value of
a disease that belongs to the specialty.
• number diseases specialty, number of total disea-
ses of specialty
• total specialties mean, corresponds to the total va-
lue of the mean diseases weights of specialty va-
lues passed to a variable before being updated.
Equation 3 computes the relation between the mean
diseases weight of all the diseases of one medical spe-
cialty divided by the total sum of all the means. After
obtaining all the medical specialties’ probabilities, the
algorithm begins the Healthcare Professionals Re-
commendation phase.
3.3 Healthcare Professionals
Recommendation
Healthcare Professionals Recommendation starts
by considering a set of healthcare professionals featu-
res, that will be used for recommending a healthcare
professional by applying a features set combination.
Several features can be a target of concern.
In our research, considering the data available, we
propose to use for recommend a healthcare professio-
nals the following features:
• Rating
• Distance
• Price of Medical Appointment
Despite all the concerns related to the availability of
the data, these features have been chosen by their im-
portance into performing a recommendation. Rating
can be used to obtain information about a healthcare
professional quality, measure expressed by all the pa-
tients. Distance is important, in terms of determining
the nearest healthcare professionals to a patient, gi-
ven his location and Price of Medical Appointment
is important to choose the cheapest healthcare profes-
sionals for scheduling a medical appointment, among
other factors.
Entering Healthcare Professionals Recommen-
dation and depending of the specialties obtained it is
provided a healthcare professionals set, composed by
all the healthcare professionals able to handle the me-
dical specialties (have at least one medical specialty).
Having the healthcare professionals set, it is neces-
sary to convert all the healthcare professionals featu-
res to a homogeneous scale, in order to obtain better
results and work with homogeneous values. Rating
is by default into a range from 1 to 5 so it is not ne-
cessary to convert this feature. Converting the Dis-
tance and the Price of Medical Appointment to a
MedClick Health Recommendation Algorithm
391

scale from 1 to 5 require dealing with the maximum
value and the minimum value.
Having these two values it is necessary to set the
minimum value to 5 and the maximum value to 1 ap-
plying the Equation 4:
y = mx + b (4)
where:
• m, corresponds to the straight slope
• x, corresponds to the independent variable of the
function y = f(x).
• b, corresponds to the y-intercept of the line
Equation 4 is a straight line equation to compute a
price between the minimum and maximum that has
points point1 (x
1
,y
1
) and point2 (x
2
,y
2
), where x
1
=
minimum, y
1
=5, x
2
= maximum and y
2
=1. Equation
4 has a set of variables that need to be computed, so it
is necessary to follow a set of steps.
The first step necessary is computing the m varia-
ble, applying the expression:
m =
∆y
∆x
=
y
1
− y
2
x
1
− x
2
(5)
The second step corresponds to the computation
of the b variable, applying the expression:
b = y
1
− (m ×x
1
) (6)
After having the two computations it is only ne-
cessary to obtain the respective y, that is the scaled
value.
Completing this set of steps and having all the scaled
features of each healthcare professional, the algorithm
will ask the patient about his preferences, in terms of
Rating, Distance and Price, attributing a value from
1 to 5, where 1 is less important and 5 the most im-
portant. These values are weights that will be used
a Weighted Mean Average. In this step, it is neces-
sary to be considered the following scenarios: patient
points his preferences, patient doesn’t point his prefe-
rences and the past medical history of a patient.
If a patient points his preferences these values
are the weights that will be used a Weighted Mean
Average. If a patient doesn’t point his preferences,
the algorithm will search for his past medical history
(past medical appointments), inferring and computing
the respective weights based on the patient’s medical
history data. Finally, in case of none of the previous
two scenarios, the weights will be equal to each fea-
ture, except the medical specialty probability that is
always assigned a value of 5.
Having all the weights computed, it is necessary
to apply the Equation 7:
weight average =
∑
n
i=1
w
i
∗ x
i
∑
n
i=1
w
i
(7)
where:
• x, set of healthcare professional features
• w
i
, weight of feature x at ith position
• n, total number of features
The final step necessary is ordering all the results
obtained, applying the Equation 7 to each healthcare
professional.
3.4 Technological Architecture
This algorithm has been developed with the following
technological architecture represented in Figure 2:
Figure 2: Technological Architecture Diagram.
In Figure 2 it is represented the technological ar-
chitecture associated with the algorithm. It is repre-
sented a MedClick Application Server that has rela-
tions with all the three other components. These re-
lations are represented by all the HTTP requests per-
formed to the server component, and by all the reque-
sts performed from the server to the database compo-
nent. Google Maps API is a component responsible
for handling all the requests performed by the Med-
Click Application Server, ranging from geocoordina-
tes, addresses to compute distance, among others.
Node JS modules are a set of components that are
responsible for ”feeding” our solution with data struc-
tures, methods, among other relevant libraries that
will allow our solution to work in a set of different
situations. In this figure an example of a Node JS
component is Node JS Express responsible for crea-
ting a server responsible for answering and handling
requests from other devices.
The Postman component is an external compo-
nent responsible for making HTTP request, in order
to obtain a given answer. The last external component
that was used is PostgreSQL, responsible for hand-
ling all the connections and requests between the da-
tabase and the application server. This module for ex-
ample, will load the data that a application will need
and that will be requested by the MedClick Applica-
tion Server.
ICEIS 2018 - 20th International Conference on Enterprise Information Systems
392
3.5 Solution Assumptions and
Approach
Different approaches, ranging from machine learning
to inference rules are possible ways, differing into
some aspects. Our algorithm measure and points a set
of medical specialty probabilities, allowing a friendly
interactive way of communication between a patient
and the system. The approach chosen is based on
Bayesian Network, due to being possible to represent
all the relations symptom → disease in an intercon-
nected network and taking into account all the relati-
ons and dependencies between the data. The reasons
that led to choose this approach are: the genericness
of the algorithm (several medical specialties, symp-
toms and diseases), due to not be suitable to create
datasets and test cases (large volume) that are manda-
tory to ensure reliability and accuracy to the algorithm
by a Machine Learning approach. Our solution points
and calculates probabilities (more than one possible
medical specialty), being in this case Decision Tree
a bad approach, due to it possibly being a huge and
sparse structure, being hard to transverse and in the
most of cases it only is able to point one output.
To the Healthcare Professional Recommenda-
tion the initial approach is to use a correlation met-
hodology, in order to find similarities between the
healthcare professionals data and the patient charac-
teristics (past medical appointment records). Howe-
ver this can have some issues such as, for example,
if we have two professionals with same characteris-
tics only differing in rating. Assuming that a patient
visited only healthcare professionals with low rating,
the tendency is to first recommend the healthcare pro-
fessionals with the lower rating, however the healt-
hcare professional with the higher rating should be re-
commended first. The chosen approach is a weighted
average, after being asked all the patient preferences,
features that the patient consider more relevant.
4 RESULTS AND DISCUSSION
The algorithm proposed has been evaluated conside-
ring the two components in separate and after with a
global evaluation. The Health Screening was evalua-
ted by a set of internal tests and comparing the results
of this algorithm with similar systems that perform di-
agnosis. The Healthcare professionals Recommen-
dation was evaluated by a set of internal tests, which
is composed by different cases of patient preferences,
ranging from preference for one feature in demand of
the others, more that one feature preference to equal
feature preference.
4.1 Dataset
Starting with the Health Screening, this algorithm
has a dataset composed by: 50 diseases, 50 disea-
ses associated with 10 medical specialties different,
and 388 relations symptom → disease. The dataset
available for performing the Healthcare Professio-
nals Recommendation is composed by: 7 healthcare
professionals with the respective information about
their rating, appointment price, health care provider
and medical specialty(ies). Also, there are 4 health
care providers present in the dataset.
4.2 Health Screening Results
This subsection presents results of a set of medical
specialties probabilities obtained (output), given a set
of patient symptoms (input).
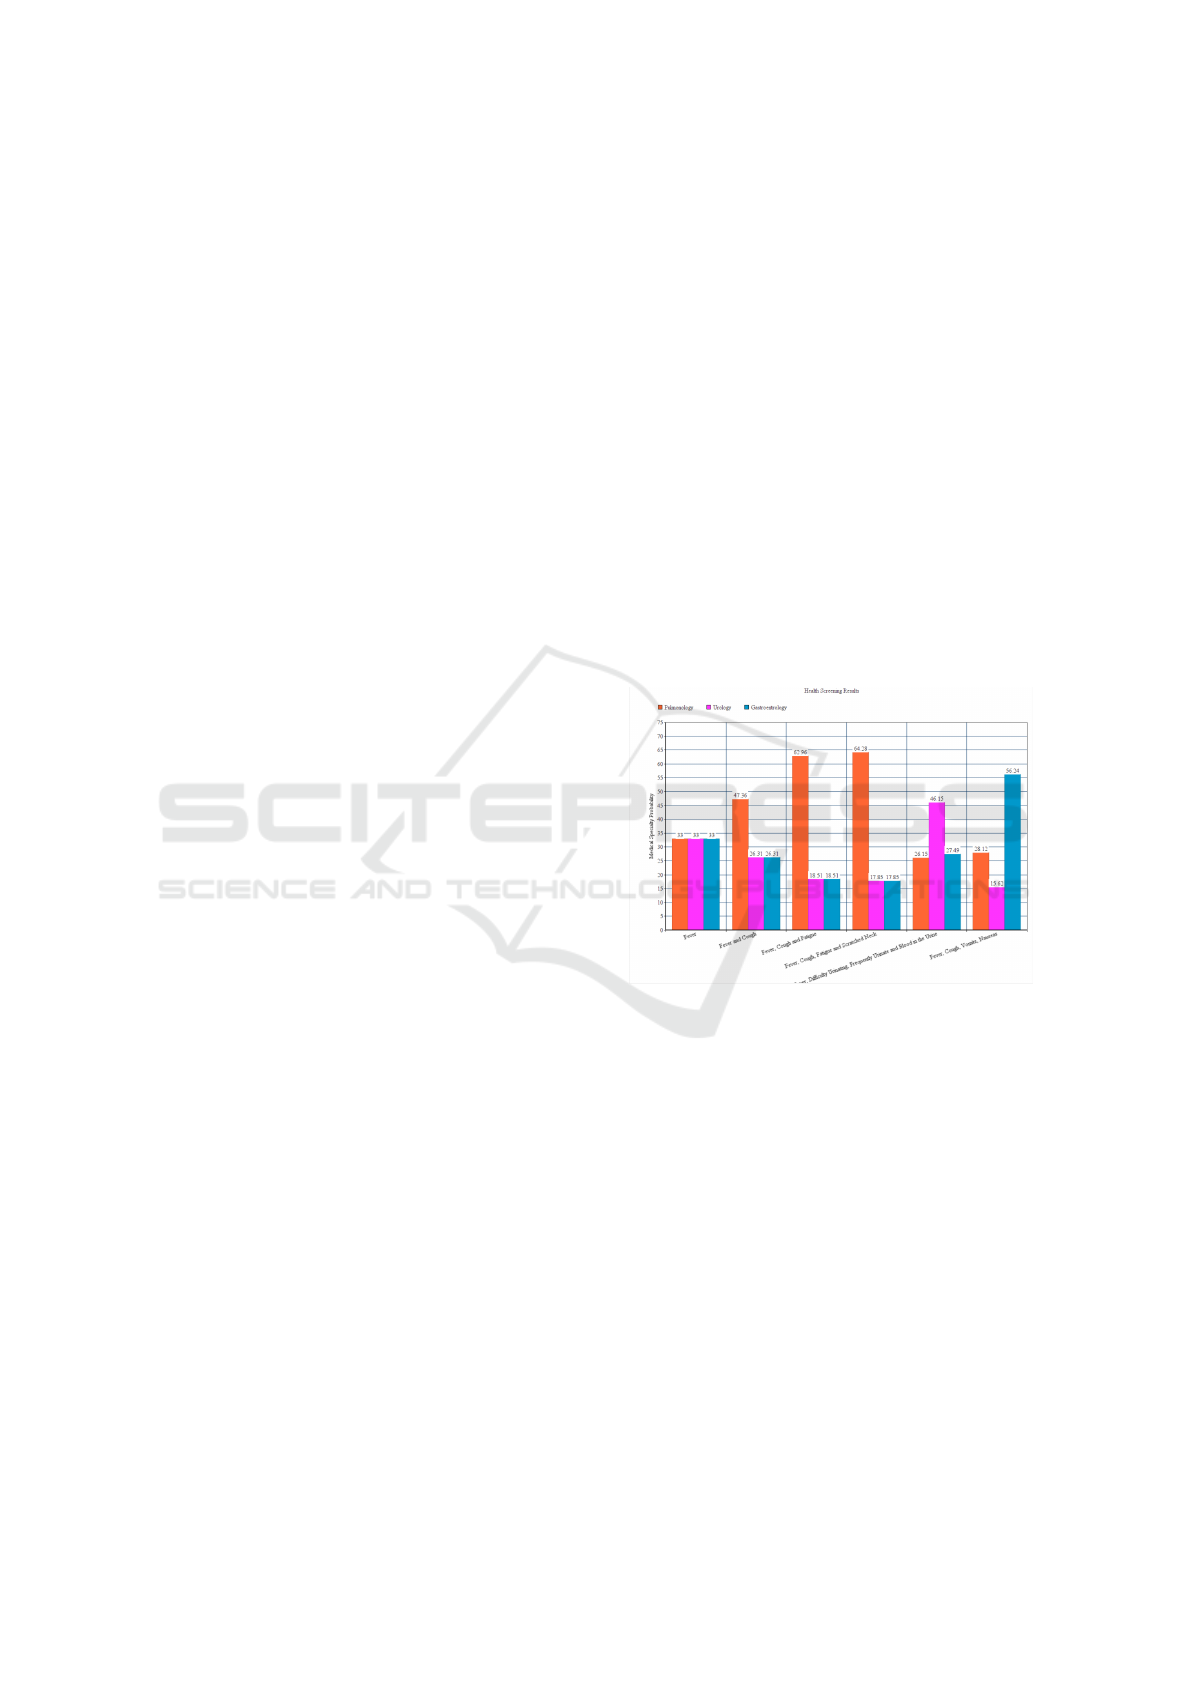
Figure 3 represents a set of results expressing the
variation of medical specialties probabilities, given a
symptoms set.
Figure 3: Health Screening Results.
From Figure 3 it is possible to see the set of re-
spective symptoms inputs (represented by the x axis )
and the corresponding algorithm outputs medical spe-
cialties probabilities (represented by y axis). It is ex-
pected that with different symptoms the medical spe-
cialties probabilities are different, indicating that, for
example one medical specialty is more expressive gi-
ven a set of symptoms and that these symptoms are
more relevant on diseases that belong to that medical
specialty.
The different symptoms inputs are composed by
symptoms ranging from one symptom to four, howe-
ver more symptoms can be added to the set. The input
characterized by only a single symptom presents an
equal probability to each medical specialty, due to this
symptom be present in all diseases with equal weig-
hts and how each disease has a similar weight, all the
medical specialties probabilities will be similar.
MedClick Health Recommendation Algorithm
393

The dataset contains diseases that only have one
symptom or two, among other different possibilities,
being the results obtained according all the symp-
toms. The symptoms set with more than one symptom
will have a medical specialty with a higher value as
represented in Figure 3. The set that has Fever and
Cough present a higher result in Pulmonology, due to
these symptoms being present with more expressive-
ness on diseases of that medical specialty. Otherwise,
adding Vomits and Nauseas to the previous symptoms
set will increase the probability of Gastroentrology,
due to the previous symptoms and the new ones be
more expressive on diseases that belong to the Gas-
troentrology medical specialty.
These results are expressive that the algorithm
with more than one symptom is able to identify in a
more clear way all the medical specialties and compu-
ting their probabilities on a more precise way. More
information provided, more than one symptom, corre-
sponds to be possible to not having all diseases with
the same symptoms, due to the existence of symptoms
that are more relevant into a restrict set of diseases,
that will allow different medical specialties probabili-
ties.
4.3 Healthcare Professionals
Recommendation Results
This section presents the results of applying patient
preferences on the recommendation phase to different
healthcare professionals features.
In this case all healthcare professionals have a Rating
associated that can be different, their medical speci-
alties can be Cardiology or Pulmonology and they
work in different places expressed at:
• Provider 1, Distance: 11.874 Km
• Provider 2, Distance: 20.053 Km
• Provider 3, Distance: 333.792 Km
The price of medical appointments is expressed at:
• Cardiology, 55 euros
• Pulmonology, 60 euros
To simplify it is implicit that the medical specialties
probabilities obtained are equal (0.5).
The Healthcare Professionals Features are availa-
ble in:
• Professional 1: Cardiology, Rating: 5, Provider:
Provider 3
• Professional 2: Cardiology, Rating: 3, Provider:
Provider 1
• Professional 3 : Pulmonology, Rating: 2, Provi-
der: Provider 1
• Professional 4: Pulmonology, Rating: 4, Provi-
der: Provider 2
Figure 4 represents a set of results expressing the
variation of the healthcare profession weighted mean
average, given a set of healthcare professional featu-
res.
Figure 4: Healthcare Professionals Recommendation Re-
sults.
From Figure 4 it is possible to see a set of re-
spective healthcare professionals (represented by the
x axis ) and the corresponding algorithm outputs (re-
presented by y axis) Weighted Average result accor-
ding to a patient preference. Each bar is representative
of a patient preference that could be only one prefe-
rence pointed, equal preference or a combination of
features preferences. This figure represents the re-
spective classification to all the healthcare professi-
onals considering all the patient’s preferences, scaled
from 1 to 5 as the healthcare professionals features.
To an individual preference if there aren’t signi-
ficant differences on the remaining features it is ex-
pected that the healthcare professionals with the hig-
her value on the patient feature preference have a hig-
her value. For Distance preference, it is expected that
the healthcare professional with the highest value is
Professional 2, due to this professional has a lowest
distance to the patient address. Figure is representa-
tive of this fact, given the presence of 3.791 for Pro-
fessional 2, followed by Professional 4 with a value of
3.49. The same expectations are applied to the Price
and Rating features. To the equal preferences it is ex-
pected that the professionals with a higher mean fea-
tures values (closer to 5) have the highest results. It
is expected that Professional 2 has a highest value, gi-
ven having the best medical appointment price, wor-
king in the closest health provider and having a good
rating value (3), fact once more represented by the re-
sults obtained.
Combining preferences will indicate better results
in healthcare professionals that present a highest va-
lue on the features that are combined. In terms of
ICEIS 2018 - 20th International Conference on Enterprise Information Systems
394

combining Rating and Price it is expected that the hig-
hest value is presented by Professional 1, given the
highest values of these two features. The obtained re-
sults show that this fact is reached, due the highest
value be associated with Professional 1. To the com-
bination of Rating and Distance it is expected that the
professional with the highest value is Professional 4,
due to despite not having the highest values as pos-
sible (Professional 1 has a higher value of Rating)
this professional has the highest combination values
of these features. The results present that this fact is
addressed.
4.4 Health Systems Comparative
Analysis
The system was compared with similar systems by a
set of 19 test cases, where each test case is identified
by a set of systems (provided as input) and a set of
diseases (provided by each algorithm as output). The
results present in Figure 5 are the respective percen-
tage of the same outputs identified by the system with
the remaining systems output.
In Figure 5 it is represented a comparative analysis
between our system outputs and the other systems that
have the same behavior:
Figure 5: Comparative Systems Analysis.
In Figure 5 are represented the respect high pro-
bability value between all the diseases output matches
(our system and other systems), the Mean probability
value of all the examples used to compare our solu-
tion with the remaining systems and the Lowest pro-
bability value obtained. From this figure it is possible
to see that all the systems have a High matching pro-
bability value of 1, indicating that in the presence of
that symptoms the output of our system is the same
of all the remaining systems. Note that the datasets
are different and the respective relations symptom →
disease are different from ours. In terms of the Low
matching probability value, the ”Mayoclinic” system
has a value of 0, indicating that no disease is pointed
by our system, given the symptoms presented.
Finally, in terms of the Mean matching probabi-
lity value, the highest probability value is presented
by the ”WebMD” system with a value of 0.8, clo-
ser to 1 (representing a perfect match). Comparing
our solution to all the other systems it is possible to
see that, despite some diseases matching probabilities
being low, with ”WebMD” system these probabilities
values are higher. The obtained probability result is
of 0.8, which indicates that our system is able to iden-
tify the same diseases in 80% cases as the ”WebMD”
system, despite the different approaches and different
datasets.
5 CONCLUSIONS
Medclick Health Recommendation Algorithm is
able to diagnose a patient given a symptom and with
the symptoms suggested to the patient is able to per-
form and reach a sustainable conclusion about the
probability of each medical specialty. The algorithm
is also able to recommend an ordered list of medical
doctors able to deal with the health specialties obtai-
ned at the health screening phase and that fulfill all
the patient preferences, in terms of distance, rating
and price. Our algorithm is able to deal with clinical,
patient and healthcare professional data and perform a
decision that is the most suitable as possible, in order
to facilitate the patients work when it has to choose
and decide where he should go given a set of symp-
toms.
The obtained results indicate that comparing our
solution with other similar approaches already in use
show that MedClick achieves acceptable results. The
comparison measures are a mean value of 0.8 with
”WebMD”, 0.52 with ”Isabel” and 0.33 with ”Mayo-
clinic”. Despite the higher value be 0.8, and consi-
dering that all these systems have different datasets,
including different relations symptom → disease, it is
possible to conclude that our solution is able to iden-
tify and point the majority of the diseases correctly
as any other similar system. Otherwise, all the tests
performed to our solution point that it is able to iden-
tify and point diseases and respective medical spe-
cialties in the presence of few and large symptoms.
The results obtain show that comparing the probabi-
lities variation with one symptom and more than one,
the solution increases the accuracy in the presence of
more than one symptom. Results show that our so-
lution with Fever as a symptom points an equal pro-
bability to each medical specialty and with Fever and
Cough as symptoms, the medical specialty probabi-
lity of Pulmonology increases facing the decrease of
the other medical specialties (accuracy increases).
Finally, to the healthcare professional recommen-
dation the results indicate that our solution is able to
recommend the ”best” medical doctor according to
all the patient preferences. In our solution, a set of
patient preferences is a determinant factor that influ-
ence the recommendation process, in order to reach,
such as possible, all the patient preferences and ex-
MedClick Health Recommendation Algorithm
395

pectations. Results show that if a patient prefers he-
althcare professionals with lower Price, the first healt-
hcare professional to be pointed is the healthcare pro-
fessional with the lowest Price. Otherwise, it is also
possible to combine features, Price and Distance. In
this case the results show that the healthcare profes-
sionals will be present by ordering all the healthcare
professionals by the Price and Distance. The first he-
althcare professional to be recommended to a patient
is the professional with the lowest Price and the lo-
west Distance.
5.1 Future Work
This system can be target of improvements. One
possible improvement is to decrease its genericness,
choosing carefully which medical specialties it will
be able to diagnose, in order to improve its accuracy
and reliability applying techniques as Machine Lear-
ning, providing concrete text cases and examples that
will feed the system and building a knowledge model
to be applied to increase the precision and accuracy
of a diagnose process. This system is also able to
handle more features as age of healthcare professio-
nal, gender, information about his Curriculum Vitae
(CV), statistics about the probability of a given po-
pulation have a certain disease, among others. These
set of features added will improve the accuracy and
reliability, in terms of diagnosing and healthcare pro-
fessional recommendation. For example, there are di-
seases that are more expressive in males that in fe-
males. Otherwise having more features available for
healthcare professionals, will allow that a patient can
have more options to point his preferences and that
the recommendation will be done with a more diverse
set of features and can be a more efficient and diverse
process. The last possible improvement can be, pro-
viding the system with an interface available for user
testing, in order to obtain the degree of satisfaction
and respectively measuring the systems user quality.
A similar approach to healthcare professionals can be
also performed.
ACKNOWLEDGEMENTS
This work was supported by national funds through
Fundac¸
˜
ao para a Ci
ˆ
encia e a Tecnologia (FCT) with
reference UID/CEC/50021/2013.
REFERENCES
Bayesianas, R. and Fred, A. L. N. (1993). Redes Bayesi-
anas. Instituto Superior Tecnico da Universidade de
Lisboa.
Isabel (2017). Isabel Symptom Checker Info. https://
symptomchecker.isabelhealthcare.com/home/main.
Kami, B. and Jakubczyk, M. (2017). A framework for sen-
sitivity analysis of decision trees. SGH Warsaw School
of Economics, Warsaw Poland.
Leung, K. M. (2007). Naive Bayesian Classifier. POLY-
TECHNIC UNIVERSITY.
Mannilat, H. (1996). Data mining : machine learning , sta-
tistics , and databases. University of Helsinki, pages
2–9.
MayoClinic (2017). MayoClinic Symptom Chec-
ker Info. http://www.mayoclinic.org/about-this-site/
about-symptom-checker.
Munoz, A. (2014). Machine Learning and Optimization.
Technical report, Courant Institute of Mathematical
Sciences, New York.
Quinlan, J. (1987). Simplifying decision trees. Interna-
tional Journal of Man-Machine Studies, 27(3):221 –
234.
WebMD (2017a). WebMD Symptom Checker. http://
symptoms.webmd.com/%0A.
WebMD (2017b). WebMD Symptom Checker.
http://symptoms.webmd.com/default.htm#introView.
Whysel, N. (2012). A User Test of WebMD Symptom
Checker A User Test of WebMD Symptom Checker
Table of Contents. WebMD, pages 1–29.
Zadeh, L. A. (1996). Selected Papers by Lotfi A . Zadeh.
World Scientific.
ICEIS 2018 - 20th International Conference on Enterprise Information Systems
396
