
Debugging Remote Services Developed on the Cloud
M. Subhi Sheikh Quroush and Tolga Ovatman
Department of Computer Engineering, Istanbul Technical University, Maslak, 34469, Istanbul, Turkey
Keywords:
Cloud based Development, Remote Service Debugging, Record/ Replay Debugging.
Abstract:
Cloud based development platforms are getting more widely used as the cloud services become more available
and the performance of such platforms increase. One of the key issues in providing a cloud based development
platform is to enable the developers to debug their code just as efficiently and effectively as they would perform
in a desktop IDE development session. However, especially if the development of a remote service is being
carried out, the debugging client and the server running the actual code is separated, disclosing many problems
which are not present in a usual debugging session. This paper proposes a record/replay approach to deal with
the problems of remote debugging. To keep the communication overhead of the proposed approach as small
as possible,the debugger saves the variable values only for external data access such as getting the data from
a database query or a web service call. The proposed approach is integrated to a real world cloud based
development platform and the run-time overhead is measured on real world case studies to demonstrate the
usefulness of the approach.
1 INTRODUCTION
Continuous shift in modern software development ac-
tivities towards cloud environments and the expan-
sion of the software ecosystem that uses remote ser-
vices has made the remote debugging of web soft-
ware a more appealing challenge. Developers use and
develop their own remote services in various differ-
ent purposes while developing web based software.
However debugging of the in house developed client-
server web service interaction is cumbersome since it
requires an interactive tracking session where the de-
veloper needs to watch remote but yet interdependent
variables and control flows.
One way to ease such a challenge for the devel-
oper is to be able to record and replay the erroneous
flows that has been triggered by the remote calls to
the web service including the variable values. In de-
bugging such errors developers dig into the error logs
performing a postmortem analysis which becomes a
needle in a haystack problem most of the time.
In this paper we present an approach for helping
the developer initiate and track a remote debugging
session by being able to record and replay the errors
that were triggered by the web service call. During the
recording session we record the local variable values
and replies from the database calls which in turn en-
ables the developer to run a debugging session by re-
playing the erroneous flow of the remote service with
the erroneous variable values.
We also measure the overhead presented by our
approach and present a lightweight version of the ap-
proach where we significantly decrease the amount
of overhead by only recording the variable evalua-
tions that are affected by external data access like a
database query. Variable evaluations that were deter-
mined solely by program flow are left to be calculated
by the client instead of being recorded at the server
side, reducing the amount of additional information
to be stored by the remote debugging engine.
In the past, a vast amount of work have been per-
formed on debugging web services and web applica-
tions. We have adopted the interactive record/replay
approach presented in the work of Brian Burg et al.
where (Burg et al., 2013) a user interface is used for
capturing and replaying web application executions.
In our study we have shifted the focus on the applica-
bility of the approach on web services being used in a
cloud based platform.
The rest of the paper is organized as follows: in
Section 2 we present our remote debugging approach.
Section 3 presents the overhead generated by apply-
ing the remote debugging approach presented. Sec-
tion 4 discusses the related work in the literature and
we conclude our studies and present future work in
Section 5.
426
Sheikh Quroush, M. and Ovatman, T.
Debugging Remote Services Developed on the Cloud.
DOI: 10.5220/0006691604260431
In Proceedings of the 8th International Conference on Cloud Computing and Ser vices Science (CLOSER 2018), pages 426-431
ISBN: 978-989-758-295-0
Copyright
c
2019 by SCITEPRESS – Science and Technology Publications, Lda. All rights reserved
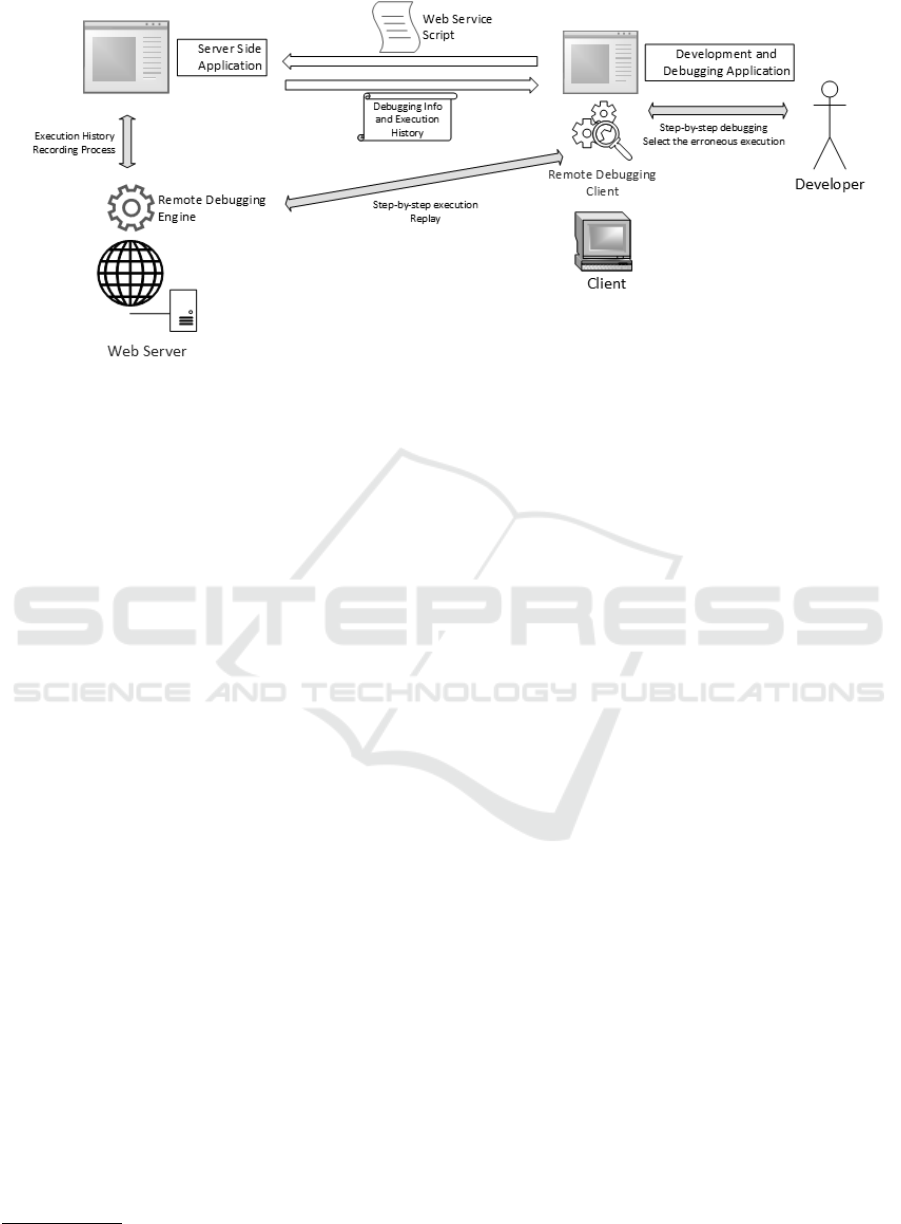
Figure 1: Architectural representation of the remote debugging approach.
2 REMOTE DEBUGGING
APPROACH
In our study, we integrated our remote debugging ap-
proach to a target cloud platform that enable users to
develop web applications on the web browser
1
. The
developer can define the data model (the entities and
the fields) and also she/he can design the web pages
of the application. The target platform also lets user
to develop the behavior associated with the web el-
ements using MVEL scripting language (Brock and
various contributors, ) as well as developing their own
web services.
MVEL has largely been inspired by the Java syn-
tax, but has some fundamental differences aimed at
making it more efficient as an expression language,
such as operators that directly support collections, ar-
rays and string matching, as well as regular expres-
sions. MVEL is used to evaluate expressions written
using Java syntax.
The components and the typical information flow
during a remote debugging session can be seen in Fig-
ure 1. Remote debugging components let the devel-
oper in the cloud platform to be able to execute and
debug the MVEL script under development line by
line interactively on the server side. A sample devel-
opment session in the web client using MVEL scripts
can be seen in Figure 2.
By using remote debugging, the developer can use
traditional debugging features such as breakpoints,
stepping over, stepping inside a function. Moreover
since the state of the server is changed during the de-
bugging session, the debugging engine also saves the
1
Imona Cloud:https://www.imona.com/
state in the server at each state. This extra debugging
information that is being saved can be controlled by
the developer. By default, the web service debugger
does not perform any state recording. The developer
can choose ’minimal recording’ or ’full recording’ to
set the amount of state information to be saved by the
debugging engine as seen in Figure 2.
After fixing the bug, the developers need a tool
to help them to make sure that the issue is solved by
the fix. In our approach, the developer can use the
saved input values that causes the error and re-run the
program with the saved values and debug the code
again to make sure that the code is working after the
fix.
2.1 Full Recording
When the developer chooses full recording, the re-
mote debugging engine running on the the server will
execute the web service by storing the variable evalu-
ations during assignment statements. Variable evalu-
ations will be stored as tuples containing line number
of the assignment, the variable name and its value.
Hence, at any time the developer can choose and re-
play the erroneous execution by selecting it from the
list of execution records as seen in Figure 2.
For each debugging session, the execution engine
saves the requests that were sent by the client to the
server. The developer may replay the recorded de-
bugging session later by using the remote debugging
system. When the developer replays an execution, the
platform will get the saved data according to its time
and display them in the variable table as seen in Fig-
ure 3
Debugging Remote Services Developed on the Cloud
427
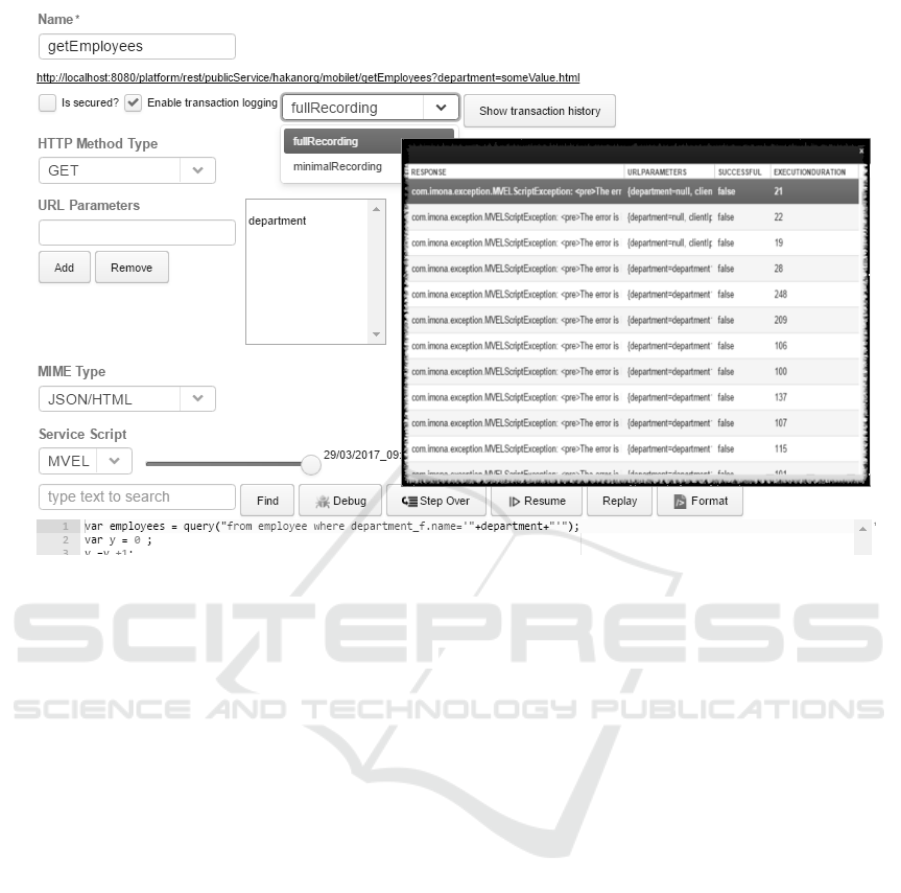
Figure 2: Selecting the type of recording session and web service to be debugged. Bordered window on the right shows the
list of recorded debugging sessions.
At every step of the execution the debugging client
will update the variable values in the table and the cor-
responding line will be highlighted. Even though full
recording produces a significant amount of overhead
it might be necessary to store the whole environment
to be able to store the data retrieved by database query
or a service call during the debugging session.
2.2 Minimal Recording
To reduce the amount of overhead presented by
the approach the developer may select the minimal
recording option. During minimal recording the plat-
form will save the variable values only for external
data access such as getting the data from a database
query or a web service call. During replaying of a
debugging session with minimal recording, the lines
that contain external data access will be updated by
the recorded history. Otherwise the related line will
be executed directly and the variable values will be
updated from the execution result.
3 EVALUATION
To evaluate the overhead produced by remote debug-
ging, we prepared sample web services to measure the
effect of three different metrics:
1. m
1
: Number of database queries/service calls
2. m
2
: Lines of Code (LOC)
3. m
3
: Number of variables
Our experimentation environment consists of a
client and a server machine that reside in the same
local network to eliminate the latency introduced by
network access. Client computer consists of 8 giga-
bytes of memory and a 4 core 2.20 Ghz processor
where server contains 32 GB memory and double 4
core 3.5 Ghz processors. The only application stack
hosted by the server is debugged development envi-
ronment server and a single developer runs the pro-
posed debugging approach at a time. MySQL 5.7 is
used in database operations required by the proposed
debugging approach and the debugging application
is hosted as an add-on to the development platform
that is hosted in an Apache Tomcat 7.0.82 application
server.
In Figure 4 we compare the execution time of the
sample web service without any recording options to-
wards the overhead presented by the full and minimal
recording for the debugging session. To eliminate the
effect of environmental factors on the execution we
repeat the experiment 20 times and present the error
rate as well in the figure. In Figure 4 we can notice
that the minimal recording method performs better
CLOSER 2018 - 8th International Conference on Cloud Computing and Services Science
428
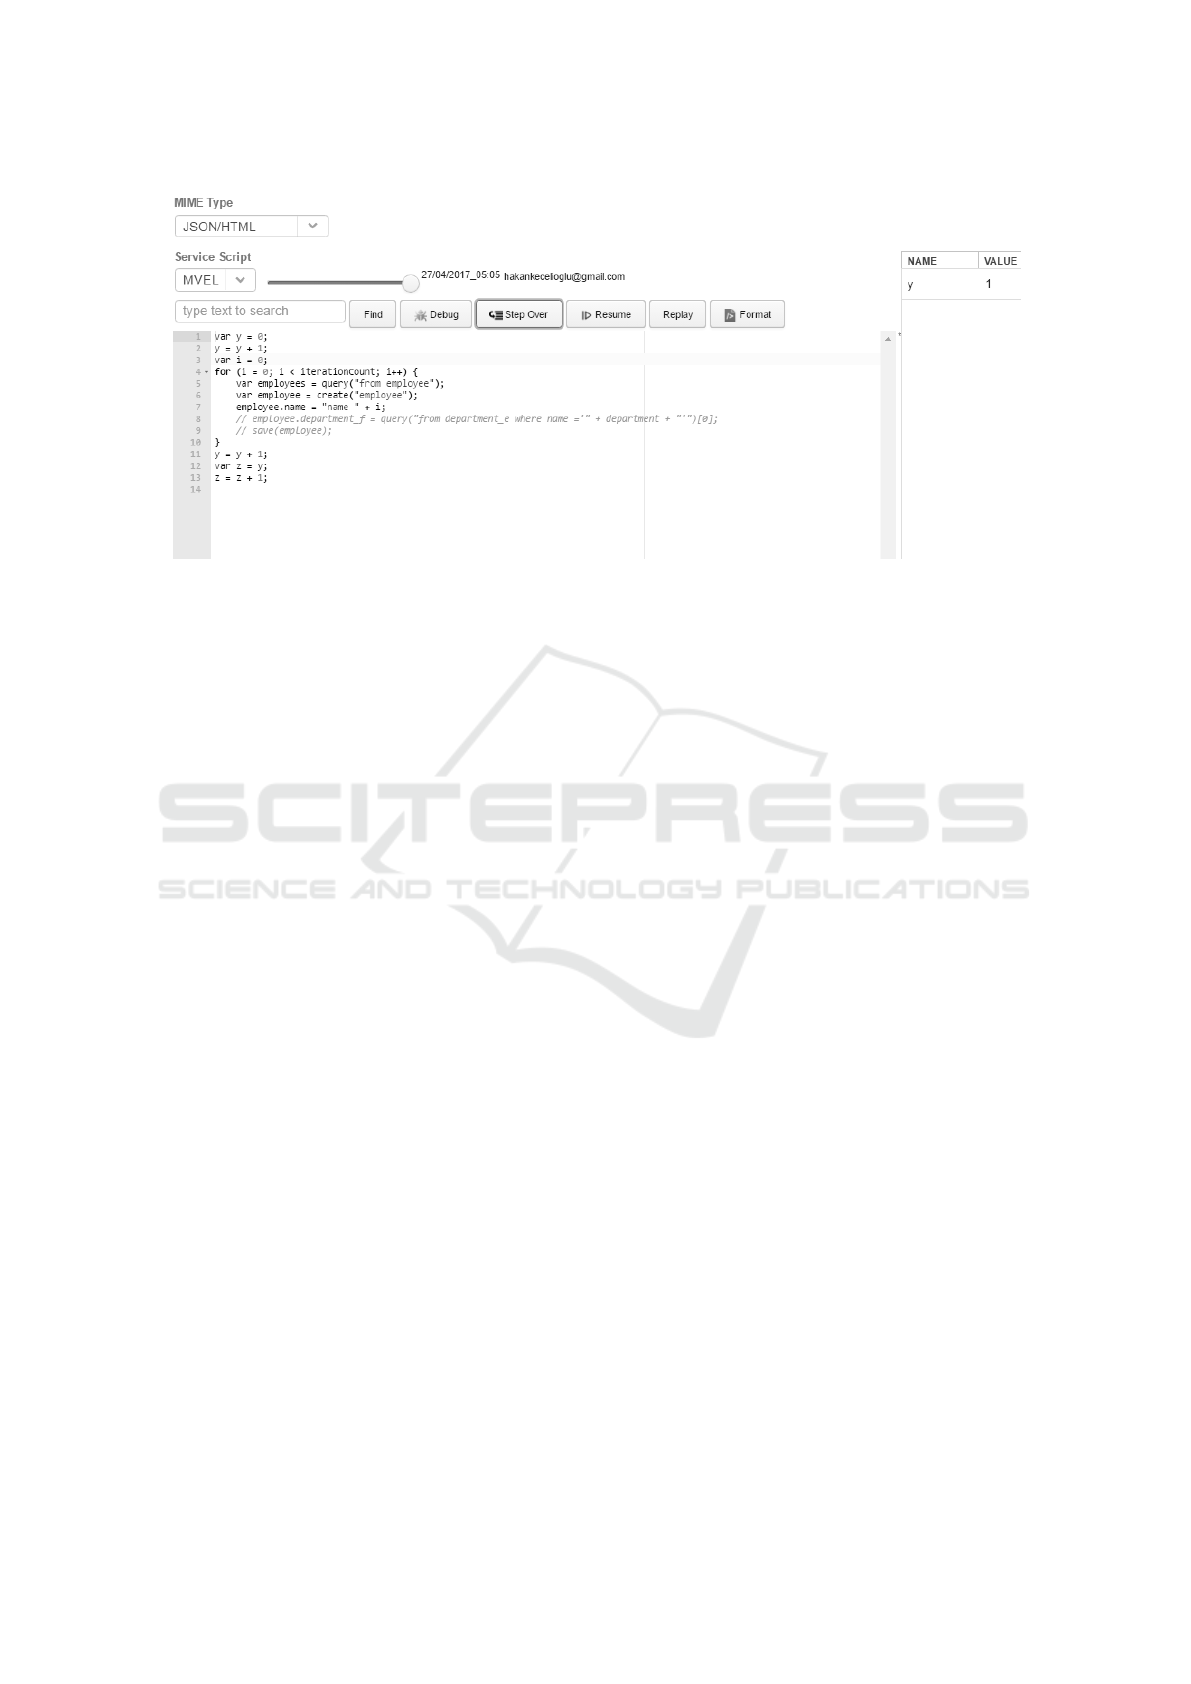
Figure 3: MVEL script development window and variable evaluations table (on the right).
than the full recording as expected when we are in-
creasing the number of m
1
.
In Figure 5 and Figure 6 we repeated our experi-
ments for m
2
and m
3
using the same experimentation
environment. For m
2
the full recording method per-
formance decreases dramatically as LOC increases.
Minimal recording performs significantly better in
this case. For m
3
, changing the number of variables
will not affect the performance of the full recording
because the platform stores the data for each line and
it is not related to the number of variables. The mini-
mal recording is not affected as well.
4 RELATED WORK
In our study we present a remote web service de-
bugging approach by using a record/replay technique
on the remote server where web service is being
hosted. Record and Replay is a good concept to detect
the errors in the running systems so we can use the
recorded information to detect the errors. A similar
record/replay approach by Brian Burg et al. records
the inputs, the variables which are related to the sys-
tem state and the web calls for the web applications.
When the developer wants to debug the program a
user interface is presented to the developer for the cur-
rent state of the program using the stored data (Burg
et al., 2013).
Tools like TRACR (Troberg et al., 2015) pro-
vides developer with live editing features. By using
TRACR the developer can change the JavaScript code
and see the result without running the web application
again, a feature of the remote debugging system that
we have implemented in our study as well.
We use the server side associated with the re-
quest from the client to debug the web services. Fid-
dler (Telerik, ) uses the client side to analyze the web
services responses.
One of the main concerns in applying the
record/replay technique is the amount of information
that has to be stored during the recording phase. One
of the approaches to deal with this problem is reduc-
ing the number of statements that the developer can
check during the debugging. In our study we realize
this approach by repeating the execution of the erro-
neous code with the stored values that causes the er-
ror.
The developer can understand the root cause of the
error by debugging the execution history stored with
the values that cause the error. An alternative way
to recording histories can be using the statistical de-
bugging to detect the place of the error by finding the
probable location error automatically as in the case
of the HOLMES framework (Chilimbi et al., 2009).
Paths profiles give the developer extra information
about the execution that leads to the error.
Using Holmes, the program will not use extra re-
sources if there are no errors until facing an error. In
case of an error, Holmes will update the application to
detect the error. Our approach is similar to HOLMES
to optimize the performance by recording the execu-
tion only if the service is throwing an exception. So
after throwing the exception we execute the service
again to record all the details.
HOLMES will combine the information collected
from the static analysis of the code with the infor-
mation collected from the bug reports to specify the
programs parts that are most probably related to the
errors.
Another approach to selectively debug execution
paths is to use slicing techniques. For instance, Cheng
Debugging Remote Services Developed on the Cloud
429
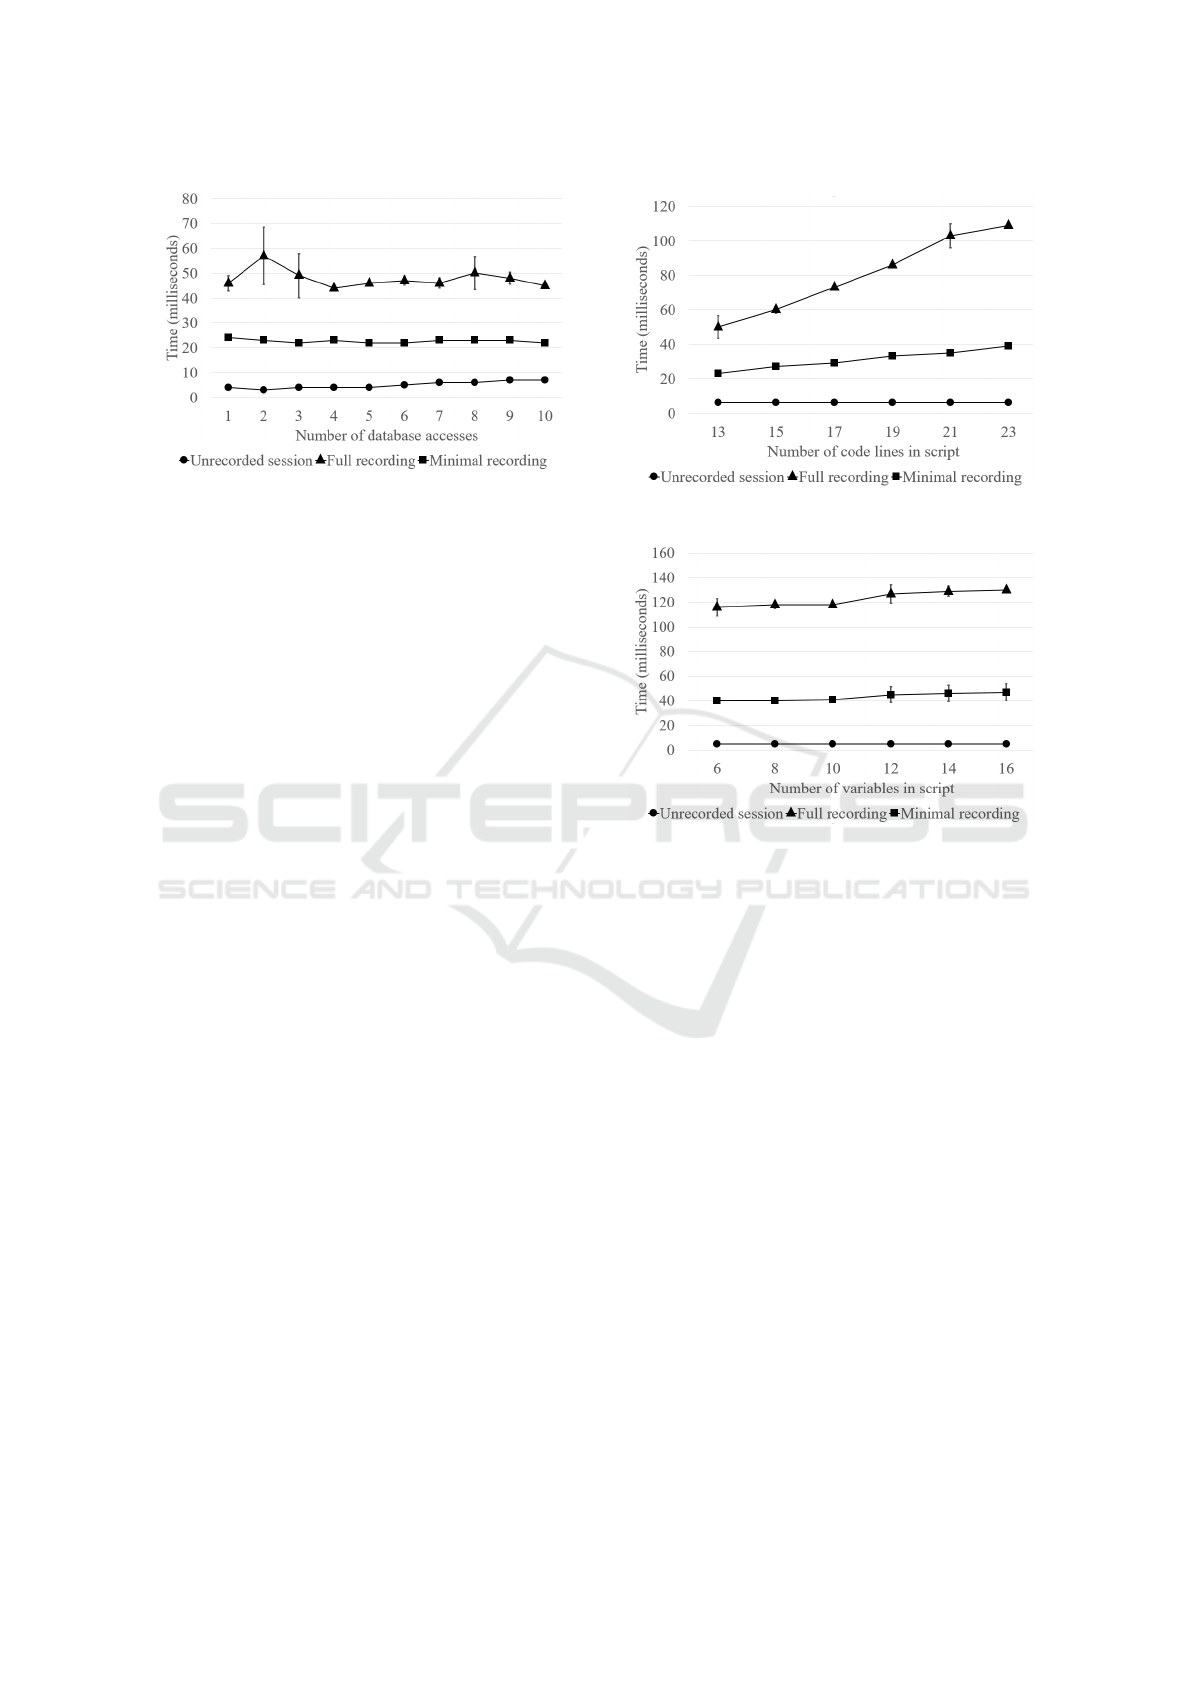
Figure 4: Execution time with respect to varying m
1
.
Zang et al. separated the slicing operation to of-
fline and online slicing to make the slicing operation
faster (Zhang et al., 2012). In their study two slices
has been obtained, one forward from root cause and
one backward from the bug site, defining the scope to
validate a fix. Time consuming operations, like static
analysis, are done in the offline part of the system and
the results are stored in the database and afterwards
loaded into the memory when necessary.
In our method we record the erroneous executions
so the developer can use the recording data later to
test the scripts without the limitation of waiting the
permission from the user to start the remote debug-
ging.
Another work by James Mickens uses JavaScript’s
built-in reflection capabilities to provide a debugging
environment that can work remotely (Mickens, 2012).
If the user does not want to allow the developer to de-
bug remotely then the debug server sends test scripts
to the client. The client executes the scripts and send
the result to the server to get reports about the error.
There also exists a vast amount of work on us-
ing historical execution information and execution
traces to debug a program (Engblom, 2012)(Pothier
and Tanter, 2009) but to the best of authors’ knowl-
edge the area of using such debuggers in remote de-
bugging is an open area of research.
5 CONCLUSION AND FUTURE
WORK
In this paper we introduced a record/replay debugging
approach that can be used in debugging services de-
veloped on the cloud. We used a cloud based system
where developers can implement services on a remote
server by using web based clients. In our approach,
we also present a minimal recording option where we
record only the variable evaluations affected by web
service calls and/or database operations in order to
Figure 5: Execution time with respect to varying m
2
.
Figure 6: Execution time with respect to varying m
3
.
provide the developer with a debugging session that
contains the original interactions that caused the bug
present in the service being developed. Lightweight
recording sessions produce much more scalable de-
bugging sessions in terms of run-time efficiency.
Our approach can be improved in a variety of dif-
ferent directions. For instance, it is possible to de-
velop a time-traveling debugger allowing debugger
to step backwards as well. In the literature, a simi-
lar time-traveling debugger is implemented by taking
snapshots of the program state at regular intervals and
recording all non-deterministic environmental inter-
actions (Barr and Marron, 2014) (Barr et al., 2016).
The minimal recording approach in our study uses
similar concepts by storing the variable value only
when it is related to system state. Another field to
further improve the minimal recording memory foot-
print is to store delta differences of only the variables
that are related to the error (Hammoudi et al., 2015).
The impact of the proposed approach on programmer
productivity is another possible area of research.
CLOSER 2018 - 8th International Conference on Cloud Computing and Services Science
430

REFERENCES
Barr, E. T. and Marron, M. (2014). Tardis: Affordable time-
travel debugging in managed runtimes. In ACM SIG-
PLAN Notices, volume 49, pages 67–82. ACM.
Barr, E. T., Marron, M., Maurer, E., Moseley, D., and Seth,
G. (2016). Time-travel debugging for javascript/node.
js. In Proceedings of the 2016 24th ACM SIGSOFT
International Symposium on Foundations of Software
Engineering, pages 1003–1007. ACM.
Brock, M. and various contributors. Mvel-mvflex expres-
sion language. https://github.com/mvel/mvel. Online;
accessed 17 January 2018.
Burg, B., Bailey, R., Ko, A. J., and Ernst, M. D. (2013). In-
teractive record/replay for web application debugging.
In Proceedings of the 26th annual ACM symposium on
User interface software and technology, pages 473–
484. ACM.
Chilimbi, T. M., Liblit, B., Mehra, K., Nori, A. V., and
Vaswani, K. (2009). Holmes: Effective statistical de-
bugging via efficient path profiling. In Software En-
gineering, 2009. ICSE 2009. IEEE 31st International
Conference on, pages 34–44. IEEE.
Engblom, J. (2012). A review of reverse debugging. In
System, Software, SoC and Silicon Debug Conference
(S4D), 2012, pages 1–6. IEEE.
Hammoudi, M., Burg, B., Bae, G., and Rothermel, G.
(2015). On the use of delta debugging to reduce
recordings and facilitate debugging of web applica-
tions. In Proceedings of the 2015 10th Joint Meeting
on Foundations of Software Engineering, pages 333–
344. ACM.
Mickens, J. (2012). Rivet: Browser-agnostic remote debug-
ging for web applications. In USENIX Annual Techni-
cal Conference, pages 333–345.
Pothier, G. and Tanter,
´
E. (2009). Back to the future: Om-
niscient debugging. IEEE software, 26(6).
Telerik. Fiddler web debugging.
http://www.telerik.com/fiddler. Online; accessed
17 January 2018.
Troberg, A. et al. (2015). Improving javascript development
productivity by providing runtime information within
the code editor.
Zhang, C., Lu, L., Zhou, H., Zhao, J., and Zhang, Z. (2012).
Moonbox: debugging with online slicing and dryrun.
In Proceedings of the Asia-Pacific Workshop on Sys-
tems, page 12. ACM.
Debugging Remote Services Developed on the Cloud
431
