
A Predictive Comfort- and Energy-aware MPC-driven Approach based
on a Dynamic PMV Subjectification towards Personalization in an
Indoor Climate Control Scenario
Antonios Karatzoglou
1,2
, Julian Janßen
1
, Vethiga Srikanthan
1
, Christof Urbaczek
1
and Michael Beigl
1
1
TECO Research Group, Karlsruhe Institute of Technology (KIT), Karlsruhe, Germany
2
Robert Bosch GmbH, Corporate Sector Research and Advance Engineering, Renningen, Germany
antonios.karatzoglou@de.bosch.com
Keywords:
Smart Buildings, HVAC, Thermal Comfort, PMV, Energy efficiency, Model Predictive Control (MPC),
Personalization.
Abstract:
There exist two ways of improving the climate conditions within a building; upgrading the building insulation
and applying modern heating technology, whereby the combination of both would obviously yield the best
result. Recent heating technologies lay high emphasis on forward-looking behavior in order to be capable of
providing both more comfort and a higher energy efficiency. Some rely on outdoor and indoor temperature
predictive models. Other utilize occupancy prediction. The majority and in particular the ones based on the
Predicted Mean Vote (PMV), employ a PMV-driven fixed single temperature point, range (e.g. 22-24C) or
curve as reference. In this paper, we introduce a hybrid, personalized heating control approach. It combines
a probabilistic occupancy prediction model together with an energy- and subjectified comfort-aware model-
based predictive controller (MPC), which can be tailored dynamically to the users’ preference of comfort.
Starting with a default PMV and a corresponding first temperature set point, our system learns from the users’
interaction with the system’s comfort-driven UI and adapts online the MPC’s target comfort and thereby the
MPC’s optimization function respectively. We conducted a user study in a real office environment and show
that our dynamic customizable approach outperforms significantly the non-dynamic one in respect of both
comfort and energy.
1 INTRODUCTION
According to a study funded by the U.S. Environmen-
tal Protection Agency (EPA), people spend almost
90% of their time indoors (Klepeis et al., 2001). It
is evident that indoor climate conditions are of great
importance, whether at home, at work or in other pla-
ces. The term Indoor Environmental Quality (IEQ) is
used to describe how far certain factors, such as air
quality, visual comfort (lighting conditions), acoustic
comfort (ambient noise) and thermal comfort, among
others, affect occupants and especially their physical
and mental health (Taylor, 2010). People are heal-
thier, more focussed and more productive in buildings
with a high IEQ. Modern, intelligent Heating, Venti-
lation and Air Conditioning (HVAC) solutions play a
central role in promoting and maintaining the IEQ and
are therefore a necessity today. This becomes more
apparent if we take the rising temperatures on the one
hand and the decreasing air quality in urban centers
on the other hand additionally into account.
Among all IEQ factors, thermal comfort repre-
sents one of the more influential and thus important
ones. This justifies the high interest and the growing
research and development efforts in this field. In or-
der to achieve high comfort values, while keeping a
low energy profile, the vast majority of the approa-
ches work towards a model predictive control met-
hodology. Some others incorporate occupancy pre-
diction models. However, most of them adopt a fixed
temperature set point or range strategy aiming at sa-
tisfying the needs of the average occupant. This le-
ads to impersonal solutions, which lie below the opti-
mum.
In this work, we present a hybrid heating control
system based on a dynamically adjustable model pre-
dictive controlling (MPC) unit. The users are able to
tailor our controller to their needs in real time by gi-
ving feedback on their thermal discomfort. Moreover,
our respective User Interface features a degree of fuz-
Karatzoglou, A., Janßen, J., Srikanthan, V., Urbaczek, C. and Beigl, M.
A Predictive Comfort- and Energy-aware MPC-driven Approach based on a Dynamic PMV Subjectification towards Personalization in an Indoor Climate Control Scenario.
DOI: 10.5220/0006702500890100
In Proceedings of the 7th International Conference on Smart Cities and Green ICT Systems (SMARTGREENS 2018), pages 89-100
ISBN: 978-989-758-292-9
Copyright
c
2019 by SCITEPRESS – Science and Technology Publications, Lda. All rights reserved
89

ziness, that makes the adjustment more natural. In
addition, an occupancy predictive component extends
the MPC unit in order to endow our system with an
additional proactive behavior and further enhance the
overall outcome.
The remainder of this paper is organized as fol-
lows. Section 2 provides an overview of the rela-
ted work in this area. Section 3 gives insight into
the theory behind our framework, followed by section
4, which outlines in detail our control approach. In
section 5, we describe first the user study we carried
out in order to evaluate our approach, and the corre-
sponding experimental setup. Then we present and
discuss the evaluation’s outcomes. Finally, section 6
summarizes our work and provides our final conclu-
sions.
2 RELATED WORK
Comfort, as an experience, represents a subjective
sensation of individual people (Nikolopoulou and
Steemers, 2003). Not everyone shares the same view
about whether a certain experience is comfortable or
not. Furthermore, comfort is highly relative and de-
pends strongly on the current situation. In (Ahmad-
pour, 2017) for instance, Ahmadpour confirms a high
correlation between humans’ concerns, like control,
privacy, accessibility, style, etc., the situation in which
they find themselves, and their general comfort expe-
rience. Lan et al. focus in (Lan et al., 2012) solely on
thermal comfort and investigate how high or low tem-
peratures affect human performance in an office envi-
ronment. They came to the conclusion that deviations
from the thermal comfort optimum produce a clear
negativ impact on the overall performance. Further-
more, they establish a relation between energy saving
system designs and a reduced performance of office
workers. Analyzing the behavior of people in diffe-
rent thermal environments confirms that determining
and setting the optimal thermal comfort is essential.
Amasuomo et al. in (Amasuomo and Amasuomo,
2016) tested the stress behavior of students in lecture
rooms. Their results indicate that discomfort leads
to less concentration, more tiredness and irritation.
A similar project was conducted by Steinmetz et al.
(Steinmetz and Posten, 2017), where he showed that
the response behavior differs in cold and warm envi-
ronments.
In order to determine and describe the thermal
comfort, Fanger defined in the 1970s’ the Predicted
Mean Vote (PMV) (Fanger, 1970). The PMV is a
model, which considers indoor temperature, humidity
and clothing level among others to calculate a thermal
comfort index. Section 3.1 gives a brief insight into
the theory behind the PMV model. However, Mors
et al. proved in practice that the PMV is not perfect.
Particularly, he showed that the PMV was not accu-
rate enough to set the optimal comfort for primary
school children (Mors et al., 2011). Yao et al. (Yao
et al., 2009) created the adaptive PMV (aPMV) that
uses additional seasonal differences to overcome the
PMV’s inaccuracies. The aPMV defines among ot-
hers a much lower optimal indoor temperature in cold
seasons than in hot ones. There are different studies
regarding thermal comfort. Tham et al. (Tham and
Willem, 2010) set up three test rooms, each with a dif-
ferent room temperature (20
◦
C, 23
◦
C, and 26
◦
C). The
study participants stayed in each room for 4 hours.
Sensors on the forehead, lower arm, back, hand and
foot measured the skin temperature. The research
showed that for most people, 23
◦
C reflects the opti-
mal comfort. Barrios et al. (Barrios and Kleimin-
ger, 2017) developed a framework called Comfstat to
predict the users’ comfort in an unsupervised way.
They used body sensors to measure the heart rate of
each person and showed inter alia that it is important
to train the system on each user individually to get
more accurate comfort settings. Beside that, a hea-
ting control system based on Comfstat would rely for
the most part on the heart rate sensing technology that
has to be as accurate as possible. Modern smartwat-
ches and other wearables do provide the feature of
heart rate measurement, but only very few of them,
if any, would be good enough to set a HVAC system
accurately enough.
There exists a great variety of indoor climate con-
trol approaches. Karatzoglou et al. presented in
(Karatzoglou et al., 2017) a climate control approach
based on both a Support Vector Regression (SVR)-
driven occupancy prediction model, as well as a re-
spective rule base, on top of a PID controller. Their
approach was able to enhance the thermal comfort,
while keeping the energy consumption low at the
same time. Shi et al. in (Shi et al., 2017) use an
occupancy prediction model as well to improve their
MPC controller achieving a similar high comfort and
energy efficiency. Vesely et al. (Vesel
`
y and Zeiler,
2014) propose an extension of HVAC systems in order
to be able to control microclimates and promote that
way both personalized air conditioning and energy
performance.
Many researchers apply Model Predictive Cont-
rol (MPC) in their work with promising results. The
work of Martincevic et al. support this decision (Mar-
tin
ˇ
cevi
´
c et al., 2016). They compared a conventional
temperature controller to a MPC-based one. Their in-
vestigation showed that even the simplest variant of
SMARTGREENS 2018 - 7th International Conference on Smart Cities and Green ICT Systems
90

MPC performs better than the conventional control-
ler. Still, the MPC controller and the respective opti-
mization problem have to be set carefully in order to
get optimal values for comfort and energy efficiency.
Castilla et al. present in (Castilla et al., 2011) a
hierarchical predictive strategy based on a high level
nonlinear MPC with an optimization function aiming
at improving both comfort and energy efficiency. A
PID is additionally used as low level fan coil con-
troller. Some years later, in (Castilla et al., 2014),
Castilla et al. present the Practical Nonlinear MPC
(PNMPC), using PID again as a low level controller.
What is special about Castilla et al.s’s work, is that
their cost function is applied directly on the actual
PMV value and not on the inferred temperature. Gar-
nier et al. (Garnier et al., 2014) use an MPC control-
ler to determine among others the optimal time to turn
on and off the system to save energy. An Artificial
Neural Network (ANN) model predicts the optimal
PMV Value to increase the thermal comfort. Zong et
al. (Zong et al., 2017) introduce the Economic MPC
(EMPC). Instead of having hard constraints at each
prediction step, Zong et al. use soft constraints. They
tested their system in a 3-floor apartment in Denmark.
The study showed that the EMPC controller is ef-
fective for buildings with large thermal storage capa-
city. Energy efficiency is closely linked to comfort.
Occupants do not only want to feel comfortable, but
they are also interested in reducing their energy costs.
Deng et al. (Deng et al., 2016) investigates an ap-
proach, in which the current electricity price is taken
additionally into account.
Chen et al. came to an interesting conclusion. In
their work (Chen et al., 2015), they compared two
different MPC systems. One was using the calcula-
ted PMV as thermal comfort feedback, while the ot-
her one was using a direct user feedback. The system
with the user feedback achieved better results regar-
ding thermal comfort and energy efficiency. Thus, the
ability for the occupants to interact with the system
in real-time is essential and has to be considered for
future intelligent designs. Luo et al. confirm these
findings. Their work (Luo et al., 2014) points out
that occupants with control over the system are more
satisfied regarding their thermal sensation in compa-
rison to others with no control. Kim et al. (Kim et al.,
2016) used questionnaires on smart phones to get the
feedback of their study participants. Karatzoglou et
al. followed a similar way by giving the users the op-
portunity to give their feedback via a web application
(Karatzoglou et al., 2017).
3 THEORY
In this section, we give insight into the three most es-
sential topics related to our paper, thermal comfort,
Model Predictive Control (MPC), and Markov mo-
dels.
3.1 Thermal Comfort
In general, comfort describes a satisfying and enjoya-
ble human experience. Thermal Comfort is more spe-
cific and according to the ANSI/ASHRAE Standard
55-2010 it is defined as follows (Ashrae, 2010):
A condition of mind that expresses satisfaction
with the thermal environment and is assessed
by subjective evaluation.
In addition, ASHRAE defines a 7-value comfort in-
dex scale displayed in table 1. Reaching and keeping
Table 1: ASHRAE Comfort Index.
cold cool
slightly
cool
neu-
tral
slightly
warm
warm hot
-3 -2 -1 0 1 2 3
the optimal thermal comfort reflects the major ob-
jective of HVAC
1
systems. There are many factors
that have an effect on thermal comfort, like air tempe-
rature, clothe insulation etc. Accordingly, there exists
a variety of models that capture these factors and try
to describe thermal comfort based upon them. Fanger
introduced in the 1970’s one of the most recognized
models up to now, the Predicted Mean Vote (PMV)
(Fanger, 1970). The PMV model relies on experi-
mental studies on approx. 1300 subjects and takes
6 parameters explicitly into account, namely air tem-
perature, mean radiant temperature, relative humidity,
air speed, metabolic rate, and clothing insulation. It is
described by the following equation:
PMV = (0, 303e
−0,036M
+ 0,028) · [(M −W)− H
−E
c
−C
res
− E
res
]
(1)
M - the metabolic rate, in [W /m
2
]
W - effective mechanical power, in [W /m
2
]
H - sensitive heat losses
E
c
- heat exchange by evaporation on the skin
C
res
- heat exchange by convention in breathing
E
res
- evaporative heat exchange in breathing
with:
H = 3, 96 · 10
−8
f
cl
· [(t
cl
+ 273)
4
− (t
r
+ 273)
4
]
− f
cl
· h
c
· (t
cl
−t
a
)
(2)
1
Heating, Ventilation, and Air Conditioning
A Predictive Comfort- and Energy-aware MPC-driven Approach based on a Dynamic PMV Subjectification towards Personalization in an
Indoor Climate Control Scenario
91

E
c
= 3,05 · 10
−3
· [5733 − 6,99 · (M −W ) − p
a
]
−0,42 · [(M −W ) − 58, 15]
(3)
C
res
= 0,0014 · M · (34 − t
a
) (4)
E
res
= 1,7 · 10
−5
· M · (5867 − p
a
) (5)
I
cl
- the clothing insulation in [m
2
· K/W ],
f
cl
= 1.05 + 0.1I
cl
- the clothing surface area factor,
with I
cl
> 0.5 (due to winter conditions)
t
a
- the air temperature, in [
◦
C],
t
r
- the mean radiant temperature, in [
◦
C],
v
ar
- the relative air velocity, in [m/s],
p
a
= Humidity · 6.1094 · e
(17.625·T
r
oom)/(T
r
oom+243.04)
-
the water vapor partial pressure, in [Pa]
t
cl
- the clothing surface temperature, in [
◦
C]
As can be seen in the above equations, the PMV
model tries to provide an average estimation about the
thermal comfort in a certain room by using values that
can be easily measured. This easiness of use reflects
its greatest advantage. However, it is not capable of
capturing the personal comfort vote of each occupant,
since comfort is subjective as was mentioned before.
The system presented in this work is premised on the
PMV model and in particular on its subjectification,
that is its personalized adaptation, as we will see later
on.
3.2 Model Predictive Control (MPC)
Model Predictive Control (MPC) refers to a class of
control algorithms that leverage a model of the (dyn-
amic) process both in the offline (design), as well as
in the online (operation) phase. The process model
itself can be linear or nonlinear and is usually a result
of system identification. MPC systems use this model
in combination with the sequences of past input (or
’control’) [u
k−1
,u
k−2
,...], output [y
k−1
,u
k−2
,...] and
noise [z
k−1
,uk − 2,...] signal values, as well as a gi-
ven future reference set point sequence [r
k+1
,r
k+2
,...]
to predict the future open-loop system’s output within
a finite prediction horizon n
p
. A finite sequence of
future input (control) values [u
k+1
,u
k+2
,...,u
k+n
c
] is
then estimated by solving an optimization problem
described through a cost function, which takes both
the future system’s output-set point deviation ~r −~y,
and the input variable’s rate of change into considera-
tion. Modern MPC solutions work on the basis of the
so called Receding Horizon, where only the first ele-
ment of the calculated input sequence is used by the
system. The rest is being discarded. This optimiza-
tion process is repeated at every time step during the
operation phase resulting to the system’s gliding hori-
zon behavior. Equation (6) describes a typical linear,
discrete and time-invariant state space process model.
x
k+1
= Ax
k
+ Bu
k
y
k
= Cx
k
+ Du
k
(6)
where x ∈ R
n
is the state vector, A ∈ R
n×n
the system
matrix, u ∈ R
p
and B ∈ R
n×p
the input vector and
matrix respectively, y ∈ R
q
and C ∈ R
q×n
the output
vector and matrix analogously, and finally D ∈ R
q×p
represents the feedforward matrix.
The MPC cost function, that is the optimization
problem, can be formulated as in equation (7).
J =
n
p
∑
k=1
w
y
k
(y
k
− r)
2
+ w
u
k
(∆u
k
)
2
(7)
where w
y
k
and w
u
k
represent weighting coefficients
that help adapting the outcome to our needs. Finally, a
set of boundary conditions is usually defined to com-
plement the optimization function. It is expressed
through a set of inequations shown in equation (8).
u
min
≤ u
k
≤ u
max
, k ∈ 1, ...,n
c
y
min
≤ y
k
≤ y
max
, k ∈ 1, ...,n
p
x
min
≤ x
k
≤ x
max
, k ∈ 1, ...,n
p
(8)
In section 4 we will proceed with the adaptation
of MPC to our use case, the heating control.
3.3 Markov Model (MM)
A Markov model (MM) or Markov Chain represents a
certain type of a stochastic process. The term stochas-
tic process refers to an ordered collection of one or
more random variables and is used usually to describe
dynamic processes that change over time at random.
Markov Chains define memoryless stochastic proces-
ses that satisfy additionally the Markov property, ac-
cording to which, predictions for the future based on
a short history yields similar results to those based
on the whole history. Markov Chains are categorized
by their order depending on how far back history is
taken into account. A 1st-order Markov Chain is de-
fined by the following conditional (Markov) property
(Bishop, 2006):
p(z
(m+1)
|z
(1)
,z
(2)
,...,z
(m)
) = p(z
(m+1)
|z
(m)
) (9)
whereby z
(1)
, z
(2)
, ... is a series of random variables.
Thus, the prediction relies in this case solely on the
current state and is independent from the former ones.
A 2nd-order Markov Chain would analogously consi-
der both the current, as well as the previous state, etc.
Higher order Markov Chains tend therefore to cluster
the considered previous states together. In this paper,
we use Markov Chains to model and predict the occu-
pants’ room attendance, as we will see in more detail
in the following section.
SMARTGREENS 2018 - 7th International Conference on Smart Cities and Green ICT Systems
92
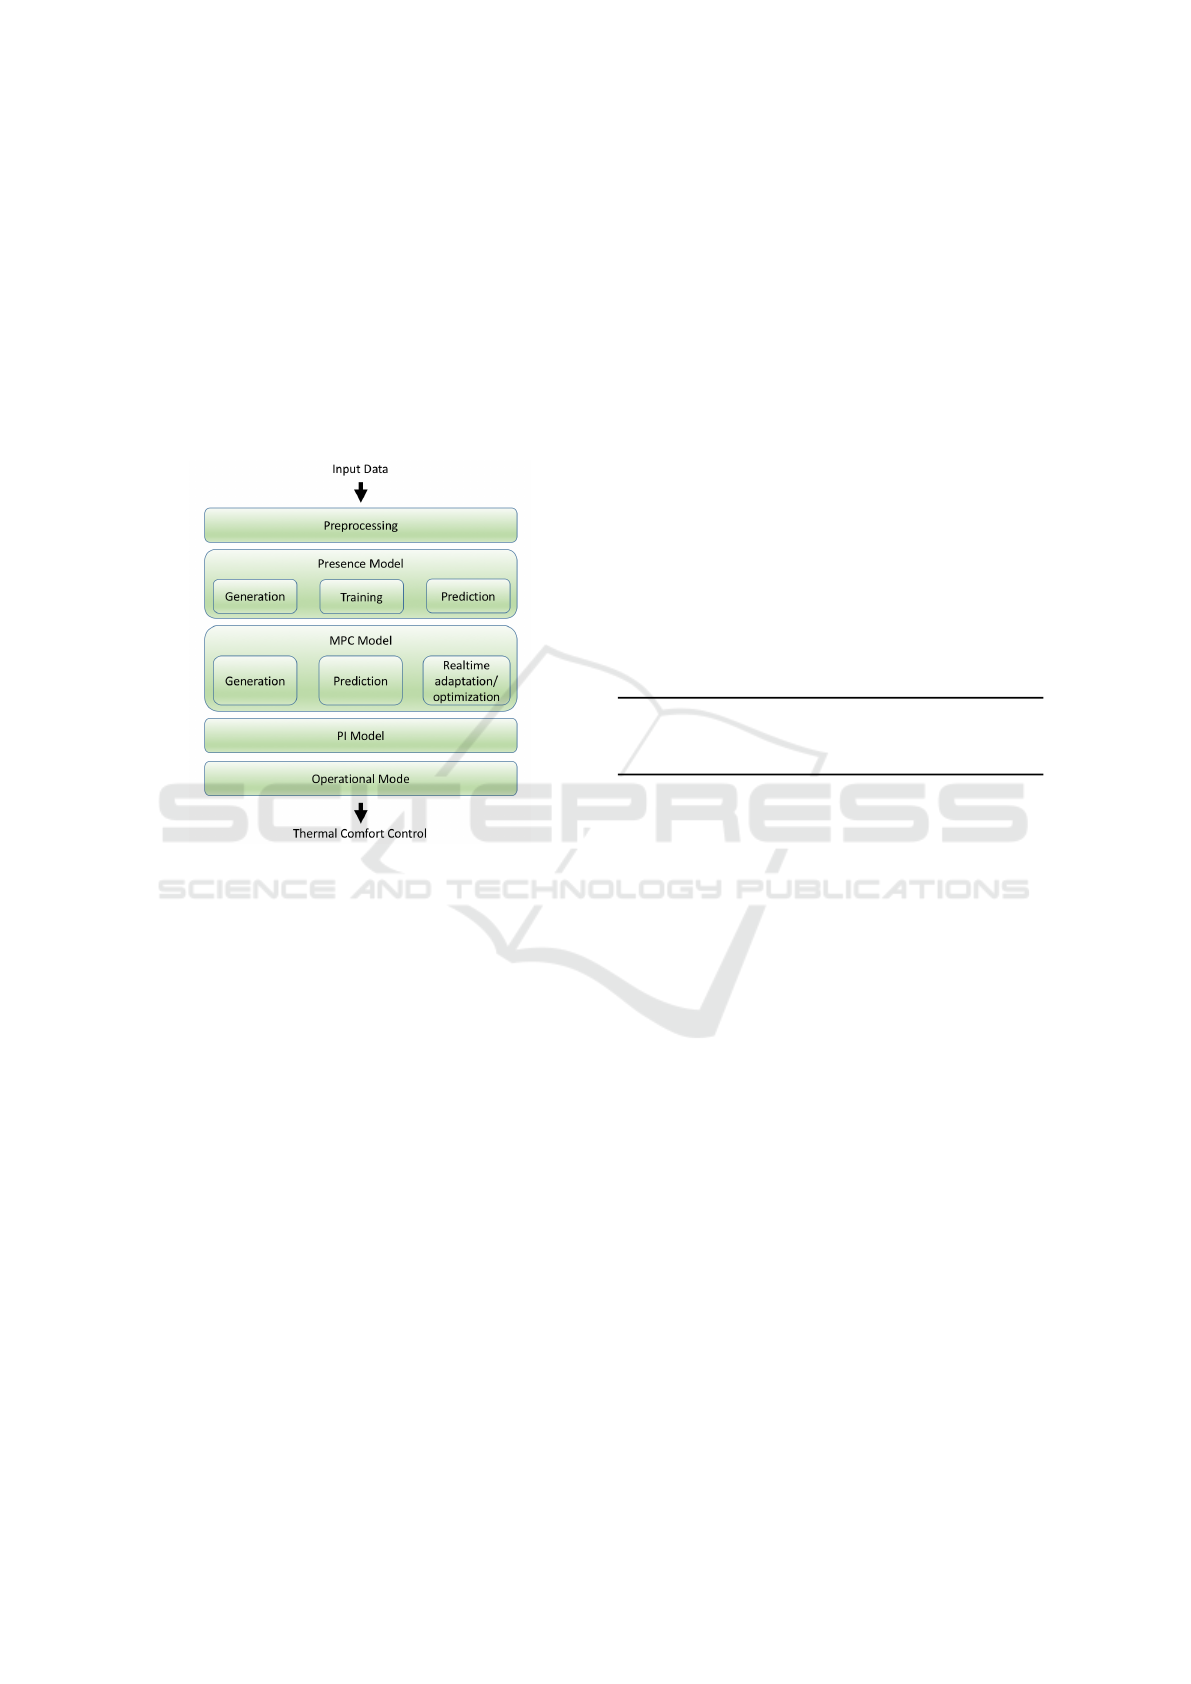
4 OUR APPROACH
Our framework presented in this paper is characteri-
zed by a hybrid 3-model architecture. It combines a
machine learning (ML) based room occupancy pre-
dictive model together with a dynamic PMV-driven
Model Predictive Control (MPC) and a PI controller
as a low-level actuator. Fig. 1 shows the correspon-
ding layer diagram. Our goal is to achieve an indi-
vidual optimal thermal comfort while keeping a low
energy profile at the same time.
Figure 1: Layer Diagram of our framework.
In comparison to other systems that build upon a
fixed temperature set point or zone, our approach re-
lies on a variable PMV comfort index. It provides the
capability of real-time individualization of the target
PMV index through interaction with the user. In ot-
her words, the user can at every time tailor his own
personal optimal PMV index according to his prefe-
rences and wishes. The system leverages this infor-
mation and updates, that is it shifts the MPC’s target
PMV curve accordingly. At the very beginning, our
systems starts with a default mapping between the op-
timal PMV = 0 and the corresponding optimal room
temperature according to Fanger’s field study results.
We selected the default optimal temperature set point
T
room
opt,de f
to be 23.5
◦
C due to the fact that our study
took place in the late winter where the outdoor tempe-
ratures were not that extreme. Fanger’s field study re-
sults indicate a temperature around 25
◦
C for the cool-
ing and 22
◦
C for the heating season to be optimal.
So, a value in-between represents a reasonable choice
for our case. In the operating phase, the user can ex-
press his discomfort via an interface, which is des-
cribed in detail in section 5.2. Every user interaction
is utilized by our approach for subjectifying, that is
customizing the PMV curve for that particular user.
This is done, in which it shifts the curve according to
the user’s (dis)comfort feedback and the correspon-
ding current room temperature. So, for instance if the
default optimal temperature of 23.5
◦
C is too warm for
a certain user, his feedback would respectively be let
us say cVote = +1 of the ASHRAE scale. The system
corresponds to this deviation formulated in equation
(10):
∆
PMV
= PMV
room
opt,de f
− cVote = 0 − (+1) = −1
(10)
by updating the optimal temperature and conse-
quently the PMV − Temperature mapping for that
particular user. The updating step size varies depen-
ding on the comfort feedback of the user as shown
in table 2. For instance a thermal comfort vote of
−1.5 elicits an optimal temperature rise of +0.6
◦
C.
We selected an exponential course for the updating
Table 2: Comfort vote driven temperature updating steps
uStep (in ASHRAE and
◦
C).
cVote [−3,−2) [−2, −1) [−1,0) 0 (0, 1] (1,2] (2,3]
uS-
tep
+1.2 +0.6 +0.2 0 −0.2 −0.6 −1.2
steps (uSteps) in order for our system to feature both
rapid response, as well as smoothness and stability.
Our Graphical User Interface (GUI) maps the discom-
fort of the user to a continuous range between −3
and +3. Partitioning this value range in chunks as
seen in the table 2 instead of using discrete values,
awards our system with a certain degree of fuzziness,
which in turns leads to a better user experience. We
tested all in all two different types of partitioning.
The one illustrated in the above table and the follo-
wing: [−3.0,−2.5],(−2.5, −1.5],...,[2.5,3.0] which
yielded slightly poorer results. Equation (11) descri-
bes the updating process.
T
room
opt,sub j
(t + 1) = T
room
opt,sub j
(t) + uStep (11)
with
T
room
opt,sub j
(0) = T
room
opt,de f
(12)
In equation (13) we can see our MPC component op-
timization function.
J = J
Com f ort
+ J
Energy
= w
C
(PMV − PMV
Target
)
2
+w
E
(T
heat
− T
room
)
2
(13)
with T
heat
≤ 65
◦
C the temperature on the radiator and
T
room
≥ 18
◦
C the room temperature. w
C
and w
E
are
the weighting factors for comfort and energy respecti-
vely.
A Predictive Comfort- and Energy-aware MPC-driven Approach based on a Dynamic PMV Subjectification towards Personalization in an
Indoor Climate Control Scenario
93

Due to the nonlinear nature of PMV (see formula
(1)), we reduced the problem down to having the
room temperature T
room
o
pt,sub j
as a reference value in
our cost function as shown in equation (14). In tangi-
ble terms, we converted the MPC’s nonlinear PMV
target sequence into a linear temperature target se-
quence.The particular approximation can be justified
partly by the fact that indoor temperature represents
the most significant factor in the PMV equation, and
partly by the fact that most of the rest of the parame-
ters, such as clothing level and air speed can in our
case considered to be constant (see section 5.1). The
dynamically, by the user updated T
room
opt,sub j
, is deter-
mined by the ∆
PMV
, as mentioned above, and adapts
the future set point trajectory in real-time. Moreover,
the updating rate is implicitly taken into consideration
by the MPC.
J = J
Com f ort
+ J
Energy
= w
C
(T
room
− T
room
opt,sub j
)
2
+w
E
(T
heat
− T
room
)
2
(14)
In this work, we decided to lend more weight to the
comfort and we defined therefore a comfort-related
weighting coefficient of w
C
= 100 and the one for the
energy to be w
E
= 1. Our 100/1 ratio choice is based
on the one hand, on our previous work (Karatzoglou
et al., 2017), and on the other hand, on some first ob-
servations during a short preliminary user study car-
ried out shortly before the major study. Generally,
indoor spaces exhibit inert temperature profiles and
lack the necessity of fast actions. Therefore, we set
our MPC component to perform a prediction every
20min with a prediction horizon of 10h. However,
the MPC component is active only when the room is
currently occupied or estimated to be occupied soon.
In Fig. 2 we can see a detailed flow diagram of our
approach. The prediction component is based on a
Markov model, like the one described in section 3.3.
Our Markov model is of 1st order and uses both day of
week and time of day in the form of 24 one-hour slots
as additional training features. It predicts the presence
or absence of a room every 5 minutes. In order to de-
rive presence or absence from the raw motion detector
data, we used a 5 and 15 minutes long detection win-
dow respectively. The respective lengths help in filte-
ring out short presence or absence situations, such as
short toilet visits.
Finally, a PI controller with k
p
= 0.25 and k
i
=
0.125 following the MPC controller was used for the
actual temperature setting.
Figure 2: Flow Diagram of our framework.
5 EVALUATION
In order to evaluate our system in practice, we desig-
ned and carried out a 12 weeks long field experiment
in an office building scenario. In particular, scope of
our study was to test our heating control concept and
compare it with a MPC control that uses a conventi-
onal, fixed PMV-based temperature set point for all
occupants and lacks an occupancy prediction com-
ponent. The reference MPC system was configured
with the same parameters (length of prediction hori-
zon, cost function weights, etc.) as our own MPC
approach described in section 4. First, we collected
6 weeks of room occupancy data to train our Markov
Model based attendance predictor. The user study it-
self took place afterwards and lasted 6 weeks, whe-
reby we used the first two weeks for testing our in-
frastructure, while collecting sensor data at the same
time. We used the remaining 4 weeks to test the per-
formance of our approach in comparison to a refe-
rence systems: 2 weeks for each. We tested both con-
trollers in 6 different rooms of an office environment.
Each office room used in our experiment contained
one to three people. All in all, we had 11 persons
participating our study.
During the study, the participants were asked on a
regular basis (hourly) to fill out a short survey via a
smartphone application. The questions asked in the
surveys aimed mainly at getting feedback from the
users about their thermal sense of well being. These
were used to derive the corresponding thermal com-
fort index (see section 3.1). An extra group of questi-
ons focusing on gaining a comprehensive view of the
state of the user, such as her current activity and level
SMARTGREENS 2018 - 7th International Conference on Smart Cities and Green ICT Systems
94

Figure 3: Login screen, UI screen (virtual thermostat), sur-
vey screen, and activity survey screen (from the left to the
right).
Figure 4: Sensor and HW deployment.
of workload experienced at that time, complemented
the questionnaires. This can be shown in Fig. 3. In
section 5.3.3 we discuss briefly some correlation out-
comes between the users’ activity and their thermal
comfort.
The windows were kept closed and the window
blinds at a constant level in order to maintain the same
conditions during our experiment. Besides, the parti-
cipants were asked not to change their daily clothing
level (e.g. taking off their jacket, ...) in order to pre-
vent related false study results. The radiators in the
office environment used for our study are connected
with exposed (outside the walls) heating pipes to each
other. So, when a person turns on one of the radia-
tors, the heating pipe in all previous rooms are getting
hot too, which in turn has an effect on their tempera-
ture. To avoid such uncontrolled influences of follo-
wing radiators we used an 22mm polyethylene pipe
insulation with a thickness of 9mm to cover all expo-
sed pipes within the test rooms. After that, heating
tests showed no demonstrable influence of the water
flow initiated by other radiators in the heating system.
5.1 Experimental Setup - Deployment
In this section, we discuss the deployed hardware in-
frastructure of our experiment. Fig. 4 gives an over-
view of a typical sensor and HW installation in one of
the office rooms. The rest of the rooms are of similar
size and architecture.
Each room was equipped with sensors to mea-
sure the prevailing environmental conditions. An
HDC1080 temperature and humidity sensor was
mounted indoors in every room, near to the partici-
pants and close to their working desk. We installed
the same sensor outside the building on the same floor
in an appropriate weather resistant shell to get the out-
door temperature and humidity values. Apart from
that, we used it also in the corridor to infer eventual
temperature gaps between the offices and the corridor.
On the other hand, a DS1820 temperature sensor was
fixed with insulation tape in the middle of the radia-
tor front to measure directly its temperature. In order
to control the hot water flow in each of the rooms,
we mounted a wireless FHT8V valve operating me-
chanism on the radiators. The door state was monito-
red by a magnet switch and one to two motion detec-
tors, depending on the size of the room, were mounted
on the ceiling above the users. In addition, we used
RGB-sensors to keep watch over the light conditions.
A User Interface (UI) is needed in our approach
for customizing the MPC’s comfort-related set point
in real-time, as described in section 4, as well as to
survey the users’ feedback about their thermal com-
fort. For this purpose, we deployed a smartphone
with an app running on it, designed by us (see section
5.2), at every workspace serving as a user interface.
At the same time, we used the smartphones’ sensors
to measure the brightness and the ambient sound le-
vel near the user. We used clams to fix permanently
the smartphones at the monitors in sight of the users
as shown on the right of Fig. 5, so that they could
send their comfort feedback in the most comfortable
way. Moreover, with the smartphone at sight we were
able to remind our participants to fill-out the survey
by blinking smoothly the screen instead of annoying
them with ringtones or other alerting functions. Fig.
5 shows a sample of pictures of the deployed sensors
and the UI.
All sensor data were collected locally by a Rasp-
berry Pi
2
board that served as a measurement server
and forwarded the data to the central server for furt-
her processing. For this purpose, each sensor had to
be connected through an appropriately designed prior
circuit to the boards.
A Raspberry Pi equipped with a 868MHz dongle
was setup outside the test rooms and functioned as a
central valve control server controlling the mounted
valve operating mechanisms mentioned above. The
respective data transmission was realized with the
2
https://www.raspberrypi.org/
A Predictive Comfort- and Energy-aware MPC-driven Approach based on a Dynamic PMV Subjectification towards Personalization in an
Indoor Climate Control Scenario
95
Figure 5: Sensors and UI. Outdoor temperature, motion detection, door, RGB, radiator temperature sensor, Raspberry Pi, and
UI (from the left to the right).
help of the FHEM
3
framework and protocol which
allows to register and control the FHT8Vs.
5.2 SW Infrastructure and User
Interface
Our system uses a server based architecture and con-
sists of three major components: a valve control ser-
ver, a central data server and a sensor layout deployed
in every room. In this section, we explain in detail our
SW architecture. Fig. 6 gives an overview of the de-
ployment and illustrates the participating components
and their connections.
Figure 6: Deployment diagram of our framework.
We encapsulated the valve setting functionality by
a HTTP valve control server with an appropriately de-
fined interface to allow the server to control the valves
of every test room over the local network. The inter-
face was written in Python and we used the Tornado
Web Server
4
for providing the HTTP commands to
set and get the valve state.
The central server system processes can be divi-
ded into three categories: data storage, system mo-
nitoring and controlling. Each service on the server
communicates over the local network via the HTTP-
protocol. The data storage component consists of two
databases. On the one hand, a special time series da-
tabase (TSDB) is used to store the sensor values and
the controller loggings. We have chosen the open so-
lution influxdata
5
for this purpose. All comfort feed-
3
https://fhem.de/
4
http://www.tornadoweb.org/
5
https://www.influxdata.com/
backs made by the users during the study are also log-
ged in the time series database. On the other hand,
a MySQL
6
Database was used to store the complete
surveys of the users. Like in the valve control ser-
ver, all database transactions were handled by a HTTP
server to encapsulate the database access. The same
interface can be used to link other database systems
as well. To identify sensor and HW malfunctions
and check if everything works fine, the system was
continuously monitored with the help of Kapacitor,
a component of influxdata. Kapacitor allows sending
automatic messages if predefined conditions do not
match for a specific period. Additionally, we used
influxdata’s visualization tool Chronograph to check
the measured data.
An Android application was written to allow users
to inform the central control server about their cur-
rent comfort state and interact with our controller (vir-
tual thermostat). The android application has two dif-
ferent default views: the survey and the thermostat
view. The survey view shows a set of questions and
is used to perform the interviewing of the users. It
is called regularly every hour. The thermostat view
enables the users to give feedback about their current
thermal comfort on a scale from very hot over neu-
tral to very cold visualized as a gradient line from red
to blue. The swipe button’s position is mapped to a
corresponding ASHRAE comfort index value and is
in turn sent to the central server. Our controller utili-
zes this information to update and readjust the MPC’s
comfort set point sequence and thus influence the cur-
rent room temperature on a personal basis. So, our
approach learns about the optimal thermal comfort of
each user in an interactive manner and uses this kno-
wledge to provide a more personalized solution. After
sending the comfort feedback, the swipe button swit-
ches back to neutral and is ready for the next feed-
back. In conflicting cases, where participants in the
same room, within a short period of time (20 minu-
tes), don’t share the same opinion, our system cal-
culates a weighted average to determine the optimal
target temperature, whereby the last interaction is gi-
ven more weight (60%-40% ratio). But if the second
6
https://www.mysql.com/
SMARTGREENS 2018 - 7th International Conference on Smart Cities and Green ICT Systems
96

Figure 7: Detailed overview of the Flow diagram of our UI.
(conflicting) interaction occurs more than 20 minu-
tes after the first one, then the last one ist the only
one to be considered in our system. The application’s
workflow is described in Fig. 7, where both the Vir-
tual Thermostat, as well as the Survey functionality
can be seen. It should be noted here that the users
were able to operate the virtual thermostat during the
whole experiment. However, in the case of the refe-
rence controller of our evaluation, it has no effect due
to being a standard fixed set point MPC controller.
Beyond that, we use additionally the users’ inte-
raction with the app to document the users’ presence
and activity ground truth. For this purpose, the parti-
cipants were told to check themselves in and out when
they arrived and left their workspace respectively. On
the right of Fig. 3, we can see the set of activities, that
users could choose of.
5.3 Results
We evaluated our dynamic approach in comparison
to a standard invariable PMV-based MPC system 4
weeks long (2 weeks each) against two criteria: com-
fort and energy. The outcomes of our evaluation are
presented in this section.
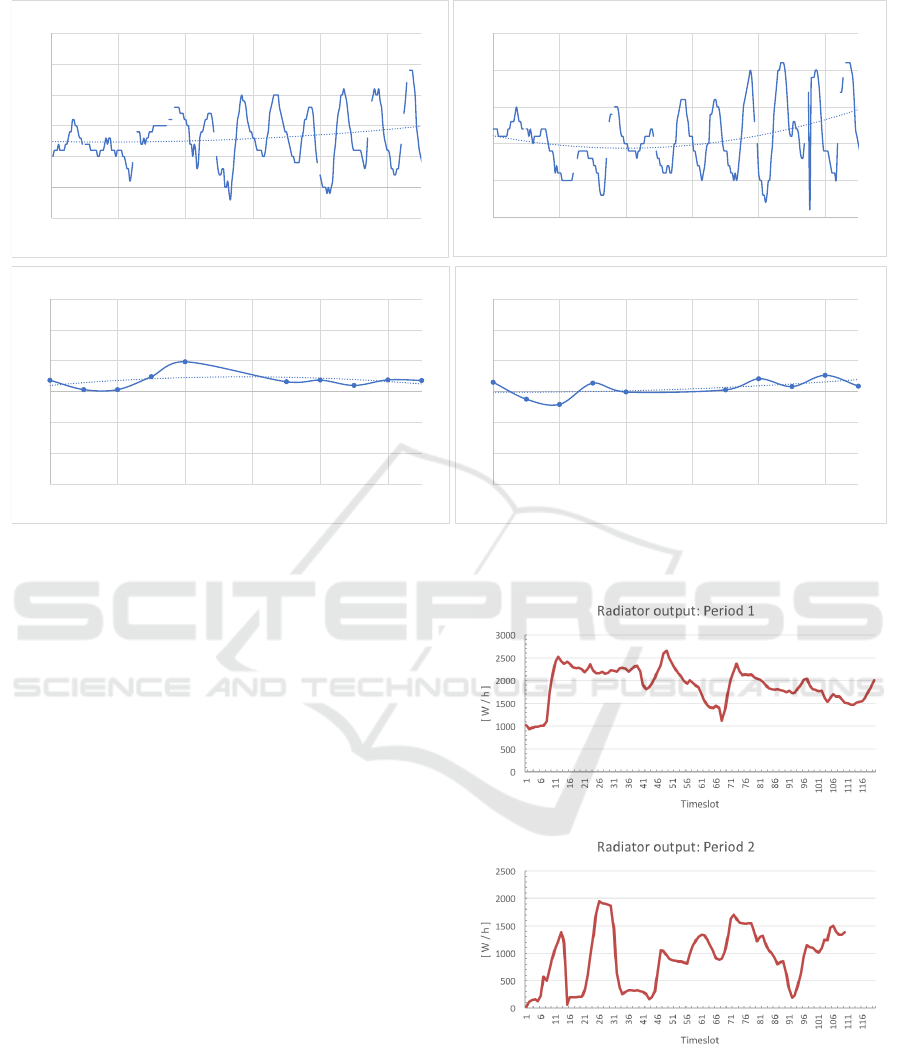
5.3.1 Comfort
Fig. 8 contains the daily average thermal comfort
feedback over all users during our field study. Pe-
riod 1 and 2 (P1 and P2) represent both a 2-weeks
long period and reflect the behavior of the reference
system and our own approach respectively. On the top
of the figure lies the corresponding outdoor tempera-
ture curve. We can see that the temperature remained
in average over both periods almost constant with the
sole exception of the last two days. But all in all there
are no great divergences to see between the outdoor
temperatures in P1 and P2. With that fact in mind, we
can now go on with our evaluation.
What stands out in the figure is that the the com-
fort vote of the users in period P1 is clearly above
Table 3: Thermal comfort average (Avg), variance (Var),
and standard deviation (Std) over two periods (P1: reference
system and P2: our system).
Period/Comfort [ASHRAE] Avg Var Std
P1 0.329 0.392 0.621
P2 0.113 0.352 0.588
0, and thus above the optimum (PMV = 0). In con-
trast, the average of the users felt more comfortable
in period P2, despite the last two warm days. In addi-
tion, the reference controller in period P1 shows both
a greater scattering of comfort values, as well as the
highest average discomfort vote of +1. Both differen-
ces are also highlighted in table 3. Apparently, most
of our study participants felt in general slightly dis-
comfort with the default target temperature of 23,5
◦
C
based on Fanger’s PMV (see section 4. Even in the
extreme situation of the last two extraordinary warm
days during P2, our approach yields a stabilizing ef-
fect on the users’ sense of well being and could again
level off near the optimum.
Furthermore, we measured the number of inte-
ractions between the users and our virtual thermostat.
In period P1, the study participants used the UI 148
times in total (apart from the times they were doing
the survey), compared to only 88 times in P2. This
fact illustrates once more the advantages of a dynamic
and learnable comfort-driven MPC approach. Beyond
that, we should not forget the predictive component
and their role in achieving good results by proacting
instead of just reacting on the users’ comfort vote.
5.3.2 Energy
In order to evaluate both systems regarding their
energy efficient, we applied the following formula
(15):
˙
Q
Op
=
˙
Q
Norm
·
"
t
V,Op
−t
R,Op
ln(
t
V,Op
−t
L,Op
t
R,Op
−t
L,Op
)
75
◦
C−65
◦
C
ln(
75
◦
C−20
◦
C
65
◦
C−20
◦
C
)
#
n
· B ·V (15)
A Predictive Comfort- and Energy-aware MPC-driven Approach based on a Dynamic PMV Subjectification towards Personalization in an
Indoor Climate Control Scenario
97
-5
0
5
10
15
20
25
06.03.2017 08.03.2017 10.03.2017 12.03.2017 14.03.2017 16.03.2017
Temperature
Date
Period 1
0
5
10
15
20
25
20.03.2017 22.03.2017 24.03.2017 26.03.2017 28.03.2017 30.03.2017
Temperature
Date
Period 2
-3
-2
-1
0
1
2
3
06.03.2017 08.03.2017 10.03.2017 12.03.2017 14.03.2017 16.03.2017
Comfort vote
Date
Period 1
-3
-2
-1
0
1
2
3
20.03.2017 22.03.2017 24.03.2017 26.03.2017 28.03.2017 30.03.2017
Comfort vote
Date
Period 2
Figure 8: Daily average comfort feedback over all users within period P1 (reference controller) and P2 (our controller). On
the top lies the corresponding outdoor temperature.
˙
Q
Norm
- the standard heat output (DIN EN 12831),
t
V,op
- the operational flow temperature,
t
R,Op
- the operational return flow temperature,
t
L,Op
- the roomtemperature,
n - the radiator coefficient (in our case for Typ 10),
B - the radiator’s width in [m], and finally
V - the valve setting (0-100%).
Fig. 9 shows the hourly averaged energy consumption
value course over all users within a period of 2 weeks
for each of the controllers (P1 and P2 accordingly). It
is apparent, that in addition to an overall raise of the
users’ thermal comfort, our system outperforms the
conventional reference system in the matter of energy
efficiency as well. The overall energy consumption of
both systems can be found in table 4. In average, our
approach reduced the energy consumption by a total
of 51.59% contributing significantly towards a sustai-
nable future. At the same time, our system produces
far less energy peak values in contrast to the reference
system. A fact that leads additionally to substantial
lower energy supply costs. The low energy profile of
our approach can be attributed on the one hand to the
room occupancy predictive component. On the other
hand, one can easily determine that in general custo-
mizing the target thermal comfort (PMV) to the users’
desires and preferences facilitates further the energy
efficiency. In particular, it can be assumed that most
Figure 9: Energy consumption curves over a 4-week period
in total (P1: reference MPC controller, P2: our approach).
of our user study participants feel slightly discomfort
with the default target temperature of 23,5
◦
C based
on Fanger’s PMV (see section 4. This induced a do-
wnward PMV shifting effect and as a result, a mini-
mization of the overall energy demand.
SMARTGREENS 2018 - 7th International Conference on Smart Cities and Green ICT Systems
98

Table 4: Average energy consumption(Avg), variation (Var),
and standard deviation (Std) of our system (P2) compared to
a reference system (P1).
Period/[W] Avg Var Std
P1 1901.024 151833.2178 388.095
P2 913.158 260852.631 508.411
5.3.3 Activity
As already mentioned previously, during our experi-
ment, we gathered additional context data from the
users, like their current activity. A preliminary analy-
sis we conducted gave some first insights into the in-
terrelation between activity and thermal comfort. We
could observe a slight correlation between users co-
ming back from a break and a comfort vote over the
optimal value 0 reflecting the fact that they felt war-
mer than usual. Beyond that, the data revealed a te-
nuous connection between early morning hours at the
beginning of the day and optimal comfort. This could
be attributed to the simple fact that the users are co-
ming from a cold environment to a warmer and a more
pleasant one. Such kind of information could be used
to further optimize heat control systems. However,
these results are solely indicative and further analysis
is necessary in order to gain a deeper understanding of
how activity and thermal comfort correlate with each
other.
6 CONCLUSION
In this work, we propose a personalized heating con-
trol method on the basis of a dynamically customiza-
ble PMV-driven MPC core. Our systems responds to
the occupants’ feedback on their discomfort by adjus-
ting the MPC’s future sequence of (thermal) comfort
target values. Moreover, we extended the MPC core
by a probabilistic Markov-based occupancy predictor
in order to further promote both the thermal comfort
level, as well as the energy efficiency of our approach.
We evaluated and compared our system to a reference
MPC controller with a fixed comfort set point. We
could show that our method outperforms the reference
controller in both comfort and energy, providing a so-
lid foundation for further investigation.
However, there is still room for improvement. In
the future we plan to improve the autonomy of our
system. That is, we intend to investigate and inte-
grate various methods of inferring the users’ sense of
well-being without having to ask them permanently
for their feedback. For this purpose, we plan to lay
our focus on discomfort recognition algorithms based
on the one hand on context information, such as the
current activity of the occupants and on the other hand
on semantical information, like their calendar entries
and their schedule, among others.
ACKNOWLEDGEMENTS
This work was funded by the German Federal Mi-
nistry of Education and Research within the Soft-
ware Campus KEESmartHome project (grant number
01IS12051).
REFERENCES
Ahmadpour, N. (2017). Comfort experience in everyday
life events. In Advances in Affective and Pleasurable
Design, pages 625–632. Springer.
Amasuomo, T. T. and Amasuomo, J. O. (2016). Perceived
thermal discomfort and stress behaviours affecting
students learning in lecture theatres in the humid tro-
pics. Buildings, 6(2):18.
Ashrae, A. (2010). Standard 55-2010, thermal environmen-
tal conditions for human occupancy. American Society
of Heating, Refrigerating and Air-Conditioning Engi-
neering, Atlanta, GA.
Barrios, L. and Kleiminger, W. (2017). The comfstat-
automatically sensing thermal comfort for smart ther-
mostats. In Pervasive Computing and Communicati-
ons (PerCom), 2017 IEEE International Conference
on, pages 257–266. IEEE.
Bishop, C. M. (2006). Pattern Recognition and Machine
Learning. Springer-Verlag New York, Inc., Secaucus,
NJ, USA.
Castilla, M.,
´
Alvarez, J., Berenguel, M., Rodr
´
ıguez, F.,
Guzm
´
an, J., and P
´
erez, M. (2011). A comparison of
thermal comfort predictive control strategies. Energy
and buildings, 43(10):2737–2746.
Castilla, M.,
´
Alvarez, J., Normey-Rico, J., and Rodr
´
ıguez,
F. (2014). Thermal comfort control using a non-linear
mpc strategy: A real case of study in a bioclimatic
building. Journal of Process Control, 24(6):703–713.
Chen, X., Wang, Q., and Srebric, J. (2015). Model pre-
dictive control for indoor thermal comfort and energy
optimization using occupant feedback. Energy and
Buildings, 102:357–369.
Deng, R., Zhang, Z., Ren, J., and Liang, H. (2016). Ind-
oor temperature control of cost-effective smart buil-
dings via real-time smart grid communications. In
Global Communications Conference (GLOBECOM),
2016 IEEE, pages 1–6. IEEE.
Fanger, P. O. (1970). Thermal comfort. analysis and appli-
cations in environmental engineering. Thermal com-
fort. Analysis and applications in environmental engi-
neering.
A Predictive Comfort- and Energy-aware MPC-driven Approach based on a Dynamic PMV Subjectification towards Personalization in an
Indoor Climate Control Scenario
99

Garnier, A., Eynard, J., Caussanel, M., and Grieu, S. (2014).
Low computational cost technique for predictive ma-
nagement of thermal comfort in non-residential buil-
dings. Journal of Process Control, 24(6):750–762.
Karatzoglou, A., Janssen, J., Srikanthan, V., Ding, Y., and
Beigl, M. (2017). Comfort-effciency-equilibrium: A
proactive, at room level individualized climate control
system for smart buildings.
Kim, J., De Dear, R., Parkinson, T., Candido, C., Cooper,
P., Ma, Z., and Saman, W. (2016). Field study of air
conditioning and thermal comfort in residential buil-
dings.
Klepeis, N. E., nelson, W. C., Ott, W. R., Robinson, J. P.,
Tsang, A. M., Switzer, P., behar, J. V., Hern, S. C.,
and Engelmann, W. H. (2001). The national human
activity pattern survey. a resource for assessing expo-
sure to environmental pollutants. Journal of Exposure
Science and Environmental Epidemiology, 11(3):231–
252.
Lan, L., Wargocki, P., and Lian, Z. (2012). Optimal thermal
environment improves performance of office work.
REHVA European HVAC Journal, 2:12–17.
Luo, M., Cao, B., Zhou, X., Li, M., Zhang, J., Ouyang, Q.,
and Zhu, Y. (2014). Can personal control influence
human thermal comfort? a field study in residential
buildings in china in winter. Energy and Buildings,
72:411–418.
Martin
ˇ
cevi
´
c, A., Va
ˇ
sak, M., and Le
ˇ
si
´
c, V. (2016). Model
predictive control for energy-saving and comfortable
temperature control in buildings. In Control and Auto-
mation (MED), 2016 24th Mediterranean Conference
on, pages 298–303. IEEE.
Mors, S. t., Hensen, J. L., Loomans, M. G., and Boerstra,
A. C. (2011). Adaptive thermal comfort in primary
school classrooms: Creating and validating pmv-
based comfort charts. Building and Environment,
46(12):2454–2461.
Nikolopoulou, M. and Steemers, K. (2003). Thermal com-
fort and psychological adaptation as a guide for desig-
ning urban spaces. Energy and Buildings, 35(1):95–
101.
Shi, J., Yu, N., and Yao, W. (2017). Energy efficient buil-
ding hvac control algorithm with real-time occupancy
prediction. Energy Procedia, 111:267–276.
Steinmetz, J. and Posten, A.-C. (2017). Physical tempera-
ture affects response behavior. Journal of Experimen-
tal Social Psychology, 70:294–300.
Taylor, T. A. (2010). Indoor environmental quality. pages
137–160.
Tham, K. W. and Willem, H. C. (2010). Room air
temperature affects occupants physiology, percepti-
ons and mental alertness. Building and Environment,
45(1):40–44.
Vesel
`
y, M. and Zeiler, W. (2014). Personalized conditio-
ning and its impact on thermal comfort and energy
performance–a review. Renewable and Sustainable
Energy Reviews, 34:401–408.
Yao, R., Li, B., and Liu, J. (2009). A theoretical adaptive
model of thermal comfort–adaptive predicted mean
vote (apmv). Building and environment, 44(10):2089–
2096.
Zong, Y., B
¨
oning, G. M., Santos, R. M., You, S., Hu, J.,
and Han, X. (2017). Challenges of implementing eco-
nomic model predictive control strategy for buildings
interacting with smart energy systems. Applied Ther-
mal Engineering, 114:1476–1486.
SMARTGREENS 2018 - 7th International Conference on Smart Cities and Green ICT Systems
100
