
Measuring the Engagement of the Learner in a Controlled Environment
using Three Different Biosensors
Khaled El-Abbasy
1
, Anastassia Angelopoulou
1
and Tony Towell
2
1
Department of Computer Science, University of Westminster, 115 New Cavendish street, London, U.K.
2
Department of Psychology, University of Westminster, 115 New Cavendish street, London, U.K.
Keywords:
Computer Applications, Education, Elearning, Affective Computing.
Abstract:
Irrespective of the educational model, the major challenge is how to achieve maximum efficiency of the ed-
ucation process and keep learners engaged during learning. This paper investigates the relationship between
emotions and engagement in the E-learning environment, and how recognizing the learners emotions and
changing the content delivery accordingly can affect the efficiency of the E-learning process. The proposed
experiment aims to identify ways to increase the engagement of the learners, hence, enhance the efficiency
of the learning process and the quality of learning. A controlled experiment was conducted to investigate
participants emotions using bio sensors such as eye tracker, EEG, and camera to capture facial images in dif-
ferent emotional states. One-way analysis of variance (ANOVA) test and t-Test was carried out to compare
the performance of the three groups and show if there was an effect of using the affective E-learning system to
improve the learners performance. Our findings support the conclusion that using bio sensors as a quantitative
research tool to investigate human behaviours and measure emotions in real time can significantly enhance the
efficiency of E-learning.
1 INTRODUCTION
The efficiency of education is highly dependent on the
delivery method. Students learn best when they ac-
tively participate in the learning process, when they
are engaged and motivated to learn, and when they
can build on their existing knowledge and understand-
ing (L.Brown et al., 2000).
For all kinds of education: traditional, progres-
sive, e-learning or blended learning, the major chal-
lenge is how to achieve maximum efficiency of the
education process and keep learners engaged during
the learning process. According to Bangert-Drowns
Pyke, truly engaged learners are behaviorally, intel-
lectually, and emotionally involved in their learning
tasks (Bangert-Drowns and Pyke, 2001). In face - to -
face teaching, experienced teachers recognize the en-
gagement level of the students and react accordingly.
They change their teaching method during the class
to grab the students attention. Mixing different teach-
ing methods and strategies in the teaching process en-
gages students and efficiently achieves the set educa-
tional goals. This strategy can be adoptable in the tra-
ditional and progressive education forms, where the
teacher has direct contact with students and can rec-
ognize their engagement level. On the other hand, the
absence of face-to-face communication in e-learning
environment, lowers the interactivity level and, ac-
cordingly, the students engagement, and increases the
need for other alternatives. Recognizing the students
engagement is not straightforward in the e-learning
model, where there is no direct contact between the
instructor and learner. Researchers found that emo-
tions and affect influence a wide diversity of cognitive
processes that affect learning, such as perception, at-
tention, social judgment, cognitive problem-solving,
decision-making, and memory processes (Huntsinger
and Clore, 2007; Lerner and Loewenstein, 2003;
Spackman and Parrott, 2000).
From an educational point of view, emotions can
be classified into positive and negative emotions.
Positive emotions encourage students to engage and
achieve, such as joy (enjoyment of learning), hope
and pride. In this case, Csikszentmihalyis model of
flow can be applied; in which there is a zone where
people can concentrate their attention so intensely on
solving a problem or doing things that they lose track
of time (Csikszentmihalyi, 2008) Such flow is opti-
mal experience that leads to happiness and creativity.
If the task is not challenging enough or too challeng-
278
El-Abbasy, K., Angelopoulou, A. and Towell, T.
Measuring the Engagement of the Learner in a Controlled Environment using Three Different Biosensors.
DOI: 10.5220/0006788202780284
In Proceedings of the 10th International Conference on Computer Supported Education (CSEDU 2018), pages 278-284
ISBN: 978-989-758-291-2
Copyright
c
2019 by SCITEPRESS – Science and Technology Publications, Lda. All rights reserved

ing, negative emotions such as anger, anxiety, shame
or boredom affect the efficiency of learning. These
emotions can highly affect the learning and achieve-
ment of the students. Hence, it is essential for teach-
ers to understand and deal with the students emotions.
(Pekrun, 2012)
Researchers found that emotions and affect influ-
ence a wide diversity of cognitive processes that affect
learning, such as perception, attention, social judg-
ment, cognitive problem-solving, decision-making,
and memory processes (Huntsinger and Clore, 2007)
Emotions can affect students engagement, which
in turn influences their academic learning and
achievement. Engagement can be regarded as a me-
diator between students emotions and their achieve-
ments. According to Pekrun and Linnenbrink Gar-
cia, engagement can be categorized into five types:
Cognitive, motivational, behavioural, cognitive-
behavioural, and social-behavioural (Linnenbrink-
Garcia, 2011)
Studies found that negative emotions such as anx-
iety, shame, boredom, anger, and hopelessness were
connected to task-irrelevant thinking and reduced
flow, while enjoyment related negatively to irrelevant
thinking and positively to flow (Pekrun, 2010)
In this research, an affective e-learning platform
has been designed to read and recognize the learners
emotions in real time during the e-learning process
using a computer and bio-sensors, and use these read-
ing to simulate the traditional learning environment
and change the learning materials when negative emo-
tions detected. A pilot study has been conducted on
participant students to evaluate the effect of the sys-
tem on the performance and achievement of the stu-
dents. The pilot study is a lab experiment, where the
researcher is able to control all factors and conditions
that could have an effect (like determining the precise
timing and configuration of all stimuli and excluding
any problematic side effects). This study aims to ex-
amine the research instruments on a small scale. 15
participants have participated in this pilot study, rep-
resenting 20 percent of the sample size of the main
study (75 subjects), which according to Baker (Baker,
2014) is a reasonable number to conduct a pilot study.
Our finding suggests that using the affective e-
learning platform helped to enhance the performance
of the participant students compared to those who
used a regular e-learning platform.
2 METHODOLOGY
The nature of work for this research is rooted in em-
pirical software engineering using a controlled exper-
iment method to test the hypotheses, create and use
an intervention which is the affective computing sys-
tem. This system, which will recognize the partic-
ipants emotions and control the e-learning materials
delivery, is the independent variable that will be ma-
nipulated to measure its effect on the dependent vari-
able, which will be the participants performance dur-
ing an assessment.
2.1 Research Hypotheses
1. If the students emotions can be recognized by com-
puters during the E-learning process, then the level
of engagement can be detected. Is emotion recogni-
tion during e-learning associated with level of engage-
ment?
2. If the students level of engagement can be de-
tected during the E-learning process, then the learn-
ing process can be enhanced because different teach-
ing strategies can be applied by the E-learning system
to maintain or increase the level of engagement. Can
level of engagement during e-learning be enhanced
by modifying the delivery of materials according to
affective state?
3. Optimizing level of engagement during e-learning
will maximize task performance.
2.2 Participants
15 participants were recruited to this pilot study.
These participants were volunteered from the students
of the computing department in a University. They
were within the 18-25 age group and had self-reported
normal ranges of hearing and vision. They were as-
signed at random to three groups:
Table 1: Participant demographic by group.
Variable Group 1 Group 2 Group 3
Age, years, mean 19.4 22.8 21.4
+/- SE +/- 0.51 +/- 0.58 +/- 0.67
Gender
Male 5 4 4
Female 0 1 1
Learning disability
Yes 0 0 0
No 5 5 1
• Group 1: [The Control Group]: This group
consisted of 5 participants and used the traditional
(face - to - face) education approach.
• Group 2: This group consisted of 5 participants
and used e-learning education approach.
• Group 3: This group consisted of 5 participants
and used affective e-learning approach (figure 1).
Measuring the Engagement of the Learner in a Controlled Environment using Three Different Biosensors
279

Figure 1: A student using the affective e-learning system.
2.3 Procedure
Group 1 was the control condition where no e learn-
ing intervention was used. Group 2 applied e-learning
then compared it to group 1, and finally, group 3 ap-
plied the affective e-learning intervention and com-
pared it to group 2. All participants had to complete a
pre-study questionnaire at the beginning of the exper-
iment to collect information about the user and detect
any learning difficulties that may affect the results of
the experiment. In addition, the participants had to
read a participation information sheet), fill and sign
consent form, and finally a photograph and video re-
lease form. Then, different procedures were used with
the three groups according to the following plan:
Group 1 [The Control Group]. The participants
were asked to attend a traditional (face - to - face)
class for a selected topic conducted by the course in-
structor (for about 40 minutes), then preform a written
assessment related to the selected topic (for about 20
minutes), and finally, answer a short oral post-study
questionnaire (for about 5 minutes).
Group 2. The participants were asked to engage with
e-Learning materials (using a computer) for the same
topic as above, developed by the researcher, with-
out the presence of the instructor (for about 40 min-
utes), then preform a written assessment similar to the
one used with group 1 (for about 20 minutes), and
finally, answer a short oral post-study questionnaire
(for about 5 minutes).
Group 3. The participants were asked to engage with
affective e-learning system (using a computer, biosen-
sors, and learning materials) for the same topic as
above, developed by the researcher, without the pres-
ence of the instructor (for about 40 minutes), then pre-
form a written assessment similar to the one used with
group 1 (for about 20 minutes), and finally, answer a
short oral post-study questionnaire (for about 5 min-
utes).
2.4 Equipment
The following equipment was used by the three
groups:
• Group 1: A white board in a traditional class-
room setting was used to present the materials by
the courses instructor.
• Group 2: Laptop: The main platform (Intel Core
I5, 8GB RAM), which was used to present the e-
learning materials.
• Group 3: This group have used the affective e-
learning system equipment, which consists of:
1. Laptop: The main platform (Intel Core I5, 8GB
RAM), which was used to run the system software
and hardware to create the experiment process, inter-
acting with the user, collecting and analyzing the data.
2. Eye tracker: Screen based eye tracking de-
vice to record eye movements at a distance. The eye
tracker was mounted below the screen and the stu-
dent was seated in front of it. The eye tracker is using
screen based stimulus materials to quantify visual at-
tention.
3. EEG headset: A 14 channel wireless EEG
headset used to record electrical activity generated by
the brain by placing electrodes on the scalp in order
to measure attention and emotional arousal.
4. Web Camera: A web camera attached to the
laptop to capture the students facial expressions and
use a software to recognize his / her emotions in order
to detect attention and emotional arousal.
2.5 Software
The following software was used by the three groups:
• Group 1: No software was needed for this group.
• Group 2: Windows 7 professional, and windows
media player.
• Group 3: iMotions: A biometric research plat-
form used for multimodal human behavior re-
searches (figure 2). This platform provides the
ability to perform real-time, frame-by-frame anal-
ysis of the emotional responses of users, detecting
and tracking expressions of primary. Three mod-
ules are used in this research:
1. Eye Tracking Module: Eye tracking was
used to measure the visual attention, engagement, and
emotional arousal. The following metrics were used
by this module: gaze points, fixation, and pupil size /
dilation.
CSEDU 2018 - 10th International Conference on Computer Supported Education
280

2. EEG Module: EEG was used to measure at-
tention and emotional arousal. The following met-
rics were used by this module: Engagement / bore-
dom, frustration, Excitement long term, and Excite-
ment short term.
3. Facial Expressions Module: Facial expres-
sions was used to read and detect the users positive
and negative emotions in order to detect attention and
emotional arousal. The following metrics were used
by this module: joy, anger, sadness, neutral, positive,
and negative.
Figure 2: The affective e-learning system diagram for pilot
study.
2.6 Control API
An API module is designed to receive the biometric
sensors data, analyze it, and use it to control the e-
learning materials delivery, as shown in figure 3:
• The process starts by connecting and calibrating
the biosensors, then the e-learning materials is
presented to the student on the laptop screen while
the bio sensors is collecting the data.
• The API collects and read the data, and if a change
in the sensors data was detected which may indi-
cate a change in the emotions or attention state,
the API will send a signal to the software to
change the presentation material with the corre-
spondence alternative material.
• The API continuously reads/monitors the data and
provides control signals accordingly until the e-
learning session is completed.
Figure 4 shows the UML interaction overview di-
agram, where the procedure starts, after adjusting and
testing the EEG and facial expression detection sen-
sors, by testing the eye tracking sensor, and move for-
ward if passed to present the first e-learning material
(assumed to be P1 video). Meanwhile, the API keeps
reading and analysing the data provided by the sen-
sors. If positive emotions have detected, the system
will keep playing the P1 material to the end, then pro-
ceed to the next material P2. If at any time a nega-
tive emotions have detected, the API will send a sig-
nal to stop playing P1 and change to the alternative
Figure 3: The API flow chart.
material P1a. The process will continue in the same
pattern through the rest of materials (up to P5 in this
example), and any alternative material will be played
if needed, till the end of the materials.
Figure 4: UML interaction overview diagram for Affective
e-learning system.
3 DATA ANALYSIS
At the end of the experiment, the participants have
conducted an assessment (one time for each partici-
pant) and the resulted data have been collected as an
ordinal variables (test scores from 1 to 10) to be ana-
lyzed.
3.1 One-way ANOVA
As it was needed to determine whether there are any
statistically significant differences between the means
of three groups (with ordinal categorical normally
distributed data), the one-way analysis of variance
(ANOVA) test was carried out to compare the means
of the three groups and show if there is an effect of
using the affective e-learning system of the learners
performance.
Measuring the Engagement of the Learner in a Controlled Environment using Three Different Biosensors
281

Table 2: One way ANOVA test results, 3 groups.
Source df SS MS F* p-value
Factor 2 84.5 42.25
4.18 0.04Error 10 9.5 0.95
Total 12 94
Table 3: Two tailed t-Test results, group 1 and 2.
Source ¯x S
2
t p
Group 1 6.8 2.2
0.56 2.78
Group 2 6.4 0.3
To analyze the data, two hypothesis were made
with a level of significance α =0.05. Equation (1)
shows the null hypothesis H
0
, which means there
is no significant difference in the performance of the
three groups, while equation (2) shows the alternative
hypothesis H
1
, which means there is a significant dif-
ference in the performance of the three groups.
H
0
: ¯x
1
= ¯x
2
= ¯x
3
(1)
where ¯x = mean
H
1
: ¯x
1
6= ¯x
2
6= ¯x
3
(2)
The ANOVA test results (table 2) shows that the crit-
ical F=3.89, while F*=4.18 which is larger than the
critical value, and accordingly, we reject the null hy-
pothesis and accept the alternative hypothesis which
means that there is a significant difference between
the performances in the three groups.
3.2 Two Tailed t-Test
Two tailed t-test statistical test with a level of signif-
icance α=0.1 (for two tailed test α =α/2=0.05) was
used three times to compare the data on the different
groups as following:
3.2.1 Compare Group 1 and 2
Group 1 ( ¯x
1
= 6.8, S
1
2
= 2.2), and group 2 ( ¯x
2
= 6.4,
S
2
2
= 0.3), where ¯x is the mean and S
2
is the variance,
was compared according to two hypothesis. Equation
(3) shows the null hypothesis H
0
, which means there
is no significant difference in the performance of the
two groups, while equation (4) shows the alternative
hypothesis H
1
, which means there is a significant dif-
ference in the performance of the two groups.
H
0
: ¯x
1
= ¯x
2
(3)
H
1
: ¯x
1
6= ¯x
2
(4)
Table 4: Two tailed t-Test results, group 1 and 3.
Source ¯x S
2
t p
Group 1 6.8 2.2
1.8 2.78
Group 3 8.2 0.7
Table 5: Two tailed t-Test results, group 2 and 3.
Source ¯x S
2
t p
Group 2 6.4 0.3
4.02 2.78
Group 3 8.2 0.7
The t-test results (table 3) shows that t=0.56, while
p=2.78 which is larger than t, and accordingly, we ac-
cept the null hypothesis which means that there is no
significant difference between the performances in the
two groups.
3.2.2 Compare Group 1 and 3
Group 1 ( ¯x
1
= 6.8, S
1
2
= 2.2), and group 3 ( ¯x
3
= 8.2,
S
3
2
= 0.5), where ¯x is the mean and S
2
is the variance,
was compared according to two hypothesis. Equation
(5) shows the null hypothesis H
0
, which means there
is no significant difference in the performance of the
two groups, while equation (6) shows the alternative
hypothesis H
1
, which means there is a significant dif-
ference in the performance of the two groups.
H
0
: ¯x
1
= ¯x
3
(5)
H
1
: ¯x
1
6= ¯x
3
(6)
The t-test results (table 4) shows that t=1.8, while
p=2.78 which is larger than t, and accordingly, we ac-
cept the null hypothesis which means that there is no
significant difference between the performances in the
two groups.
3.2.3 Compare Group 2 and 3
Group 1 ( ¯x
2
= 6.4, S
2
2
= 0.3), and group 3 ( ¯x
3
= 8.2,
S
3
2
= 0.5), where ¯x is the mean and S
2
is the variance,
was compared according to two hypothesis. Equation
(7) shows the null hypothesis H
0
, which means there
is no significant difference in the performance of the
two groups, while equation (8) shows the alternative
hypothesis H
1
, which means there is a significant dif-
ference in the performance of the two groups.
H
0
: ¯x
2
= ¯x
3
(7)
H
1
: ¯x
2
6= ¯x
3
(8)
The t-test results (table 5) shows that t=4.02, while
p=2.78 which is less than t, and accordingly, we ac-
cept the alternative hypothesis which means that there
CSEDU 2018 - 10th International Conference on Computer Supported Education
282

is a significant difference between the performances
in the two groups
3.3 Finding Correlation between the
Metrics
Group 3 has examined the affective e-learning sys-
tem by watching the e-learning materials while us-
ing the three biometric sensors (EEG, eye-tracker,
and camera) to recognize their emotions and con-
trol the e-learning materials delivery during the ex-
periment. The API collected in total, the average of
445,812(reading) x 5 (subjects) = 2,229,060 rows of
raw data during the experiment. However, 122,598
(5.5 percent of the 2,229,060 samples) rows of the raw
data were excluded because of they were invalid (mis-
reading of the data by one or more sensors because
of the users action like eye blinking, head movement,
face turned away from camera, etc.). A combina-
tion of different metrics used by the three sensors
was used by the API to control the delivery of the e-
learning materials and decide whether to change the
materials or not according to a predefined threshold
for each metric. Finally, an eye tracker were used dur-
ing the experiment to detect whether the user is look-
ing into the display or not, hence, detect the level of
engagement. Scatter plots and correlation coefficient
r have been used to find a relationship and measure its
strength and direction between the different metrics
used to detect the emotions and level of engagement
of the affective e-learning system user.
Table 6 summarizes the results of the correlation
coefficient r between the facial expressions metrics
and the EEG metric (Where green, blue, and red col-
ors represent strong, moderate, and weak correlation
in order). The table shows the results of the correla-
tion tests between two groups of metrics representing
two biometric sensors. The EEG metric (long term
excitement) has a strong relationship with two facial
expressions metrics (positive & joy), moderate nega-
tive relationship with other two metrics (anger & sad-
ness), and weak or no relationship with the last two
(negative and fear). The second EEG metric (short
term excitement) shows a weak or no relationship
with any of the facial expressions metrics. The third
EEG metric (frustration) has a moderate negative re-
lationship with three facial expressions metrics (pos-
itive, joy, and fear), and the last EEG metric has a
moderate positive relationship with (positive and joy).
This can be a good indicator that the EEG met-
rics can be replaced by a combination of the five re-
lated metrics (positive, joy, anger, fear, and sadness).
The sixth facial expression metric was not correlated
with any EEG metrics and had no significant change
in value when the participants emotion change de-
tected during the experiment, hence, it can be dis-
carded from the metrics list. Also, it was found that
the two metrics (positive and joy) have the exact val-
ues during the experiment, which means we can dis-
card one of them and use the other. Finally, the fear
metric is not appropriate to be used in the learning
and education context. It may be more suitable for
playing horror games for example, therefore it can be
discarded. On the other hand, the EEG metric (short
term excitement) can be discarded as it had no cor-
relation with any of the facial expression metrics and
no significant change in the participants emotion de-
tection.
In conclusion, the correlation tests show that the
EEG metrics (Long term excitement, frustration, and
engagement) can be replaced by a combination of
three facial expressions metrics (positive, anger, and
sadness).
3.4 Pilot Study Interpretation
• The ANOVA data analysis shows that there is a
significant change in the students performance us-
ing three different approaches.
• Using t-Test analysis, shows that there is no dif-
ference when using traditional education and e-
learning. Comparing the traditional education
with the affective e-learning didnt show much
difference as well. However, comparing the e-
learning with the affective e-learning approaches,
shows a significance change in the performance.
This indicates that using affective e-learning may
enhance the efficiency of e-learning which is the
answer for the second research question.
• In the pilot study, the API used two facial expres-
sions metrics to detect the participants emotions
and change the delivery of the affective e-learning
system materials. These metrics were (joy) and
(sadness) (with a threshold of 0.5 for each). Af-
ter the experiment, analyzing the collected data
shows the learning materials have been changed
three times. It is found that each time the materi-
als have changed, there was a significant change
in the value of the EEG metric (Long term excite-
ment), which has dropped by about 33 percent of
its average value. Also, the EEG metric (Frustra-
tion), which has increased by about 17 percent of
its average value. Finally, the EEG metric (En-
gagement), which has increased by about 13 per-
cent of its average value. This can add a value to
the validity of the facial expressions sensor met-
rics.
Measuring the Engagement of the Learner in a Controlled Environment using Three Different Biosensors
283
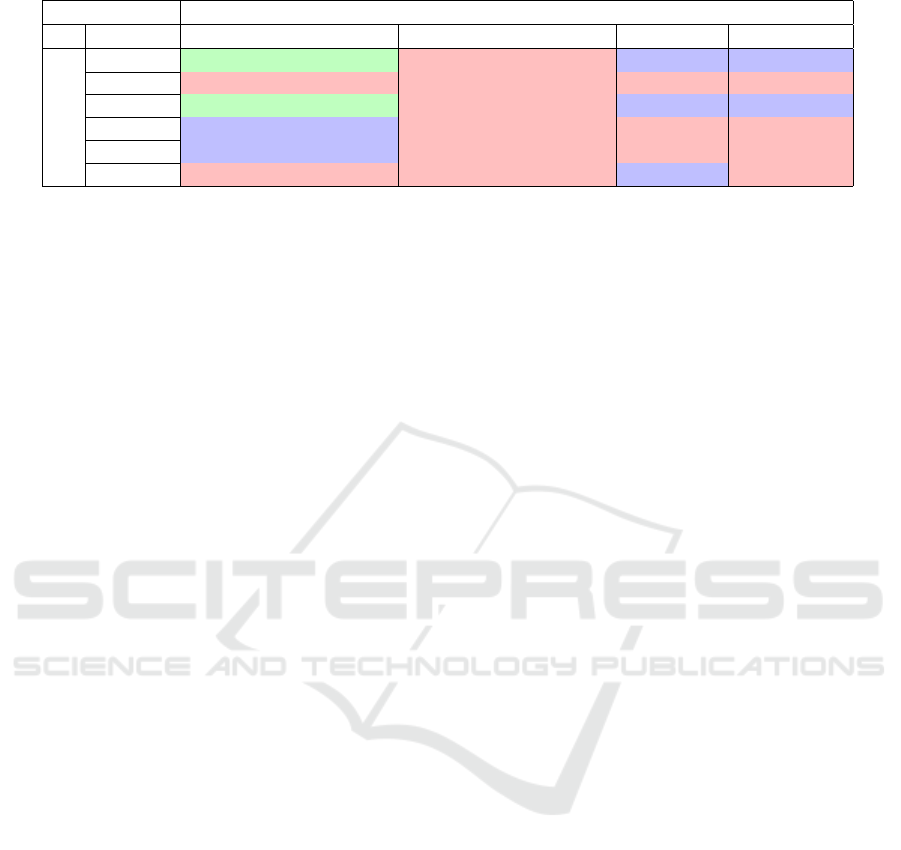
Table 6: Metrics correlation.
Sensors EEG
Metrics Excitement (Long term) Excitement (Short term) Frustration Engagement
Facial Exp.
Positive 0.62 0.17 -0.46 0.44
Negative 0 0.15 -0.1 -0.09
Joy 0.62 0.17 -0.46 0.44
Anger -0.46 -0.08 0.03 0.19
Sadness -0.47 -0.28 0.38 0.38
Fear -0.07 -0.02 -0.48 0.09
• Furthermore, a correlation tests show that the
EEG metrics (long term excitement, frustration,
and engagement) can be replaced by a combina-
tion of three facial expressions metrics (positive,
anger, and sadness), hence, the EEG biometric
sensor can be discarded in further study.
4 CONCLUSION AND FUTURE
WORK
In this research, a small scale pilot study has been
conducted in preparation for a main study. This study
helped to detect some problems which can be avoided
in the main study to give better results:
• Testing was carried out at different times and in
different phases. In the last phase (testing the af-
fective e-learning system), it was hard to find vol-
unteers among students as it was the end of the
academic year period and most of the students had
started their vacation. Accordingly, the selection
options were very limited.
• To record EEG, there is a need to have a good
signal to noise ratio. In other words, all elec-
trodes should be well connected and attached to
the participants scalp to ensure a low resistance.
Any poor connection for any of these electrodes
may affect the quality of the data and require re-
starting the process. It was very difficult to main-
tain low resistance electrode connections within
the time constraints.
The pilot study was very useful in terms of testing
the equipment and the software. However, more work
needs to be done to enhance the results. Few enhance-
ments needs to be done to the API, and better materi-
als needs to be developed. In future, having a bigger
sample of participants will definitely enhance the re-
sults and give a bigger image. Moreover, the pilot
study helped to decide which metrics will be used in
the main study.
REFERENCES
Baker, T. (2014). Doing Social Research. McGraw-Hill Inc,
New York, USA, 3rd edition.
Bangert-Drowns, C. and Pyke, R. L. (2001). A taxonomy
of student engagement with educational software: An
exploration of literate thinking with electronic text.
Journal of Educational Computing Research, pages
213–234.
Csikszentmihalyi, M. (2008). Flow: The Psychology of Op-
timal Experience. Harper Perennial Modern Classics,
New York, USA, 1st edition.
Huntsinger, J. and Clore, G. (2007). How emotions inform
judgment and regulate thought. Trends in Cognitive
Sciences, 11:393–399.
L.Brown, A., D.Bransford, J., and R.Cocking, R. (2000).
How People Learn: Brain, Mind, Experience, and
School. NATIONAL ACADEMY PRESS, Washing-
ton DC, USA, 2nd edition.
Lerner, J. and Loewenstein, G. (2003). The role of affect
in decision making. Oxford University Press, Oxford,
UK.
Linnenbrink-Garcia, L., . P. R. (2011). Students emotions
and academic engagement: Introduction to the special
issue. Contemporary Educational Psychology, 36:1–
3.
Pekrun, R., . L.-G. L. (2012). Academic emotions and stu-
dent engagement. In S. Christenson, A. Reschly, .
C. W., editor, Handbook of research on student, pages
259–282. Springer, New York.
Pekrun, Reinhard; Gtz, T. D. L. M. S. R. H. P. R. P. (2010).
Boredom in achievement settings : exploring control-
value antecedents and performance outcomes of a ne-
glected emotion. ournal of Educational Psychology,
102:531–549.
Spackman, M. and Parrott, W. (2000). Emotion and mem-
ory. Guilford, New York, USA.
CSEDU 2018 - 10th International Conference on Computer Supported Education
284
