
The EEG-based Emotion Classification in Tactile, Olfactory, Acoustic
and Visual Modalities
G. Portnova
1,2
, D. Stebakova
1
and G. Ivanitsky
1
1
Institute of Higher Nervous Activity and Neurophysiology of RAS, 5A Butlerova St., Moscow 117485, Russia
2
Pushkin State Russian Language Institute, Russia
Keywords: EEG, Classification, Acoustic, Visual, Tactile and Olfactory Modalities, Pleasant and Unpleasant Stimuli.
Abstract: We perceive pleasant and unpleasant stimuli using different modality systems, such as visual and acoustic
tactile and olfactory modalities. In our study we investigated the specificity of emotional perception in four
modalities using EEG. 20 healthy participants were instructed to assess the stimuli using emotional scales.
We used power spectrum density, alpha-peak frequency, wavelet analysis and method of "emotional spaces"
for EEG data and DNN classifier for modality specific and non-specific classification of pleasant and
unpleasant stimuli. We found, that difference of EEG power spectrum density and alpha-peak frequency
between states of pleasant and unpleasant stimulation varied from one modality to another. Meanwhile, the
above-stated differences were more similar between tactile and olfactory modalities and acoustic and visual
modalities. the method of "emotional spaces" and DNN classification showed general, modality nonspecific
features of pleasantness evaluation.
1 INTRODUCTION
The perception of emotionally charging stimuli is
possible in variable sensory-specific systems: visual,
auditory, olfactory and tactile, each of them should
be accompanied by the different brain activity (Wu
et al., 2018). Nevertheless, researchers reported, that
the assessment of the "pleasantness" and
"unpleasant" of stimuli should include sensory-non-
specific components (Grabenhorst et al., 2007). The
aim of our study was to detect the modalities’
specific and non-specific features of emotional
perception that could be used for the forehead
classification.
Some researchers previously reported about
similar physiological mechanisms for assessing
emotions in different modalities (Delplanque et al.,
2008). One of these mechanisms could be related
with the activation of the limbic system. The
activation of the limbic system was shown to be
accompanied with theta-rhythm activity (Lévesque
et al., 2017), responsible for emotional perception in
different sensation systems (Diao et al., 2017). Some
authors reported, that the emotional perception of
pleasant and unpleasant stimuli in visual modality
has EEG specific delta- theta- rhythm PSD patterns
(Iosilevich et al., 2012), which was higher for
unpleasant stimulation. Moreover, higher alpha-
rhythm frequency during visual emotional
perception was related with the predisposition to the
prevalence of positive emotions (Tumyalis et al.,
2010). The emotional perception in tactile modality
was also accompanied changes of the theta- and
alpha-rhythm PSD (Monosova, 1994). The pleasant
pleasurable feeling, induced by light pressure that
excites C-tactile fibers, as was shown previously
related with processing of the sensation in limbic
cortical areas (McGlone et al., 2014, McGlown et
al., 2012).
The general mechanisms of emotional perception
originate from asymmetry of pleasant and
unpleasant emotions (Coan and Allen, 2004). The
differential roles of left and right cortex for
processing of pleasant and unpleasant emotional
information was repeatedly reported (Fernandez-
Carriba et al., 2002). Resting EEG measures figure
prominently in this literature. These studies have
established differential roles of left and right
prefrontal cortex (PFC) for processing pleasant and
unpleasant emotional information, respectively. For
example, Loken and co-authors reported that
pleasant tactile stimulation activate left anterior
Portnova, G., Stebakova, D. and Ivanitsky, G.
The EEG-based Emotion Classification in Tactile, Olfactory, Acoustic and Visual Modalities.
DOI: 10.5220/0006892100930099
In Proceedings of the 2nd International Conference on Computer-Human Interaction Research and Applications (CHIRA 2018), pages 93-99
ISBN: 978-989-758-328-5
Copyright © 2018 by SCITEPRESS – Science and Technology Publications, Lda. All rights reserved
93

insula, related with the processing of pleasant
emotions (Loken et al., 2009).
Thus, in our study we attempted to investigate
both sensory specific and non-specific mechanisms
of emotional reception and processing using
innovation method of visualization of EEG patterns
(Roik et al., 2014) and Deep neural network
classifier, which was previously reported as effective
tool to detect the emotional states using EEG data
(Stuhlsatz et al., 2011).
2 METHODS
2.1 Subjects
20 healthy right-handed subjects participated in our
study (9 male, 11 female, 30.2±2.7 years old).
Exclusion criteria were: menstrual cycle phase, use of
oral contraceptives, previous neurological or
psychiatric history, pregnancy, treatment with anti-
depressants and anxiolytics and high levels of anxiety
or hostility during the examination (Spielberger et al.,
1970; Buss and Durkee, 1957). Peers have signed the
informed consent for research document indicating
willingness to participate in the study.
2.2 Stimuli
The experiment consisted of 4 series corresponded
to 4 modalities. The quantity of stimuli varied
depending on modality: 16 pictures from IAPS
(Lang, 2008) (6 pleasant, 6 unpleasant, 4 neutral), 12
sound (4 pleasant, 4 unpleasant, 4 neutral), 10 tactile
stimuli (4 pleasant, 4 unpleasant, 2 neutral), 14 odors
(5 pleasant, 5 unpleasant, 4 neutral). Participants
assessed the pleasantness and arousal of stimuli both
during EEG recording (by choosing bottom for most
pleasant (9), neutral (5) and most unpleasant (1), the
gradient was marked on keyboard (1-9)) and after
the experiment using visual scale. Two stimuli (most
pleasant and unpleasant) were selected for farther
classification. All the stimuli’ presentation was
randomized separately for each modality and repeated
4 times for tactile and olfactory modalities (these
stimuli were presented for 24 seconds) and 40 times
for auditory and visual modalities (presented for 8
seconds). The stimuli were presented using Presenta-
tion Software (Neurobehavioral Systems, USA).
2.3 EEG Registration
During the EEG recording the subjects sat in a
comfortable position in an armchair in an
acoustically and electrically shielded chamber. The
participants were instructed to remain calm and to
hear to the presented sounds (via earphones), watch
the visual stimuli (presented in the monitor), smell
the odors, and percept tactile stimuli avoiding falling
asleep. The auditory olfactory and tactile stimuli
were presented while the subject’s eyes were closed,
to avoid visual interference. EEG was recorded
using a recording device Neurotravel-24D (ATES
Medica, Italy) with 32-channel Electro-Cap (USA).
The amplifier bandpass filter was nominally set to
1.6-30 Hz. The electrooculogram (EOG) was
measured with AgCl cup electrodes placed 1 cm
above and below the left eye, and the horizontal
EOG was measured with electrodes placed 1 cm
lateral from the outer canthi of both eyes. The
recording was separated on two datasets with 30-40
minute interruption.
2.4 Data Processing
EEG intervals corresponding to a specific stimulus
were concatenated. These epochs lasting about 300-
400 seconds were analyzed further. Eyes movement
artifacts were cleaned out using EOG data by
EEGLab. Small intervals affected by muscle activity
were excluded (cut) manually using visual
inspection. All the following processing was
performed using EEGLab (Delorme and Makeig,
2004) plugin for MatLab (Mathwork Inc.). The
“emotional spaces” calculations were implemented
on C# programming language by the lab’s engineer.
2.5 Power Spectral Density
Fast Fourier Transform (FFT) was used to analyze
PSD. The EEG spectrum was estimated for each
310±6.8 seconds long interval. The resulting spectra
were integrated over intervals of unit width in the
range of interest (2-2.5Hz, 2.5-3 Hz … 19.5-20 Hz).
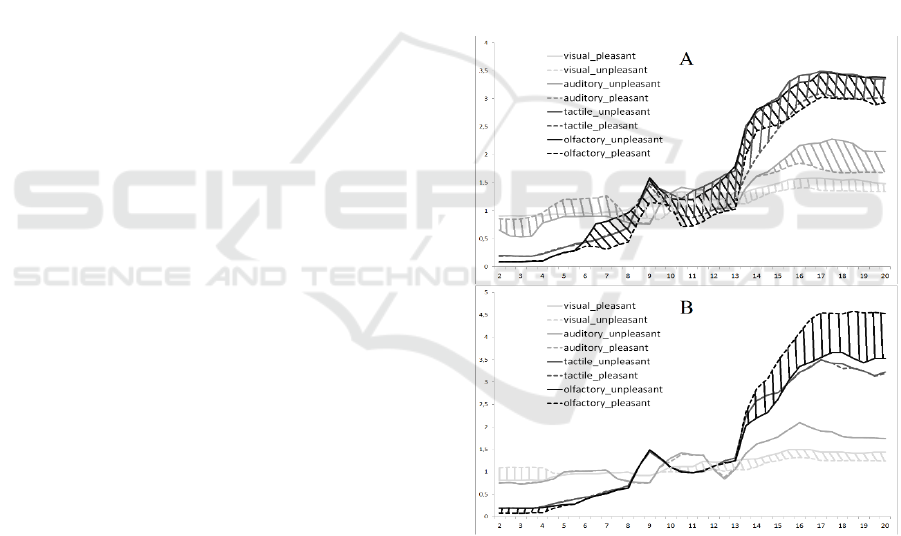
We analyzed asymmetry of differences between
pleasant and unpleasant stimuli over symmetric
channels (F7-F8, F3-F4, FC5-FC6, T3-T4, C3-C4,
CP5-CP6, T5-T6, P3-P4, O1- O2), the results were
presented on figure 2.
2.6 Variability of Rhythm
(Wavelet SD)
We applied mathematical method the Morlet
wavelet (or Gabor wavelet). This is a complex
exponential modulated by a Gaussian function
which depends on a tunable parameter is related to
the time and frequency resolutions (Tallon-Baudry
CHIRA 2018 - 2nd International Conference on Computer-Human Interaction Research and Applications
94

et al, 1996). We calculated the standard deviation for
the intervals of unit width in the range of interest (2-
4Hz, 4-6 Hz, … 18 -20 Hz).
2.7 Peak Alpha Frequency (PAF)
PAF was taken as the frequency from range 8-13 Hz
with maximal PSD.
2.8 Emotional Spaces
We used “cognitive space” construction method
(Roik and Ivanitskii, 2013) to visualize how
close/distant these emotional sound and background
fragments are according to EEG data. As the stimuli
in this study are emotional, the constructed space
will be called “emotional” space. The method
consists of the following steps (figure 1):
1) EEG of each emotional sound and
background fragments was divided into small
non-overlapping epochs of 8 seconds
(approx. 30-40 pieces).
2) FFT (absolute value) was calculated for the
epochs in 2-20 Hz band for electrodes (F3,
F4, F7, F8, FC5, FC6, T3, T4, T5, T6, CP5,
CP6, P3, P4, C3, C4, O1, O2 international
10–20 system)
3) The distance between each pair of emotional
stimuli was calculated: for each frequency
bin two samples of FFT values (of the epochs
of these fragments) were compared using
Mann-Whitney U-test (p < 0.05). The
distance was equal to the percentage of
differing frequency bins.
4) Emotional stimuli were placed onto a plane
using multidimensional scaling method,
namely Sammon projection (Sammon, 1969).
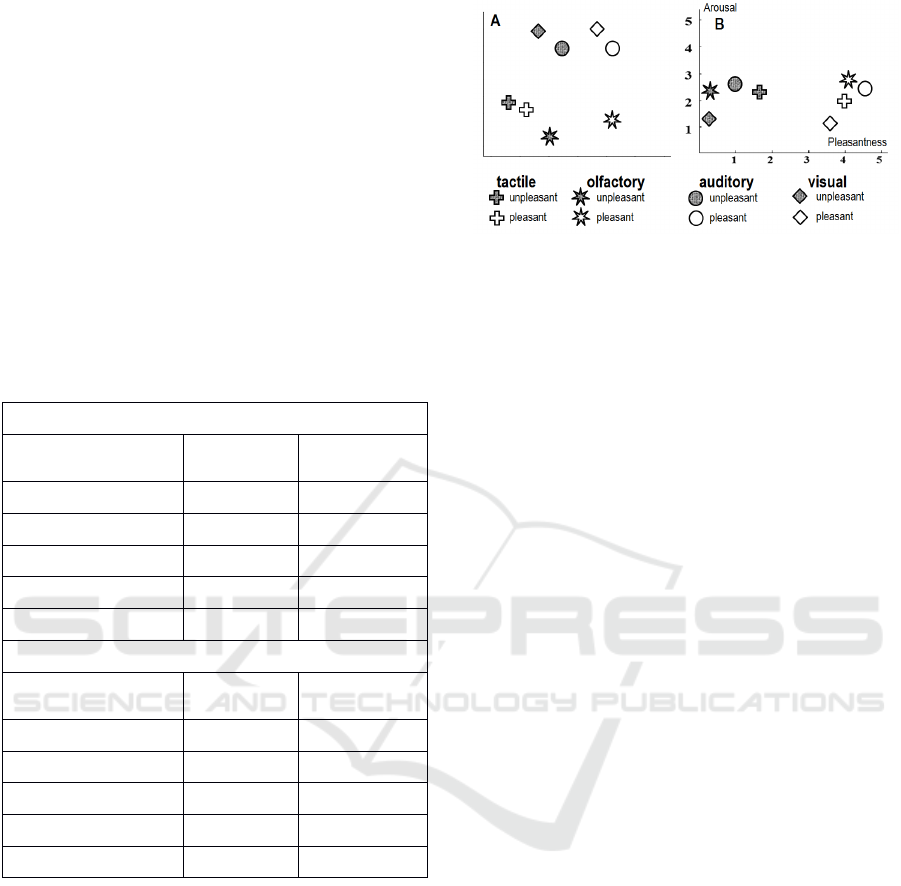
Each type of modality is depicted using the shape
the pleasant and unpleasant stimuli were depicted
using color (see Figure 3 A). So, the distances
between the stimuli types on the plane were as
similar as possible to the distances calculated by
FFT values. This similarity was always good enough
to claim the projection is legit.
5) The resulting pictures (obtained for each
subject) have arbitrary rotation because of
Sammon projection algorithm and different
sizes because of high individuality of EEG.
Before the averaging over group these
pictures should be standardized. We used
scaling to equalize the size (the sum of
squared distances to the figures from the
“center of mass”) and rotation/reflection so
that pleasant visual stimulus (white rhomb)
was on the top of the picture and the
unpleasant and pleasant auditory stimuli
(circles) were on the left and right sides
correspondingly laying on a horizontal line.
6) After standardization individual pictures are
averaged over groups. So, these pictures
show relational distances between emotional
sounds based on how much the
corresponding EEG data differ in terms of
rhythms magnitudes.
Figure 1: Steps of “Cognitive spaces” method.
2.9 Statistical Analysis
A one way ANOVA with Bonferroni correction for
multiple comparisons, p < 0.05, were used to
determine lateralization effects on EEG metrics. We
analyzed differences of EEG distances using
Student's t-test to compare indices for each stimulus
(p < 0.05). The Pearson’s correlation coefficient
between EEG indices and emotional assessments
was calculated. Significant R values were used for
further analysis (p < 0.05).
2.10 Classifier
The Deep neural network (DNN) and Extreme
Learning Machines (ELM) was used for the
classification of pleasant and unpleasant stimuli
recognition using the EEG signals (Han, 2014;
Tripathi, 2017). The testing sample was taken from
the dataset 1 and then passed on to the trained
The EEG-based Emotion Classification in Tactile, Olfactory, Acoustic and Visual Modalities
95
network. We had three data arrays, which contained
from 32 different channels: power spectral density,
alpha-peak frequency, and wavelet data. Wе
prepared two datasets
2.10.1 Dataset I
EEG data was taken from a first part of study, when
subjects assessed the pleasantness of different
stimuli. After the first type of EEG study subjects
assessed the stimuli using psychological scales. The
most “pleasant” and “unpleasant” stimuli was
selected using self-reported assessment and
psychometric scales and divided in two groups:
training and testing.
The classifier was trained on two types of EEG
data: 1) using most pleasant and unpleasant stimuli
separately for different modalities (8 groups,
sensory-specific) 2) using most pleasant and
unpleasant stimuli averaged over all modalities (2
groups, sensory-non-specific).
2.10.2 Dataset II
EEG datasets were taken from the second part of
study, when subjects were instructed as previously.
The tested EEG data contained pleasant and
unpleasant stimuli with the similar emotional
characteristics. The percentage of correct
classification was measured for each subject
separately.
2.11 Emotional Assessment of Stimuli
After the first part of the EEG registration subjects
were instructed to assess stimuli using specially
prepared questionnaire. The questionnaire included:
specification of presented stimuli and several scaled,
measuring emotional features (“Pleasantness”,
“Fear”, “Arousal”, “Disgust” and etc.) Participants
were instructed to indicate how the stimuli describe
their affective state on a scale from 0 (“not at all”) to
5 (“extremely”).
3 RESULTS
3.1 Power Spectral Density
The rhythmic spectral activity of more ancient
modalities (tactile and olfactory) was differed from
more modern modalities (auditory and visual): the
slow-wave rhythm PSD was lower and beta-rhythm
BSD was higher for ancient sensory systems
(p<0.05).
The differences of PSD between pleasant and
unpleasant stimuli showed significant asymmetry
(Figure 2). In the right hemisphere we found
significant differences of PSD between pleasant
stimuli for each modality type. In the left
hemisphere only visual and olfactory pleasant and
unpleasant stimuli’ PSD had significant differences.
The visual pleasant stimuli (compared to unpleasant)
had lower delta-rhythm PSD in the left hemisphere
and higher alpha-and beta-rhythm bilateral. The
auditory pleasant stimuli had lower delta and theta-
rhythm PSD and higher beta-rhythm in the right
hemisphere. The tactile pleasant stimuli had higher
alpha- and beta-rhythm in the right hemisphere. The
olfactory pleasant stimuli had higher alpha- and
beta-rhythm in the right hemisphere and lower beta-
rhythm in the left hemisphere.
Figure 2: The differences of the PSD in the right (A) and
left (B) hemisphere between pleasant and unpleasant
stimuli.
3.2 Alpha-peak Frequency
The alpha-peak frequency was significantly higher
for unpleasant stimuli compared to pleasant in the
right central and temporal areas (C4, T4, F8, Cz,
Pz). These differences were found for tactile,
auditory and visual stimuli.
CHIRA 2018 - 2nd International Conference on Computer-Human Interaction Research and Applications
96
3.3 Wavelet Standard Deviation
Significant differences were found only for visual
stimuli. Standard deviation was significantly higher
for pleasant visual stimuli: for theta- and delta-
rhythm in the right temporal areas (F8,T4,T6) and
for the alpha- and beta-rhythm in the central and
parietal areas (F8, F4, C4,Cz, C3 T4, T6, T5 Pz, P3,
O1).
3.4 Classification
The results of sensory-specific and sensory non-
specific classification are presented in Table 1.
Table 1: The percentage of correct classification (averaged
over the group).
DNN for 8 classes
Pleasant Unpleasant
Visual
0.81±0.02 0.84±0.05
Auditory
0.78±0.06 0.85±0.07
Tactile
0.80±0.01 0.71±0.05
Olfactory
0.88±0.04 0.89±0.03
Sensory-non-specific
DNN for 2 classes
Pleasant Unpleasant
Visual
0.65±0.01 0.71±0.04
Auditory
0.64±0.06 0.61±0.02
Tactile
0.72±0.02 0.58±0.01
Olfactory
0.69±0.03 0.76±0.05
Sensory-non-specific
0.64±0.07 0.67±0.04
3.5 Emotional Spaces
EEG differences represent the both sensory-specific
and sensory-non-specific differences between
stimuli (Figure 3). The unpleasant stimuli for each
modality were in the left side of the emotional space,
compared to pleasant stimuli. The more ancient
sensory systems were separated from the more
modern sensory systems. EEG distances between
pleasant and unpleasant stimuli positively correlated
with the distances of emotional assessment by the
scale “Pleasantness” (r>0.48, p<0.05). To calculate
distances of emotional assessment we analyzed
difference between scores of pleasant and unpleasant
stimuli.
Figure 3: A: “emotional spaces”, B: the subjective
assessment of stimuli using scales “Arousal” and
“Pleasantness”.
4 DISCUSSION
In our study we found that modern sensory systems
(visual and auditory) had similar EEG patterns and
differed from more ancient sensory systems
(olfactory and tactile). In spite of a small amount of
data, which analyzed emotional perception in four
different modalities simultaneously, some
researchers reported about similarity of the EEG
rhythmic activity in alpha- and beta-bands between
visual and auditory systems (Jessen and Kotz, 2011).
These data correspond to our results showed similar
beta-rhythm PSD between pleasant and unpleasant
stimuli in visual and auditory modalities.
We hypothesized that modality-independent
mechanisms of emotional processing always
accompany the emotional perception of pleasant and
unpleasant stimuli; the results of our study seem to
confirm this assumption. For example, we found the
good level of classification accuracy trained on
sensory-non-specific EEG distances. This modality-
independent difference between pleasant and
unpleasant stimuli also could be visualized using
“Emotional spaces” method. Other researchers also
reported about modality non-specific emotional
stimuli processing, which occurs when subjects
solve tasks, presented in different sensory systems
(Brosch, 2009). Previous research has demonstrated
that emotions from faces and emotions from voices
are also represented using similar mechanisms, for
example, both types of emotional stimuli have been
shown to be processed in the superior temporal
sulcus (Haxby et al., 2002; von Kriegstein and
Giraud, 2004).
Our results also demonstrated the asymmetry of
EEG changes during of emotional perception. This
data is consistent with the previous studies reported
about the brain asymmetry during processing of
The EEG-based Emotion Classification in Tactile, Olfactory, Acoustic and Visual Modalities
97

pleasant and unpleasant stimuli and hypothesized
that positive emotions correspond to the right
hemisphere, and negative – to the left (Fernandez-
Carriba et al., 2002). For example, the emotion-
modulated asymmetries, related with processing
pleasant and unpleasant emotional information were
found in the frontal cortex (Coan and Allen, 2004).
The clinical EEG studies have shown that depression
is associated with the greater activation of the right
prefrontal cortex (Davidson et al., 2002), other
researchers also reported about the higher activation
of the right amygdala (Abercrombie et al., 1998).
Furthermore, our results showed that most
pronounced differences of the EEG between
pleasant and unpleasant stimuli were found in the
right hemisphere. Previously, a general right
hemispheric advantage for emotion processing was
reported (Martin and Altarriba, 2017; Kesler-West et
al., 2001).
5 CONCLUSIONS
Visual and auditory sensory systems had similar
EEG patterns and differed from olfactory and tactile
sensory systems. The good level of classification
accuracy trained on sensory-non-specific EEG
distances was found. The advantage of the right
hemisphere for emotional processing was found. The
modality-independent difference between pleasant
and unpleasant stimuli is primarily visualized with
the “Emotional spaces” method. Further work is
needed to be done with the increased number of
healthy participants. Moreover, we are going to
include the patients with emotional impairments in
our study. The techniques used for classification
should be extended to support reported findings
ACKNOWLEDGEMENTS
We would like to thank engineer Kashevarova O,
researchers Atonov M, and Portnov V for assistance
in programming of “Cognitive spaces”, calculations
of the EEG parameters and DNN + EML
classification
REFERENCES
Abercrombie H, Schaefer S, Larson C, Oakes T, Lindgren
K, Holden J, et al. , 1998 .Metabolic rate in the right
amygdala predicts negative affect in depressed
patients. In Neuroreport, 9(14):3301–3307.
Brosch T, Grandjean D, Sander D., Scherer K. R. 2009.
Cross-modal emotional attention: emotional voices
modulate early stages of visual processing. J Cogn
Neurosci. 21(9):1670-9
Buss A, H,, Durkee A., 1957. Inventory for assessing
different kinds of hostility.In J Consult Psychol
21:343–9.
Coan J, Allen J., 2004. Frontal EEG asymmetry as a
moderator and mediator of emotion. In Biological
Psychology, 67:7–49
Davidson R, Pizzagalli D, Nitschke J, Putnam K., 2002.
Depression: Perspectives from affective neuroscience.
In Annual Review of Psychology;53(1):545–574.
Delorme, A., Makeig, S. 2004. EEGLAB: an open source
toolbox for analysis of singletrial EEG dynamics
including independent component analysis. J.
Neurosci. Methods, 134, 9–21.
Delplanque S, Grandjean D, Chrea C, Aymard L, Cayeux
2008. I, Le Calve B, Velazco MI, Scherer KR, Sander
D. Emotional processing of odors: evidence for a
nonlinear relation between pleasantness and
familiarity evaluations. Chemical Senses. Apr
9;33(5):469-79.
Diao, L., Qi, S., Xu, M., Fan, L., and Yang, D. 2017.
Electroencephalographic theta oscillatory dynamics
reveal attentional bias to angry faces. In Neuroscience
letters, 656, 31-36.
Fernandez-Carriba, S., A. Loeches, A. Morcillo, and W.D.
Hopkins, 2002. Functional asymmetry of emotions in
primates: new findings in chimpanzees. In Brain
Research Bulletin. 57: 561–564.
Han, K., Yu, D. and Tashev, I., 2014. Speech emotion
recognition using deep neural network and extreme
learning machine. In Fifteenth annual conference of
the international speech communication association.
Haxby, J., Hoffman, E., and Gobbini, I., 2002. Human
Neural Systems for Face Recognition and Social
Communication. In Biological Psychiatry. 51(1):59-
67
Grabenhorst, F., Rolls, E. T., Margot, C., da Silva, M. A.
and Velazco, M.I., 2007. How pleasant and unpleasant
stimuli combine in different brain regions: odor
mixtures. Journal of Neuroscience, 27(49), pp.13532-
13540.
Iosilevich E. A., Chernysheva E. G., Chernyshev B. V.,
2012. Psychophysiological study of the connection
between the valence of the emotional response and the
EEG spectral power indicators of human. In: Modern
Psychology: Theory and Practice: Materials of the V
International Scientific and Practical Conference,
Moscow, July 3-4, M.: Special book, 2012. S. 21-27.
(in Russian)
Jessen S, Kotz S. A., 2011. The temporal dynamics of
processing emotions from vocal, facial, and bodily
expressions. In Neuroimage. Sep 15;58(2):665-674
Kesler-West, M., Andersen, A., Smith, C., Avison, M.,
Davis, C., Kryscio, R., Blonder, L. 2001. Neural
substrates of facial emotion processing using fMRI.
Cognitive Brain Research, 11(2):213-26
CHIRA 2018 - 2nd International Conference on Computer-Human Interaction Research and Applications
98

Lévesque, M., Cataldi, M., Chen, L. Y., Hamidi, S. and
Avoli, M., 2017. Carbachol-induced network
oscillations in an in vitro limbic system brain slice.
Neuroscience, 348, pp.153-164.
Löken, L. S., Wessberg, J., McGlone, F., and Olausson, H.
2009. Coding of pleasant touch by unmyelinated
afferents in humans. Nature neuroscience, 12(5), 547-
548.
Martin, J. M. and Altarriba, J., 2017. Effects of valence on
hemispheric specialization for emotion word
processing. Language and speech, 60(4), pp.597-613.
McGlone F., Olausson H., Boyle J. A., Jones-Gotman M.,
Dancer C., Guest S., et al. 2012. Touching and feeling:
differences in pleasant touch processing between
glabrous and hairy skin in humans. Eur. J. Neurosci.
35, 1782–1788
McGlone F, Wessberg J and Olausson H, 2014.
Discriminative and Affective Touch: Sensing and
Feeling. In Neuron, 82, May 21, pp. 738-755
Monosova A. J. 1994. PhD theses. Analysis of the features
of the emotional sphere in normal and affective
disorders by olfactory stimulation. M, (in Russian)
Roik A. O, Ivanitskii G. A., 2013. Neurophysiological
Model of the Cognitive Space //Neuroscience and
Behavioral Physiology. V 43(2):193-199.
Roik A. O., Ivanitskii G. A., Ivanitskii A. M. 2014. The
Human Cognitive Space: Coincidence of Models
Constructed on the Basis of Analysis of Brain
Rhythms and Psychometric Measurements. Neuro-
science and Behavioral Physiology. 44 (6): 692-701.
Sammon J. W. 1969 A nonlinear mapping for data
structure analysis //IEEE Transactions on computers.
V 18(5): 401-409.
Spielberger C. D., Goursch R. L. and Lushene R. E. 1970
Manual for the State-Trait Anxiety Inventory.
Consulting Psychologist Press, Palo Alto, CA
Stokes, D., Matthen, M., and Biggs, S. (Eds.). 2014.
Perception and its modalities. Oxford University
Press, USA.
Stuhlsatz, A., Meyer, C., Eyben, F., Zielke, T., Meier, G.,
and Schuller, B. 2011. Deep neural networks for
acoustic emotion recognition: raising the benchmarks.
In Acoustics, speech and signal processing (ICASSP).
IEEE international conference on (pp. 5688-5691).
Tallon-Baudry, C., Bertrand, O., Delpuech, C. and Pernier,
J., 1996. Stimulus specificity of phase-locked and non-
phase-locked 40 Hz visual responses in human.
Journal of Neuroscience, 16(13), pp.4240-4249.
Tripathi, S., Acharya, S., Sharma, R.D., Mittal, S. and
Bhattacharya, S. 2017. Using Deep and Convolutional
Neural Networks for Accurate Emotion Classification
on DEAP Dataset. In AAAI, pp. 4746-4752.
Tumyalis, A. V., Korenkov V. V., Brak I. V., Makhnev V.
P., Reva N. V., Aftanas L. I. 2010. The Individual
frequency of alpha activity and emotions negative
positive emotions / / Bulletin RAS, V. 30(4).
Von Kriegstein, K. and Giraud, A.-L. 2004. Distinct
functional substrates along the right superior temporal
sulcus for the processing of voices. NeuroImage,
22(2), 948-955
Wu, Y. H., Uluç, I., Schmidt, T. T., Tertel, K., Kirilina, E.,
and Blankenburg, F. 2018. Overlapping frontoparietal
networks for tactile and visual parametric working
memory representations. NeuroImage, 166, 325-334.
APPENDIX
The work was supported by the grant of Russian
Foundation for Basic Research № 16 – 04 -00092 A
and the Russian Academy of Science.
The EEG-based Emotion Classification in Tactile, Olfactory, Acoustic and Visual Modalities
99
