
Random Walks on Human Knowledge: Incorporating Human
Knowledge into Data-Driven Recommenders
Hans Friedrich Witschel and Andreas Martin
FHNW University of Applied Sciences and Arts Northwestern Switzerland, CH-4600 Olten, Switzerland
Keywords:
Recommender Systems, Knowledge Representation, Random Walks.
Abstract:
We explore the use of recommender systems in business scenarios such as consultancy. In these situations,
apart from personal preferences of users, knowledge about objective business-driven criteria plays a role. We
investigate strategies for representing and incorporating such knowledge into data-driven recommenders. As
a baseline, we choose a robust and flexible paradigm that is based on a simple graph-based representation
of past customer cases and choices, in combination with biased random walks. On a real data set from a
business intelligence consultancy firm, we study how the incorporation of two important types of explicit
human knowledge – namely taxonomic and associative knowledge – impacts the effectiveness of a data-driven
recommender. Our results show no consistent improvement for taxonomic knowledge, but quite substantial
and significant gains when using associative knowledge.
1 INTRODUCTION
Recommender systems are widely used to support cu-
stomers in deciding on products or services. They can
learn and predict user preferences for items such as
movies, music or books. Extensive research has been
done in this area, and robust solutions are known –
which are, e.g., based on transferring choices from
other users with similar preferences (collaborative fil-
tering).
However, recommenders are increasingly used not
only for prediction of subjective preferences but also
in business scenarios where they may be used to op-
timise decisions, e.g. in the selection of IT systems
and their features (Felfernig and Burke, 2008) or the
optimisation of product assortments (Witschel et al.,
2015; Brijs et al., 2004). Traditionally, such decisi-
ons were supported by humans: technical consultants
use their knowledge about IT systems and the particu-
larities of various industries and businesses to make
tailored suggestions.
In such situations, it is typical that a) the utility
of recommended items does not depend solely on a
person’s preferences, but must meet some objective
criteria of fit that originate from the business context
and/or that b) items are complex and may themselves
be composed of sub-items. Beyond these characteris-
tics, Felfernig and Burke (2008) explain that the need
for recommendation arises more rarely than in traditi-
onal scenarios, i.e. we cannot hope to gather the same
amount of data in little time as in e.g. a movie data-
base scenario where many users watch and rate mo-
vies frequently. The infrequent use implies that the
systems do not maintain user profiles and hence users
need to express their needs and constraints in the form
of a query when accessing the system.
In this work, we consider the scenario of technical
consultancy: we have conducted a case study with a
company that offers advice and technical support to
their business customers in building tailored business
intelligence solutions. Such solutions have technical
components, but – even more importantly – also con-
sist of a set of elements to measure and understand a
company’s success in reaching their strategic business
objectives (key performance indicators (KPIs) and as-
sociated dimensions). The choice of these elements
depends on the business context of the customer (e.g.
the industry) – hence, the consultants need abundant
knowledge about which contexts imply which choi-
ces.
In this scenario, we wish to develop a recommen-
der that can support consultants by learning from past
projects: by collecting data describing the business
contexts of customers and the choices that were fi-
nally made by them, we build a case base from which
the recommender learns.
However, we claim that, as discussed by Felfer-
nig and Burke (2008), the implicit knowledge of past
Witschel, H. and Martin, A.
Random Walks on Human Knowledge: Incorporating Human Knowledge into Data-Driven Recommenders.
DOI: 10.5220/0006893900630072
In Proceedings of the 10th International Joint Conference on Knowledge Discovery, Knowledge Engineering and Knowledge Management (IC3K 2018) - Volume 3: KMIS, pages 63-72
ISBN: 978-989-758-330-8
Copyright © 2018 by SCITEPRESS – Science and Technology Publications, Lda. All rights reserved
63

choices can be complemented with the explicit kno-
wledge that consultants have, e.g. regarding con-
straints about the joint occurrence of elements. Anot-
her hypothesis is that, as argued by Bogers (2010),
graphs are a generic and easily extendable way of re-
presenting both implicit and explicit knowledge. The
central question is how the two types of knowledge
can be combined within a recommendation algorithm.
We address this question in our study and present fin-
dings that can be generalised to other settings of busi-
ness consultancy.
The rest of this paper is organised as follows:
we discuss related work in Section 2 and our rese-
arch methodology in Section 3. Section 4 describes
our proposed solution alternatives for the graph-based
combination of implicit and explicit knowledge. We
evaluate these alternatives in Section 5 and discuss
conclusions and options for future work in Section 6.
2 RELATED WORK
Reviews on the state-of-the-art in recommender sys-
tems invariably start with the distinction between col-
laborative filtering and content-based filtering, plus
demographic and hybrid methods, as the predominant
types of approaches (Bobadilla et al., 2013).
Collaborative filtering (CF) is based on ratings and
tries to recommend items to users that have been ra-
ted highly by other users with similar interests. A
commonly used method for CF is memory-based, i.e.
proceeds by identifying the k most similar users and
selecting their highest rated items. An initial lack of
user ratings, e.g. for a new item, is referred to as the
“cold-start problem” (Schafer et al., 2007) and seen
as one of the main CF problems.
Content-based filtering (CBF), on the other hand,
learns a model of user preferences from their past
choices to score items (Van Meteren and Van So-
meren, 2000). Here, so-called model-based approa-
ches prevail that incorporate machine learning appro-
aches such as neural networks or decision trees. Pro-
blems of CBF may arise because it is hard to extract
meaningful attributes from items in specific domains
(such as movies) and because CBF systems tend to
overspecialise, i.e. to recommend always the same
kind of items (Bobadilla et al., 2013).
Content-based filtering can be combined with CF
(“hybrid recommender”), e.g. to mitigate the cold-
start problems – since new items can be recommen-
ded immediately by content-based techniques as long
as they have a meaningful description that can be ma-
tched against user profiles.
A distinct advantage of CBF is its ability to
provide feature-level explanations (Papadimitriou
et al., 2012) of its recommendations (e.g. to say
that a movie was recommended because of its
director). Explanations are an important feature for
recommenders since it has been shown that despite
their effectiveness, humans are sometimes reluctant
to accept recommendations from CF recommenders
because they cannot easily make sense of them
(Yeomans et al., 2017).
Where Does Human Knowledge Come into Play and
Which Knowledge Plays a Role?
Felfernig and Burke (2008) distinguish four types of
knowledge sources: (a) the current user and his/her
preferences and context, (b) his/her peers and their
ratings or demographics, (c) the content of the items
and their features and (d) the domain of recommenda-
tion and the constraints that it may impose (e.g. some
items not being appropriate for non-adults). Another
notable example of domain constraints are didacti-
cal considerations in e-learning (Tarus et al., 2017):
when recommending learning materials to learners in
e-learning, their preferences are not the only aspect
that plays a role – rather, the appropriateness for ad-
vancing the learning process of the learner should be
considered. Obviously, consultancy has similar con-
straints, in the sense that instead of user preferences
other (more objective) aspects such as business requi-
rements play a role.
Some of these types of knowledge are being used
more or less heavily in common CF or CBF appro-
aches, for instance (a) in CBF and (b) in CF and
demographic-based recommenders.
Obviously, the fact that content-based filtering
builds an explicit model of user preferences (which
CF does not) makes it a candidate for including
knowledge of types (c) and (d). However, all re-
commenders can be said to be knowledge-based in
principle.
How to Use the Knowledge?
In CBF, knowledge can be incorporated, e.g. into
the function that determines the similarity between an
item and the user profile. Often, this is knowledge
about user context, item features and/or domain-
specific constraints. For instance, Carrer-Neto et al.
(2012) and Blanco-Fern
´
andez et al. (2008) use on-
tologies to represent and reason about item features
and to apply this knowledge in a sophisticated simi-
larity measure that takes into account “hidden relati-
onships” (Blanco-Fern
´
andez et al., 2008). Middleton
et al. (2004) use an ontology to represent user profi-
les and engage users in correcting the profiles before
assessing profile-item similarities.
KMIS 2018 - 10th International Conference on Knowledge Management and Information Sharing
64

This approach also bears a resemblance to case-
based reasoning (CBR) – a paradigm that attempts to
solve new problems by adapting solutions to similar
previous problems. If we interpret the profile – or also
the current interest – of a user as a problem and his-
torical choices (of this and other users) as the past so-
lutions, we can build “case-based recommender sys-
tems” (Bridge et al., 2005). In CBR, a great wealth of
research exists regarding the best choice for a simila-
rity measure (Cunningham, 2009).
Using knowledge to improve results has a long tra-
dition in information retrieval literature. There, the
most heavily used approach is to represent knowledge
in the form of a thesaurus, i.e. to capture different
kinds of relationships between words and use them
e.g. to add related terms to queries (“query expan-
sion”, see (Voorhees, 1994)). In thesauri, hierarchi-
cal relationships play an important role (i.e. taxono-
mies) and researchers have explored the combination
of human-built thesauri –containing mostly hierarchi-
cal relationships – with automatically computed asso-
ciative relationships (Tudhope et al., 2001). This is
closely related to some of the knowledge types that
we will explore later.
Knowledge-based recommenders are described in
earlier literature as ones that “effectively walk the
user down a discrimination tree of product features”
(Burke, 1999), an approach that closely resembles
conversational CBR (Aha et al., 2001). Thus, this
kind of recommender can be seen as a CBF appro-
ach that constructs a user profile – or in fact a user
query – on-the-fly. This is useful in situations – such
as the ones that we are considering in our approach –
where a recommender is not invoked very frequently
by a given person and hence a personal profile cannot
be constructed easily by the system. An alternative
way to look at user preferences is to see them as con-
straints that must be satisfied and to allow repairs, i.e.
the relaxation of constraints when no suitable items
(solutions) are found (Felfernig and Burke, 2008; Jan-
nach, 2009).
User requirements and constraints can also be eli-
cited through “critiques”, i.e. based on feedback in
which users can express how features of a presen-
ted item deviate from their ideal (Ricci and Nguyen,
2007; Felfernig and Burke, 2008).
Finally, similarity can also accommodate expli-
cit information about user preferences: Burke (2000)
suggest to collect the reasons behind user ratings and
use them to compute adjusted similarities in collabo-
rative filtering.
How to Represent the Knowledge?
As mentioned earlier, all recommenders necessarily
use knowledge – they mainly differ regarding which
types of knowledge they use and/or how explicitly
that knowledge is represented. In CF, for instance, the
only knowledge that is used and explicitly represented
is that about users’ item ratings (i.e. user preferences),
whereas pure content-based systems use information
about user preference and/or context and item con-
tent. Depending on the chosen approach, these may
be more or less explicitly represented.
For instance, when items have textual content
(such as books or other documents), informative
terms selected from item content can be used to des-
cribe both items and profiles, e.g. via knowledge vec-
tors (Nt et al., 2013).
As a more appropriate explicit representation, on-
tologies are widely adopted. They may be used to
represent knowledge about user profiles (Middleton
et al., 2004) and item features (Blanco-Fern
´
andez
et al., 2008; Carrer-Neto et al., 2012). Apart from
concepts and relationships, ontologies can be equip-
ped with rules to express domain constraints (Felfer-
nig and Burke, 2008).
To use the full potential of ontologies, one has to
identify which relationships can aid the recommenda-
tion process – e.g. the fact that two users are con-
nected in a social network or that a user has rated
or bought an item. Often, it is hard to quantify the
strength of the influence of relations: does the fact
that my friend liked an item have more power to pre-
dict my own preference or the fact that I bought a si-
milar item a while ago? To be able to include easily
any number of relationships that might be (or not) re-
levant for the prediction of preferences, graph-based
representations of data have emerged, where the types
of relations are largely ignored by recommendation
algorithms.
For instance, Bogers (2010) argues that most re-
commenders are lacking context or that approaches
that do consider context are limited to special forms
of it, e.g. social context or the company a user works
for. By using a graph, the incorporation of additio-
nal knowledge (in the form of relations) becomes easy
(see also the work of Minkov et al. (2017) who apply
a graph-based approach in the domain of museums).
On such untyped/associative graph structures,
random walks are a predominant type of algorithm
(Fouss et al., 2007; Huang et al., 2002). One often
constructs a “query set” of graph nodes, e.g. from
user behaviour or explicit inputs and then applies
random walks that are biased towards these query no-
des or that have finite length and start from these no-
des (Bogers, 2010).
Random Walks on Human Knowledge: Incorporating Human Knowledge into Data-Driven Recommenders
65

Through incorporating transitive associations,
graphs and random walks can be used to overcome
cold-start problems: it is sufficient for a new item or
user to have some connection to the existing graph to
receive recommendations (Zhang et al., 2013). Furt-
hermore, as shown by Minkov et al. (2017), graph-
based recommender approaches – through their abi-
lity to represent a great wealth of context variables –
lead to gains in recommendation effectiveness when
compared to kNN-based collaborative filtering.
Since our goal is to find an approach that can ea-
sily accommodate contextual knowledge – i.e. wit-
hout imposing much effort on domain experts or need
for programming when new relations are identified –
and that can be easily transferred to other domains,
the graph-based approach seems promising. Howe-
ver, what is lacking in the known approaches, is a
clear understanding of where to use the knowledge:
is it best to simply add relations into a graph? Can it
help to preprocess the data (e.g. computing explicit
similarity of certain nodes) to shorten path lengths?
Alternatively, is it even more fruitful to use the know-
ledge for filtering the recommender’s results via con-
straints? The present paper will help to close this gap.
3 METHODOLOGY
As mentioned in Section 1, we study the question of
how to combine implicit and explicit knowledge with
the help of a concrete company that offers business in-
telligence (BI) consultancy. In order to scale up their
business, this company would like to (partially) auto-
mate and better support the consultancy process.
We obtained the following information:
1. We interviewed two consultants to understand
how consultancy meetings work and which type
of knowledge is used by them in which ways du-
ring the meetings. We then used these insights to
extend and concretise the taxonomy of knowledge
sources provided by Felfernig and Burke (2008).
2. We obtained data about past customer projects:
for each customer, a case was constructed that re-
presents the business context of the customer (e.g.
the industry, the core business processes to be ana-
lysed) and the elements of the chosen BI solution
(key performance indicators (KPIs) and dimensi-
ons). Overall, this case base consisted of 42 cases.
The case base and its representation as a graph are
described in more detail in Section 4.
3. The required explicit knowledge that we identified
in the first step was then codified by one of the two
consultants and later added to the case base graph.
This process was supported by automated analy-
ses which are also described in detail in Section
4.
We then performed experiments with the case base
graph G: we followed a leave-one-out approach, i.e.
for each case C, we constructed a version G \ C of
the case base graph by omitting C. We then con-
structed two different types of queries out of C and
ran a random walk on G \C (White and Smyth, 2003)
biased towards the query nodes to obtain a ranking of
recommendations of KPIs and dimensions for C.
By treating the known chosen elements in C as
a “ground truth” of relevance, we could measure the
average precision (Voorhees and Harman, 2006) of
rankings. We then compared the mean average preci-
sion of those runs that used the pure case base graph
(baseline) to the outcome of runs that used the various
ways of incorporating human knowledge.
4 INCORPORATING HUMAN
KNOWLEDGE
4.1 Sources of Explicit Knowledge
As explained in the previous section, we first asked
the human consultants how they use knowledge in
their consultancy meetings and how these meetings
proceed in general.
A first finding was that customers often come to
the meetings with some important KPIs and dimen-
sions (i.e. solution elements) already in mind. La-
ter, we will reflect this fact by constructing “verbose
queries” that contain already some solutions elements
that should be complemented with further elements.
Besides this input, consultants mentioned the in-
dustry of the customer and the core processes to be
analysed as relevant inputs. It turned out that solution
elements are very different for the different processes
– we thus built separate case bases / case graphs for
each process.
Regarding the taxonomy of knowledge sources
proposed by Felfernig and Burke (2008) (see Figure
1), the information about the industry (and possibly
the size) of the customer constitutes demographic
knowledge. All these pieces of information are tre-
ated as a query that is passed to the system.
But how do consultants process these inputs to ar-
rive at recommendations? What knowledge do they
apply? The interview, coupled with a discussion of
some concrete cases, revealed the following strate-
gies:
KMIS 2018 - 10th International Conference on Knowledge Management and Information Sharing
66
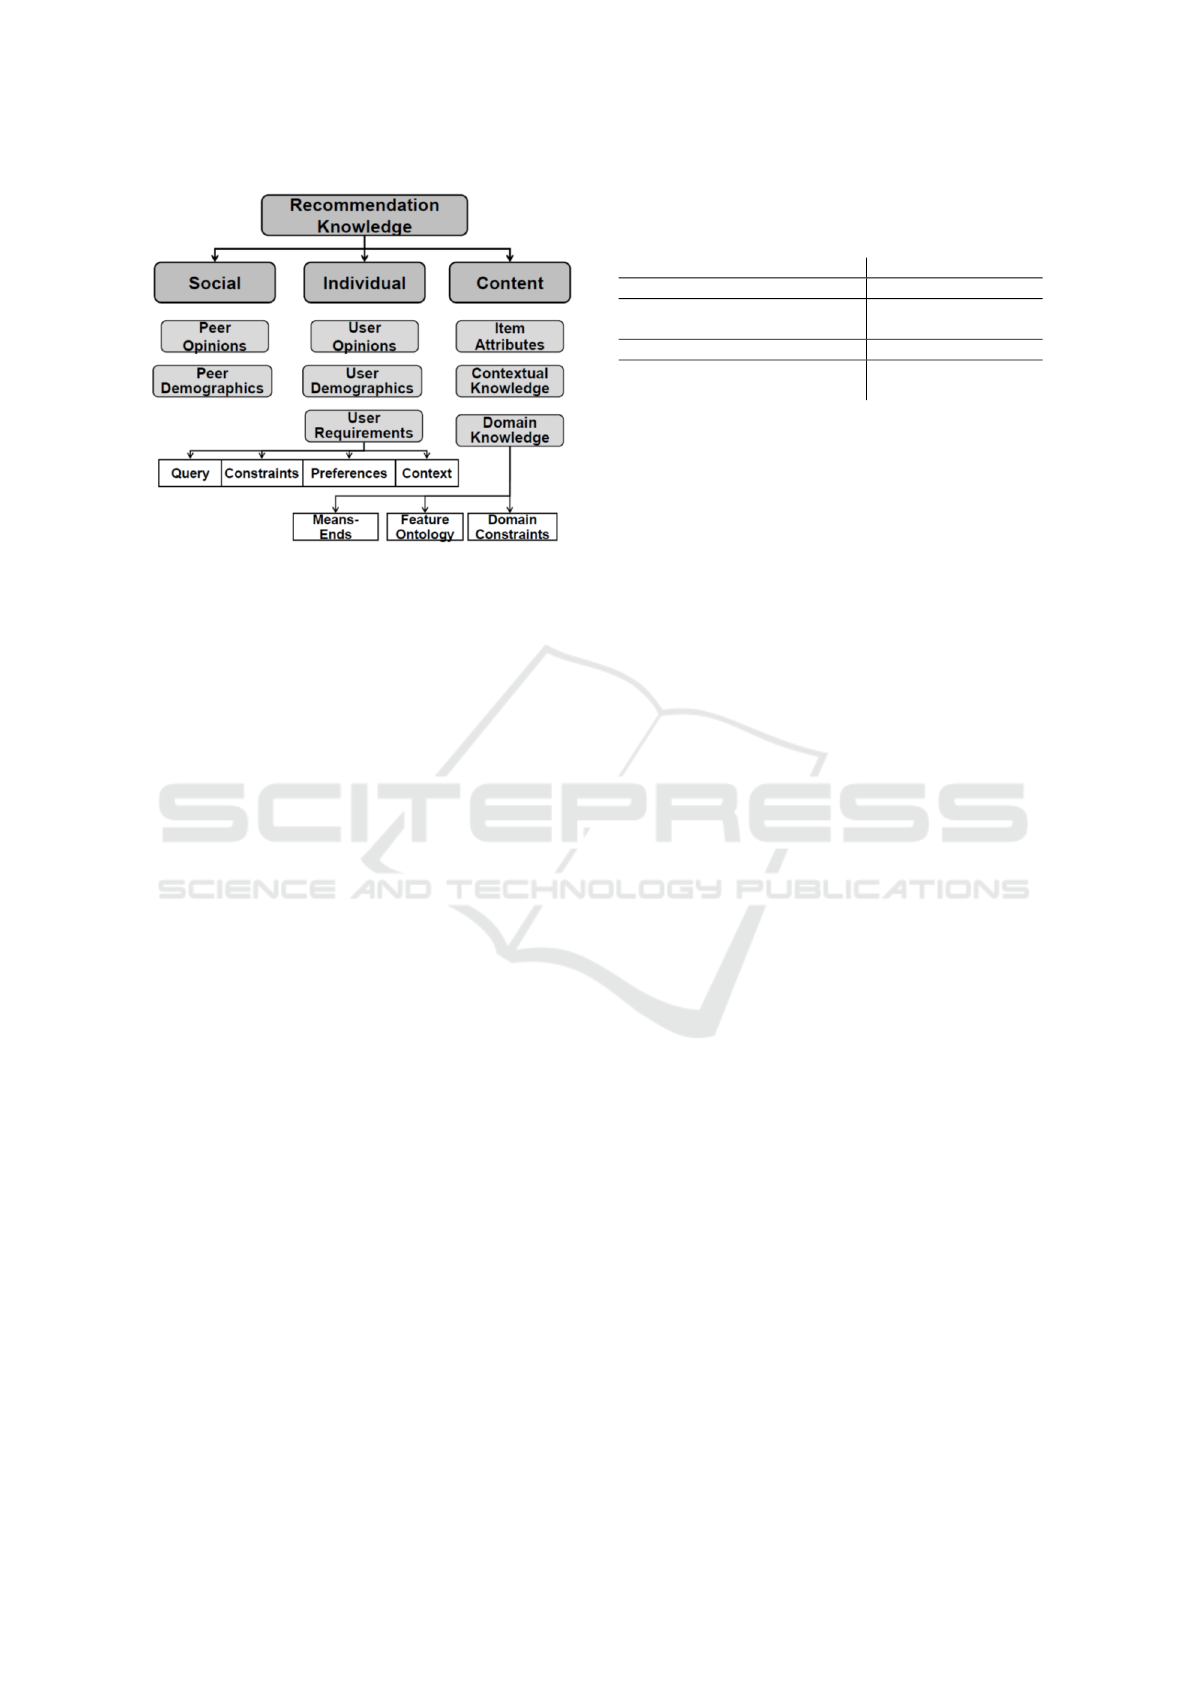
Figure 1: Taxonomy of knowledge sources used in recom-
menders, as suggested by Felfernig and Burke (2008).
• An important part of the consultants’ knowledge
consists in the ability to predict KPIs and dimen-
sions that are typically relevant in the customer’s
industry – this corresponds to social knowledge
in the sense that consultants remember the re-
quirements of similar customers. However, a
consultant might know little about a new custo-
mer’s industry because there have been only a few
past cases involving that industry. In such cases,
it may help to know typical KPIs and dimensions
from similar industries.
• Although KPIs and dimensions can be regarded as
the items to be recommended, they are not inde-
pendent of each other. That is, in contrast to sce-
narios of music or movie recommenders, BI con-
sultants need to recommend items that fit toget-
her in the sense that the overall solution reflects
the customer’s analytic needs. This knowledge,
which can be seen as a “positive” form of domain
constraints, typically comes in the form of associ-
ations, i.e. groupings of KPIs and dimensions that
should be analysed together. An example of such
a grouping is to say that including the KPI “Bud-
get” implies also including “Actual” for analyses
of financial spending.
Table 1 summarises the most important pieces of
information and knowledge that are employed by hu-
man consultants and which knowledge sources from
Felfernig and Burke (2008)’s taxonomy they concre-
tise.
The demographics of a customer (above all indu-
stry) serve as an input that will be explicitly repre-
sented within a query. Requirements of similar cus-
tomers can be implicitly represented in the case base
– a recommender can learn e.g. which demographics
Table 1: Information and knowledge applied by human con-
sultants and their classification according to Felfernig and
Burke (2008).
Information / Knowledge Type of source
Industry, size of customer user demographics
Requirements of similar custo-
mers
peer demographics
Similarity of industries Domain knowledge
Associations of KPIs / dimen-
sions
Domain constraints
imply which KPIs and dimensions by analysing the
elements chosen in past cases. This might even be
more effective than the experience of human consul-
tants since the case base is richer than what a single
consultant has experienced.
What remains are the similarities/associations
from the third and fourth row of Table 1. We hypothe-
sise that making this type of consultants’ knowledge
explicit and adding it into the recommendation pro-
cess will improve its results. Therefore, we now ex-
plore the options for doing so.
4.2 Graph-based Case Base
Representation and Random Walks
By analysing past consultancy projects of our partner
company, a case base with 42 cases was built. Since
many cases involved KPIs and dimensions for more
than one business process and since we decided to
build a separate case base for each of the 9 different
processes, we obtained 9 case bases, each of different
size. Overall, there were 80 cases (combinations of
customer and process) in these case bases.
For each case base, we built a graph with typed
vertices to represent the data. As shown in Figure 2,
there are 5 different types of vertices namely cases
(red), industries (green), diagrams (brown) and KPIs
and dimensions (both black). The black nodes are the
items to be recommended by the recommender.
Diagrams come from a catalogue that the com-
pany has built and that customers can choose from to
visualise their data. The catalogue contains, for each
diagram, a definition of which KPIs and dimensions
are represented in the diagram. Thus, the catalogue
was a piece of explicit knowledge that was already
available and that creates associations between KPIs
and dimensions (we can assume that the ones being
used in the same diagram belong together).
Edges were added to the graph as follows: each
case node was connected to the vertex of the custo-
mer’s industry and to the KPIs and dimensions that
the customer finally chose in their BI solution.
Besides, a “catalogue graph”, consisting of
the edges between diagram nodes and their
Random Walks on Human Knowledge: Incorporating Human Knowledge into Data-Driven Recommenders
67
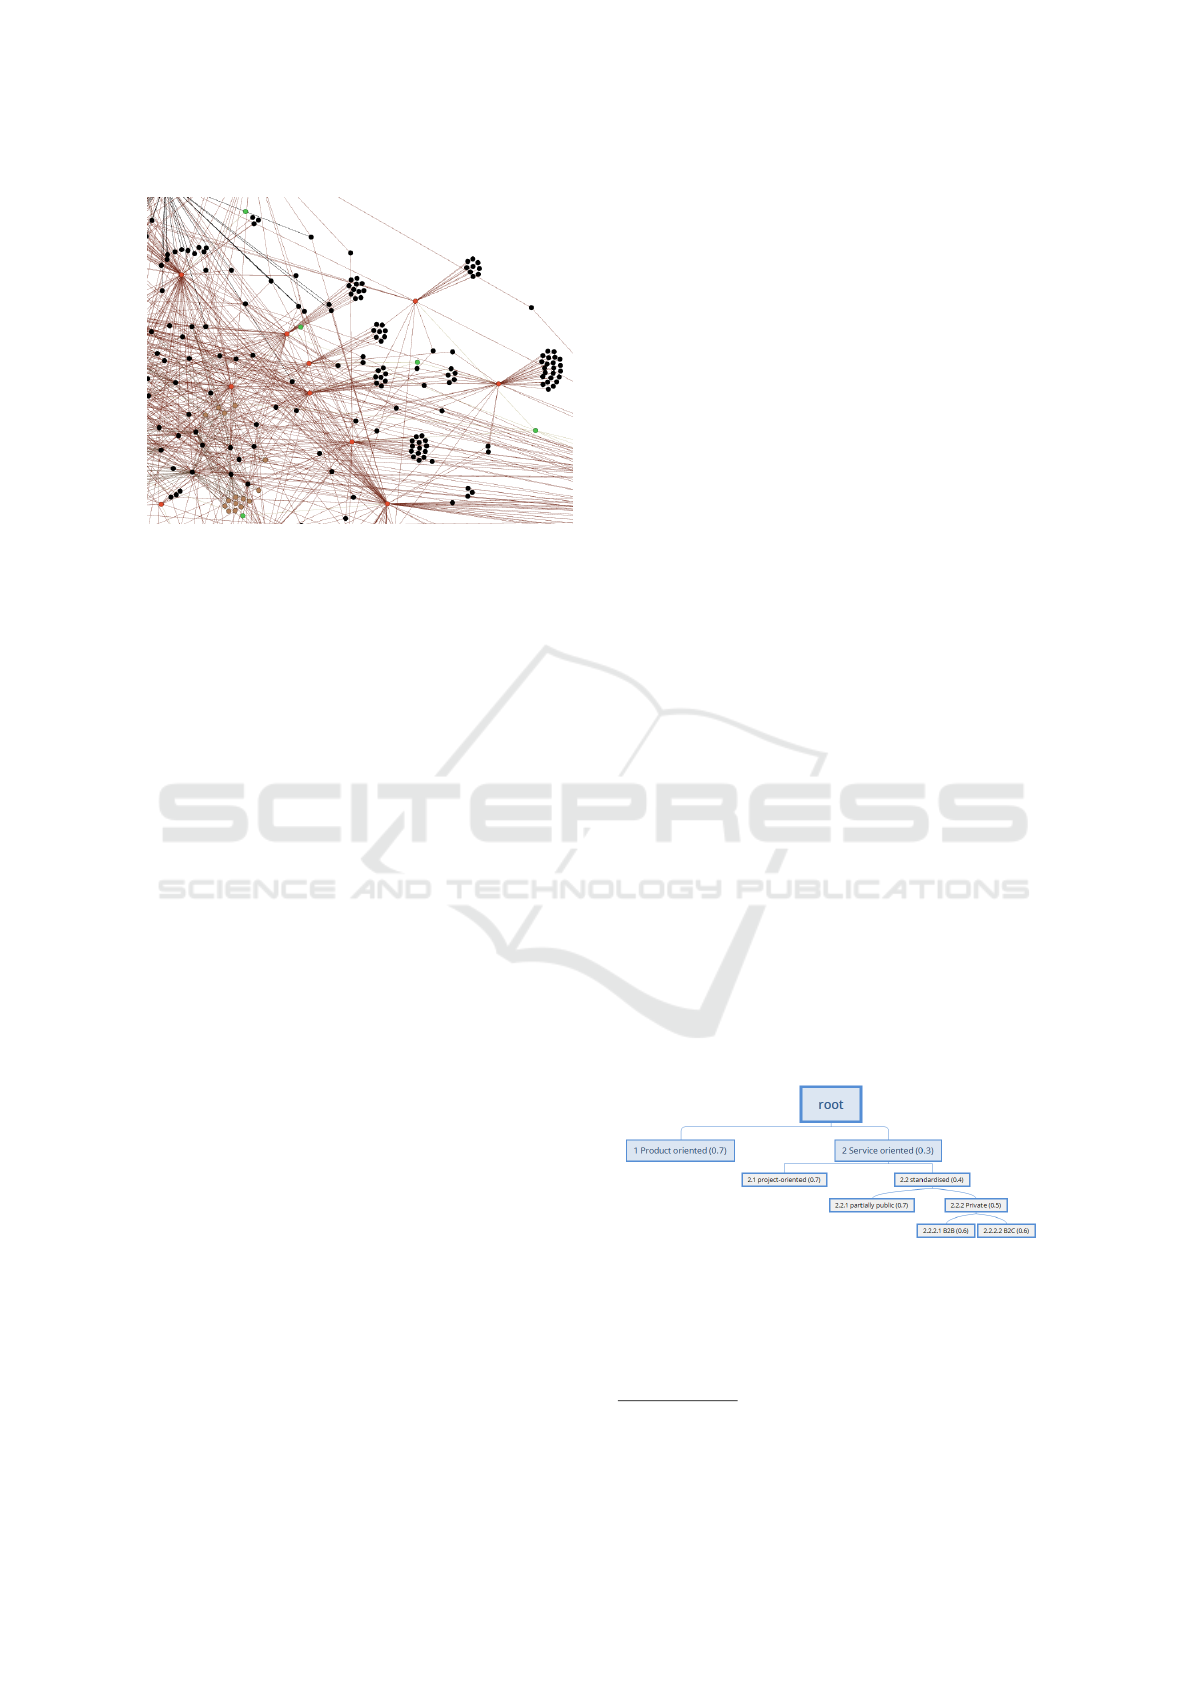
Figure 2: A snapshot of a case base graph.
KPIs/dimensions were added to each of the 9
case base graphs.
Given the 9 case base graphs, a recommender can
be implemented via a biased random walk as follows:
• For a new customer/process combination, a query
is constructed by including the customer’s indu-
stry (simple query).
• To simulate the fact that customers often come
with some KPIs / dimensions in mind, we con-
structed also verbose queries by adding some KPI
/ dimension nodes.
• The nodes contained in the query were initialised
with a prior weight of 1/n where n is the num-
ber of nodes in the query. All other nodes were
initially weighted 0.
• Using these priors, the PageRank with Priors al-
gorithm White and Smyth (2003) was invoked.
The resulting distribution of node weights reflects
the probability of each node being reached via a
random walk that is biased towards the query no-
des. This obviously favours nodes that can be re-
ached via many short paths from the query nodes,
i.e. ones that are e.g. used in other cases with the
same industry or using the same KPIs/dimensions.
4.3 Alternatives for Representation and
Incorporation of Explicit
Knowledge
As described above in Section 4.1, our scenario analy-
sis has revealed two main types of explicit knowledge
to be incorporated, namely knowledge regarding (a)
the similarities between industries and (b) clusters of
KPIs / dimensions that should be recommended to-
gether.
From a recommender point of view, these two ty-
pes are fundamentally different: industries are not
items to be recommended, but KPIs and dimensions
are. Thus, whereas industry similarities serve as a
background knowledge to improve recommendations
in the presence of a cold start problem (e.g. no pre-
vious customer from the same industry), clusters of
KPIs and dimensions can be applied directly to im-
prove the output of a recommender, e.g. by including
KPIs associated to highly-ranked items (“re-ranking”,
see below).
In the following, we will discuss representation
and incorporation alternatives for each of the know-
ledge types separately.
4.3.1 Taxonomic Knowledge
A natural way to group industries is in the form of
a tree structure (taxonomy). In fact, there exist se-
veral standardised taxonomies, e.g. NACE
1
. As ob-
served e.g. by Bergmann (1998), the possible values
of many case attributes (in whichever domain) can be
organised as taxonomies and, more generally, taxono-
mic knowledge is important and frequently applied in
many domains. Thus, an analysis of how to best in-
corporate such knowledge will also be interesting not
only for BI consultancy but also in other domains.
For our purposes, we aimed to have a taxonomy
that groups industries into the same branch whose
companies are likely to have the same KPIs and di-
mensions. When studying some standard industry
taxonomies such as NACE, we realised that the ab-
stractions made therein did not reflect to a sufficient
degree the similarities of analytical needs in indus-
tries. We thus asked the consultants to help us cre-
ate a proprietary industry taxonomy that reflects their
typical customers and their commonalities regarding
KPIs/dimensions.
Figure 3: The derived taxonomy of customer industries.
Figure 3 shows the inner nodes of this taxonomy.
To illustrate its rationale, consider the branch “2.1
project-based” which represents companies that de-
liver non-standard, individualised services to their cu-
1
http://eur-lex.europa.eu/legal-content/EN/TXT/
HTML/?uri=CELEX:32006R1893&from=EN
KMIS 2018 - 10th International Conference on Knowledge Management and Information Sharing
68

stomers. Although the leaf nodes (i.e. actual indus-
tries) in this branch are very diverse – including e.g.
both architects and software development – they have
in common that they need to manage large customer
projects and accordingly keep track of similar project-
related KPIs and dimensions.
To incorporate the taxonomic knowledge, we
identified two alternatives:
1. Treat the taxonomy tree as a graph and simply add
it to the case base graphs. In Section 5, we will
use the term plain-taxonomy to refer to evalua-
tion runs using this strategy
2. Derive explicit pairwise similarities between in-
dustries and build a graph where each leaf node
is connected to each other leaf node via a weig-
hted edge, where the weight reflects the simila-
rity. The edge weights need to be used within
the random walk. In Section 5, evaluation runs
with this strategy will be referred to using the term
leaf-similarity.
In order to derive the pairwise similarities for the
leaf-similarity strategy, we propose to follow the ap-
proach of (Bergmann, 2002, p. 111). Its rationale
is that taxonomy branches can have a different depth
and that not all pairs of nodes that have the same
distance from each other are equally (dis-)similar.
Instead, Bergmann argues that similarity should be
based on the most specific common parent of two
(leaf) nodes and that a similarity value can be deter-
mined for each inner node to determine this. In Figure
3, the numbers in brackets have been set manually –
involving again human knowledge – to reflect this: as
an example, two nodes whose closest common parent
is node “2 Service-oriented” have a similarity of only
0.3, whereas if both nodes fall under “2.1 project-
oriented”, their similarity is 0.7. Using this additio-
nal knowledge, we were able to compute a complete
graph of industry leaf nodes, with edges representing
their pairwise taxonomic similarities. This complete
graph was then added to the case base graphs.
4.3.2 Associative Knowledge
KPI / dimension clusters should represent the consul-
tants’ knowledge about which KPIs and dimensions
belong together very closely from a business point of
view. Again, knowledge about close associations be-
tween items is an important and widespread form of
knowledge that plays an important role in many dom-
ains. However, constructing such clusters completely
manually is a very tedious task.
Therefore, we supported the consultants in cluster
construction via two automated “pre-analyses” whose
results were then manually checked and cleaned by
the consultants:
• Statistical clustering: we performed a statistical
analysis of KPI/dimension co-occurrence within
the case base. This was based on a signifi-
cance measure suited for non-normal distribution
of occurrences (Dunning, 1994) and a subsequent
graph clustering (Biemann, 2006). It resulted in
30 clusters of KPIs/dimensions that were accep-
ted by the consultants.
• Linguistic clustering: we grouped KPIs / dimen-
sions by analysing their names and forming clus-
ters of elements that contained the same terms.
Since KPI / dimension names were in German,
we additionally split compounds. This resulted
in roughly 200 clusters accepted by consultants.
Rejected clusters were mostly found inappropri-
ate because their common term was too generic to
imply a close similarity between the cluster mem-
bers.
As mentioned in Section 4.1, there are two opti-
ons to incorporate clusters into the recommendation
process:
• Introduce additional edges between all members
of a cluster
• Re-rank: use the original case base graphs, run the
random walk and then re-rank the results – whene-
ver a member n of a cluster appears in the ranking,
we boost all other cluster members to the position
directly after n, in the order of their original sco-
res.
This leads to six strategies to be evalua-
ted in Section 5: add-edges/linguistic, add-
edges/statistical, add-edges/all, re-rank/linguistic,
re-rank/statistical and re-rank/all where, in each
case, the first part refers to the incorporation and the
second part to the representation strategy and “all” re-
fers to the combination of both statistically and lin-
guistically derived clusters.
5 EVALUATION
5.1 Experimental Setup
As explained in Section 3, we used the case base of
our partner company to compare the effectiveness of
the knowledge representation and incorporation stra-
tegies described in the previous section.
Each strategy was tested via a leave-one-out eva-
luation, i.e. it was applied to each combination of cu-
stomer and process in the case base, where the corre-
Random Walks on Human Knowledge: Incorporating Human Knowledge into Data-Driven Recommenders
69

sponding data about that case was not used for buil-
ding the case base graph.
As mentioned in Section 4.2, queries were con-
structed either only from the industry of the customer
(simple queries) or by adding a few KPIs/dimensions
(verbose queries). More precisely, for a case C, a
verbose query was constructed by sorting C’s KPIs /
dimensions alphabetically and then picking every se-
cond element from the start of that ordered list until
5% of C’s elements were included in the query.
After each run, we measured mean average preci-
sion (MAP) (Voorhees and Harman, 2006) of the re-
turned ranking, treating those KPIs / dimensions as
relevant that the customer had chosen and installed.
Whenever we compared runs (e.g. against a base-
line), we used the Wilcoxon signed rank test to de-
termine whether MAP differences were statistically
significant. We used the Wilcoxon test because MAP
values were not normally distributed and hence a t-
test was not applicable.
As mentioned before, our partner company has a
catalog of diagrams (and associated KPIs and dimen-
sions) that is offered to each customer. The whole
set of KPIs and dimension present in the case base
is, however, much larger than what the catalog con-
tains. One can say that the catalog represents the
“standard” (which the company is able to deliver very
fast and cheaply), but custom KPIs and dimensions
can also be added. One can observe that some cases
use almost exclusively standard elements, whereas ot-
her cases contain almost no standard elements. For
companies who are interested in “the standard solu-
tion”, a recommender is likely to be rather useless.
We verified this in a pre-test by running the Page-
Rank with priors algorithm with different values of
α (where a high α indicates a strong bias towards
the query and hence a higher degree of personalisa-
tion/customisation) and comparing the average preci-
sion values. Figure 4 shows how this affects standard
and non-standard cases differently: on the x-axis, we
show the degree of standardisation of a case (percen-
tage of standard elements). The y-axis indicates the
difference in average precision between a customised
(α = 0.9) and a more standard (α = 0.1) PageRank
run. We can see that for heavily standardised cases
(where the ratio is > 0.5), the difference is strongly
negative in many cases – indicating that customisa-
tion is harmful in these cases.
In the remainder of the evaluation, we only eva-
luated results for cases with less than 50% standard
elements (although the case base graph is still built
from all cases, thus introducing a certain bias towards
standard elements). We made this choice because we
could see from Figure 4 that customised recommen-
Figure 4: Difference between personalised and standard re-
commendations plotted against the degree of standardisa-
tion of a case.
dations can be harmful for more standard cases. A so-
lution to fit all needs in the final consultancy process
could be to offer two sections – one with standardi-
sed recommendations (the catalog) and one where the
customer can obtain customised recommendations.
5.2 Results and Discussion
We first explored the use of taxonomic knowledge:
we compared the results with the original case base
graph (baseline) to either adding the whole taxonomy
tree of industries to the graph (plain-taxonomy) or
computing pairwise taxonomic similarities of indus-
tries and adding weighted edges between all indus-
tries to the graph (leaf-similarity), see Section 4.3.1.
The results are shown in Table 2. We indicate (also la-
ter) statistically significant differences between a run
and the baseline with bold font.
Table 2: MAP values for the two strategies of represen-
ting/incorporating the industry taxonomy.
Queries no taxo-
nomy
plain-
taxonomy
leaf-
similarity
simple 0.247 0.249 0.246
verbose 0.260 0.269 0.263
We can see that there are no statistically signifi-
cant differences whatsoever. We verified that there
are 20 out of 48 cases in our case base that have a sin-
gular industry, i.e. there are no other cases with the
same industry. For these cases, simple queries are not
connected to the graph, i.e. the recommender reverts
to a standard PageRank without priors when no taxo-
nomy is used. But even for these cases, we could not
observe a consistent improvement through the use of
the taxonomy (i.e. by using information from similar
industries). There is also no consistent finding as to
which strategy performs better.
Next, we evaluated the use of associative know-
ledge. Table 3 shows the results, where again signifi-
KMIS 2018 - 10th International Conference on Knowledge Management and Information Sharing
70

Table 3: MAP values for strategies of using associative knowledge (KPI / dimension clusters).
Queries Baseline add-edges re-rank
stat. ling. all stat. ling. all
simple 0.247 0.277 0.269 0.297 0.282 0.244 0.281
verbose 0.260 0.316 0.282 0.346 0.331 0.250 0.334
cant differences from the baseline are indicated with
bold font. The best strategy for each query type is
additionally marked in italics.
This time, we observe several significant and so-
metimes also quite substantial improvements over the
baseline. Generally, statistically derived clusters per-
form better than linguistically derived ones. For add-
edges, the combination of all clusters performs best.
Since add-edges delivers more stable and often larger
improvements than re-ranking, we may conclude that
using add-edges with all (i.e. both linguistic and sta-
tistical) clusters is one of the best strategies. For these,
we have a relative improvement of 20% for simple
queries and 33% for verbose queries over the base-
line.
6 CONCLUSIONS
In this work, we have investigated strategies for repre-
senting and incorporating explicit human knowledge
into data-driven recommenders. As a robust and ea-
sily extendable basis, we chose an approach that is
based on graph-based data representation in combi-
nation with biased random walks. Using a graph as
a representation form allows us to flexibly add vari-
ous forms of human knowledge, e.g. taxonomic or
associative knowledge. We exemplified these types
of knowledge in the form of an industry taxonomy
and business-driven associations between KPIs and
dimensions, respectively, in our business intelligence
consultancy scenario and tested some variants of stra-
tegies on a real data set.
Our results indicate that the use of taxonomic kno-
wledge does not lead to a consistent improvement. In
contrast, associative knowledge can increase the ef-
fectiveness of recommendations substantially and sig-
nificantly. The best strategy that emerged was to add
edges between associated elements directly into the
case base graph.
In the future, one could explore further strategies:
for instance, the use of explicit similarity, combined
with a threshold could help to construct a k-nearest
neighbour graph before running the random walks,
i.e. a graph that contains only the most similar cases
w.r.t. the current query. This might help to further re-
duce the noise – while bearing the risk of losing some
relevant recommendations.
Lastly, instead of a leave-one-out evaluation on
a given case base, it could be interesting to obtain a
more detailed and qualitative feedback from humans
by presenting recommendations for new cases and
obtaining non-binary feedback on these recommen-
dations.
REFERENCES
Aha, D. W., Breslow, L. A., and Mu
˜
noz-Avila, H. (2001).
Conversational case-based reasoning. Applied Intelli-
gence, 14(1):9–32.
Bergmann, R. (1998). On the use of taxonomies for repre-
senting case features and local similarity measures.
Bergmann, R. (2002). Experience management: founda-
tions, development methodology, and internet-based
applications. Springer-Verlag.
Biemann, C. (2006). Chinese whispers: an efficient graph
clustering algorithm and its application to natural lan-
guage processing problems. In Proceedings of the first
workshop on graph based methods for natural lan-
guage processing, pages 73–80. Association for Com-
putational Linguistics.
Blanco-Fern
´
andez, Y., Pazos-Arias, J. J., Gil-Solla, A.,
Ramos-Cabrer, M., L
´
opez-Nores, M., Garc
´
ıa-Duque,
J., Fern
´
andez-Vilas, A., D
´
ıaz-Redondo, R. P., and
Bermejo-Mu
˜
noz, J. (2008). A flexible semantic infe-
rence methodology to reason about user preferences in
knowledge-based recommender systems. Knowledge-
Based Systems, 21(4):305–320.
Bobadilla, J., Ortega, F., Hernando, A., and Guti
´
errez, A.
(2013). Recommender systems survey. Knowledge-
based systems, 46:109–132.
Bogers, T. (2010). Movie recommendation using random
walks over the contextual graph. In Proc. of the 2nd
Intl. Workshop on Context-Aware Recommender Sys-
tems.
Bridge, D., G
¨
oker, M. H., McGinty, L., and Smyth, B.
(2005). Case-based recommender systems. The Kno-
wledge Engineering Review, 20(3):315–320.
Brijs, T., Swinnen, G., Vanhoof, K., and Wets, G. (2004).
Building an Association Rules Framework to Improve
Product Assortment Decisions. Data Mining and Kno-
wledge Discovery, 8(1):7–23.
Burke, R. (1999). Integrating knowledge-based and
collaborative-filtering recommender systems. In Pro-
ceedings of the Workshop on AI and Electronic Com-
merce, pages 69–72.
Burke, R. (2000). A case-based reasoning approach to col-
laborative filtering. In European Workshop on Advan-
ces in Case-Based Reasoning, pages 370–379. Sprin-
ger.
Random Walks on Human Knowledge: Incorporating Human Knowledge into Data-Driven Recommenders
71

Carrer-Neto, W., Hern
´
andez-Alcaraz, M. L., Valencia-
Garc
´
ıa, R., and Garc
´
ıa-S
´
anchez, F. (2012). Social
knowledge-based recommender system. application to
the movies domain. Expert Systems with applications,
39(12):10990–11000.
Cunningham, P. (2009). A taxonomy of similarity mecha-
nisms for case-based reasoning. IEEE Transactions
on Knowledge and Data Engineering, 21(11):1532–
1543.
Dunning, T. (1994). Accurate Methods for the Statistics of
Surprise and Coincidence. Computational Linguistics,
19(1):61–74.
Felfernig, A. and Burke, R. (2008). Constraint-based re-
commender systems: technologies and research is-
sues. In Proceedings of the 10th international con-
ference on Electronic commerce, page 3. ACM.
Fouss, F., Pirotte, A., Renders, J.-M., and Saerens, M.
(2007). Random-Walk Computation of Similarities
Between Nodes of a Graph with Application to Col-
laborative Recommendation. IEEE Transactions on
Knowledge and Data Engineering, 19(3):355–369.
Huang, Z., Chung, W., Ong, T.-H., and Chen, H. (2002).
A Graph-based Recommender System for Digital Li-
brary. In Proceedings of the 2Nd ACM/IEEE-CS Joint
Conference on Digital Libraries, pages 65–73.
Jannach, D. (2009). Fast computation of query relaxations
for knowledge-based recommenders. Ai Communica-
tions, 22(4):235–248.
Middleton, S. E., Shadbolt, N. R., and De Roure, D. C.
(2004). Ontological user profiling in recommender
systems. ACM Transactions on Information Systems
(TOIS), 22(1):54–88.
Minkov, E., Kahanov, K., and Kuflik, T. (2017). Graph-
based recommendation integrating rating history and
domain knowledge: Application to on-site guidance
of museum visitors. Journal of the Association for In-
formation Science and Technology, 68(8):1911–1924.
Nt, J. A. R., Tomaz, L. F. C., De Souza, J. M., and Xex
´
eo,
G. (2013). Bringing knowledge into recommender sy-
stems. Journal of systems and software, 86(7):1751–
1758.
Papadimitriou, A., Symeonidis, P., and Manolopoulos, Y.
(2012). A generalized taxonomy of explanations sty-
les for traditional and social recommender systems.
Data Mining and Knowledge Discovery, 24(3):555–
583.
Ricci, F. and Nguyen, Q. N. (2007). Acquiring and revising
preferences in a critique-based mobile recommender
system. IEEE Intelligent systems, 22(3).
Schafer, J. B., Frankowski, D., Herlocker, J., and Sen, S.
(2007). Collaborative filtering recommender systems.
In The adaptive web, pages 291–324. Springer.
Tarus, J. K., Niu, Z., and Mustafa, G. (2017). Knowledge-
based recommendation: a review of ontology-based
recommender systems for e-learning. Artificial Intel-
ligence Review, pages 1–28.
Tudhope, D., Alani, H., and Jones, C. (2001). Augmenting
thesaurus relationships: possibilities for retrieval. The
Journal of Digital Information, 1(8).
Van Meteren, R. and Van Someren, M. (2000). Using
content-based filtering for recommendation. In Pro-
ceedings of the Machine Learning in the New Infor-
mation Age: MLnet/ECML2000 Workshop, pages 47–
56.
Voorhees, E. M. (1994). Query expansion using lexical-
semantic relations. In Proceedings of the 17th an-
nual international ACM SIGIR conference on Rese-
arch and development in information retrieval, pages
61–69. Springer-Verlag New York, Inc.
Voorhees, E. M. and Harman, D. K. (2006). TREC – Expe-
riment and Evaluation in Information Retrieval. The
MIT press, Cambridge, Massachusetts.
White, S. and Smyth, P. (2003). Algorithms for Estimating
Relative Importance in Networks. In Proceedings of
the Ninth ACM SIGKDD International Conference on
Knowledge Discovery and Data Mining, pages 266–
275.
Witschel, H. F., Galie, E., and Riesen, K. (2015). A Graph-
Based Recommender for Enhancing the Assortment
of Web Shops. In Proceedings of Workshop on Data
Mining in Marketing DMM’2015.
Yeomans, M., Shah, A. K., Mullainathan, S., and Klein-
berg, J. (2017). Making sense of recommendations.
Management Science.
Zhang, Z., Zeng, D. D., Abbasi, A., Peng, J., and Zheng, X.
(2013). A random walk model for item recommenda-
tion in social tagging systems. ACM Transactions on
Management Information Systems (TMIS), 4(2):8.
KMIS 2018 - 10th International Conference on Knowledge Management and Information Sharing
72
