
Inter-session Test-retest Reliability of the Quantified Y Balance Test
William Johnston
1,2
, Martin O’Reilly
1,2
, Garrett F. Coughlan
3
and Brian Caulfield
1,2
1
Insight Centre for Data Analytics, University College Dublin, Dublin, Ireland
2
School of Public Health, Physiotherapy and Sport Science, University College Dublin, Dublin, Ireland
3
Connacht Rugby, The Sportsgrounds, College Road, Galway, Ireland
Keywords: Dynamic Balance, Digital Biomarker, Inertial Sensor, Y Balance Test, Reliability, Inter-session.
Abstract: The Y Balance test is the most common dynamic balance assessment used in clinical practice and research.
However, the traditional measure of performance, the reach distance, fails to provide detailed information
pertaining to the control of balance during the reach task. Recent research has demonstrated that a single
wearable inertial sensor can capture detailed information pertaining to balance performance during the Y
balance test, not captured by the traditional reach distances. To date, no research has been conducted
investigating the inter-session test-retest reliability of the inertial sensor instrumented YBT. Thirty -two young
healthy adults, aged between 18-40 were recruited as part of this study. Participants completed the quantified
YBT protocol during two testing sessions, separated by 7-10 days. The findings from this study demonstrated
that 26/36 (anterior), 31/36 (posteromedial) and 33/36 (posterolateral) quantified variables demonstrated
good-excellent intra-session test-retest reliability. These findings suggest that the inertial sensor quantified
YBT can provide a reliable measure of dynamic balance performance. Further research is required to
investigate the capability of the quantified YBT to identify individuals at risk of injury/ disease and track
recovery/ response to intervention.
1 INTRODUCTION
The Y Balance Test (YBT) is one of the most
commonly utilised clinical dynamic balance
assessment tools (Gribble et al., 2012). It provides a
valid and reliable measure of balance performance,
requiring the individual to maintain their balance
while completing a maximal reach in three prescribed
directions; anterior (ANT), posteromedial (PM) and
posterolateral (PL). Traditionally, the test is scored by
manually measuring the distance the individual
reaches outside of their base of support (Plisky et al.,
2009). The reach distance is then typically normalised
to the individuals leg length to allow for appropriate
comparison between individuals, and between
dominant and non-dominant legs (Gribble et al.,
2012). A large body of evidence has evolved
demonstrating the utility of the YBT as an outcome
measure following injury, identifying differences in
performance between control and pathological
groups with conditions such as lateral ankle sprains
(Doherty et al., 2015), chronic ankle instability
(Holden et al., 2016) and anterior cruciate ligament
injury’s (Herrington et al., 2009). Furthermore,
previous research has demonstrated the role of the
YBT in ankle injury risk-factor screening (Plisky et
al., 2006, Smith et al., 2015).
While the traditional analogue measure obtained
from the YBT provides a measure of the distance
reached outside of the base of support, it fails to
provide quantifiable information relating to the
control of balance, or the strategy implemented
during the task. As such, individuals must rely on
subjective observations of the individual’s control or
use expensive laboratory-based force platform and
camera-based motion-capture systems that require a
high level of expertise.
Advances in mobile technology have allowed for
the development of wearable inertial sensor based
digital biomarkers of motor function. These
assessments range from static balance assessments
such as the balance error scoring system, to dynamic
gait assessments such as the timed up and go (Greene
et al., 2017, Weiss et al., 2014, Heldman et al., 2017,
Alberts et al., 2015). Recent research has established
that an inertial sensor worn on the lumbar spine can
provide a sensitive measure of balance performance,
capturing subtle alterations, not captured by the
traditional reach distances alone (Johnston et al.,
2016, Johnston et al., 2017b). These findings suggest
Johnston, W., O’Reilly, M., Coughlan, G. and Caulfield, B.
Inter-session Test-retest Reliability of the Quantified Y Balance Test.
DOI: 10.5220/0006958300630070
In Proceedings of the 6th International Congress on Sport Sciences Research and Technology Suppor t (icSPORTS 2018), pages 63-70
ISBN: 978-989-758-325-4
Copyright © 2018 by SCITEPRESS – Science and Technology Publications, Lda. All rights reserved
63

that the quantified YBT may have value in providing
a more sensitive measure of injury/disease-risk and
recovery, across a range of clinical populations
(Johnston et al., 2017b).
Prior to the deployment of quantified YBT in a
clinical setting, it is necessary to investigate the
reliability of the inertial sensor derived variables.
Doing so will allow for the identification of the most
valuable and clinically applicable variables for
quantifying balance performance. Previous research
has demonstrated the excellent intra-session test-
retest reliability of the 95% ellipsoid volume variable
derived from the inertial sensor during the YBT (ICC
= 0.76-0.92). However, no research has investigated
the inter-session test-retest reliability of the
quantified YBT or established the relationship
between the quantified variables and the traditional
reach distances.
As such, the aim of this research is to determine
the intersession test-retest reliability of inertial sensor
derived measures of YBT performance. It is
hypothesised that the inertial sensor derived variables
will demonstrate good-excellent levels of inter-
session test-retest reliability.
2 METHODS
2.1 Participants
Thirty-two young healthy adults aged between 18-40
were recruited from the wider university population
(sex: 14 females, 18 males; age: 28 ± 5 years; height:
164 ± 37 cm; weight: 73 ± 26 kg; right leg length: 93
± 7 cm). Participants were considered eligible for this
study if they were a young healthy adult, aged
between 18-40 years. Participants were excluded if
they reported any vestibular, visual, neurological or
musculoskeletal impairment that may influence their
balance. Ethical approval was sought and obtained
from the University human research ethics
committee, and all participants provided informed
consent prior to participating in the study. All
participants read the information leaflet and were
informed of their right to withdraw from the study at
any point.
2.2 Measures
2.2.1 YBT
The YBT is an instrumented alternative to the star
excursion balance test (SEBT), designed to provide a
measure of dynamic balance performance. The YBT
leverages three of the eight original SEBT reach
directions (ANT, PM, PL) and provides a valid and
reliable measure of dynamic balance capability
(Plisky et al., 2009). Previous research has
demonstrated excellent intra-session test-retest
reliability (ICC = 0.85 - 0.88) and inter-tester
reliability (ICC = 0.99 - 1.00) of the YBT testing
apparatus (Plisky et al., 2009). The YBT requires an
individual to stand on one leg, place their hands on
their hips, and slide a block as far as possible in the
three discrete directions using their toe, while
maintaining their balance equilibrium (figure 1). The
maximal distance of the reach is then recorded.
Individuals are required to repeat the reach direction
if they (1) use the block for support, (2) remove one
or both hands from their hips, (3) kick the block
forward for extra distance, (4) make contact with the
ground or (5) raise the heel of the stance leg from the
platform.
2.2.2 Inertial Sensor
A single Shimmer3 (Shimmer, Dublin, Ireland)
inertial sensor was mounted at the level of the fourth
lumbar vertebra. The Shimmer3 consists of a tri-axial
accelerometer, gyroscope and magnetometer. It was
connected via Bluetooth to an Android tablet (Galaxy
Tab 2, Samsung), operating a custom developed
mobile application. The inertial sensor was calibrated
and configured to stream tri-axial accelerometer (± 2
g), tri-axial gyroscope (±500 ◦/s) and tri-axial
magnetometer (±1.9 gauss) data at sampling
frequency of 51.2 Hz. These data acquisition
parameters were chosen based on previous research
carried out related to the use of inertial sensors in the
quantification of the YBT (Johnston et al., 2017b,
Johnston et al., 2017a).
2.3 Testing Protocol
Participants were recruited to attend two 20-minute
testing sessions conducted in a University
biomechanics laboratory, separated by 7-10 days.
Throughout the remainder of the paper the two testing
points are referred to as week 1 (testing day 1) and
week 2 (testing day 2). On arrival to the laboratory for
the week 1 assessment, the testing protocol was
explained, and participant demographic information
was obtained. Leg dominance was determined by
asking participants which leg they would use to kick
a ball (Wilkins et al., 2004). Leg length was found by
measuring the distance from the anterior iliac spine to
the inferior border of the medial malleolus. All leg
length measurements were completed by a single
icSPORTS 2018 - 6th International Congress on Sport Sciences Research and Technology Support
64
Chartered Physiotherapist to ensure measurement
consistency.
During both testing sessions (week 1 and week 2),
participants completed 4 practice trials in each
direction, bilaterally, as per the YBT guidelines
developed by Gribble and colleagues (2012).
Following the practice trials, a single inertial sensor
was mounted at the level of the fourth lumbar
vertebrae, in line with the top of the iliac crest. This
location was chosen as the region between L3-L5 is
reported to closely match estimates of the body’s
centre of mass acceleration (Moe-Nilssen, 1998,
Zijlstra and Hof, 2003), and allow for easy and
repeatable placement of the sensor. The inertial
sensor was mounted using a custom-made elastic and
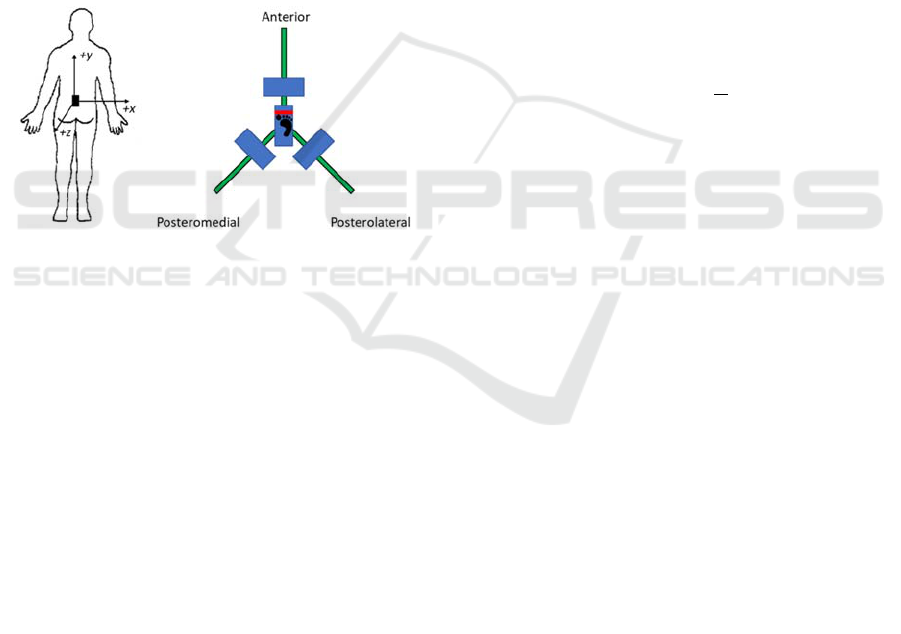
Velcro belt. Figure 1 illustrates the sensor mounting
location, orientation and the three reach directions of
the YBT.
Figure 1: illustrates the sensor mounting location, axis
orientation and YBT reach directions during right leg
stance.
Participants completed three recorded YBTs in
each direction (randomised order) on their right leg.
If a participant failed to complete a reach attempt
according to the criteria outlined in section 2.2.1, that
reach was discarded and repeated. Traditional YBT
reach distances were obtained by recording the
maximal reach distance, while the inertial sensor data
was capture for the period that the participant was in
unilateral stance. YBT reach distances and inertial
sensor data was recorded locally, and processed
offline using MATLAB (2017b, Mathworks,
Natwick, USA).
2.4 Data Processing
The analogue reach distances obtained during the
assessment were normalised against the participants
leg length using the following formula:
/
100
(1)
Nine signals were obtained from the inertial sensor;
accelerometer (accel) x, y, z, gyroscope (gyro) x, y, z
and magnetometer x, y, z. Ten additional signals were
then calculated. The 3-D orientation of the inertial
sensor was computed using the gradient descent
algorithm developed by Madgwick et al., (2011). The
resulting w, x, y and z quaternion values were then
converted to pitch, roll and yaw. The magnitude
(mag) of the accel and gyro signals were computed
using the vector magnitude of the accel x, y, z and
gyro x, y, z, respectively. Finally, the angular
acceleration was obtained by computing the first
derivative of the gyroscope y signal.
For each relevant collected and derived sensor
signal, the root-mean-square (RMS), variance and
range variables were computed with the standard
Matlab ‘rms’, ‘var’ and ‘range’ functions
respectively. The sample-entropy (sEN) was
computed for each signal of length
N=(x_1,x_2,x_3,…,x_N ) according to the following
formula:
log
(2)
A was the number of template vector pairs having a
Chebyshev distance
,
< r of
length m+1 and B was the number of template vectors
pairs having
,
< r of length m, where
the embedding dimension, m, was equal to 2 and the
tolerance, r, was equal to 0.1. The template vectors
were defined such that
,
,
,……,
. The area under the
curve of the fast-fourier transform (FFT) was found
for each relevant signal by first using the Matlab ‘fft’
function (Matlab, 2018b) to derive a power-frequency
plot and then using the ‘cumsum’ function to find the
area under the curve (AUC) (Matlab, 2018a). 95%
ellipsoid volume of sway (95EV) was computed
using the following formula:
95 4πabc/3 (3)
Whereby, ‘a’ and ‘b’ are the linear acceleration in the
medio-lateral axis (accelerometer x) and anterio-
posterior axis (accelerometer z) and c was transverse
plane rotational acceleration (first derivative of
gyroscope y) (Johnston et al., 2017b).
2.5 Statistical Analysis
Descriptive statistics (means and standard deviations)
were used to describe the population and traditional
and inertial sensor YBT scores. The average of the
three trials for each reach direction was calculated for
the reach distance and inertial sensor derived
Inter-session Test-retest Reliability of the Quantified Y Balance Test
65

variables. This was completed to ensure measurement
reliability (Gribble et al., 2012). A 2-way random
effects, absolute agreement model of intraclass
correlation coefficient (ICC 2, k) was employed to
investigate the inter-session test-retest reliability of
the traditional and inertial sensor instrumented
measures of YBT performance. The ICCs were
calculated leveraging the mean of the three trials from
the week 1 and week 2 assessment points. The
guidelines for interpretation outlined by Cicchetti and
Sparrow (1981) were used for interpretation: <0.40
(poor reliability), 0.40–0.59 (fair reliability), 0.60–
0.74 (good reliability), and 0.75–1.00 (excellent
reliability).
3 RESULTS
Tables 1 presents the descriptive statistics for the
YBT variables, while table 2 summarises the inter-
session test-retest reliability scores for the ANT, PM
and PL reach directions. When considering the
traditional reach distances scores, it was observed that
the ANT reach direction possessed excellent
reliability, while the PM and PL directions possessed
good reliability. Twelve of the 36 ANT direction
inertial sensor derived variables demonstrated
excellent reliability, 14 demonstrated good reliability,
7 possessed fair reliability, while a further 3 had poor
reliability. Secondly, 14 of the 36 PM reach direction
inertial sensor variables demonstrated excellent
reliability, 17 had good reliability, 3 had fair
reliability, while 2 had poor reliability. Finally, 19 PL
reach direction inertial sensor derived variables
demonstrated excellent reliability, 14 had good
reliability, 2 possessed fair reliability, while 1 had
poor reliability.
4 DISCUSSION
The primary aim of this study was to determine the
inter-session test-retest reliability of the inertial
sensor derived measures of balance performance,
captured during the YBT. The findings of this
laboratory study indicate that the quantified YBT can
provide a reliable measure of balance performance,
laying the groundwork for its future use in clinical
practice.
The traditional analogue reach distances
demonstrated excellent test-retest reliability for the
ANT reach direction (ICC = 0.92) and good reliability
for the PM (ICC 0.74) and PL (ICC = 0.72) reach
directions. Previous research has demonstrated the
excellent test-retest reliability (ICC = 0.85-0.93) of
the YBT reach distances over a 48-hour period, using
multiple raters (Shaffer et al., 2013). To the best of
the authors’ knowledge, this is the first study to
present inter-session test-retest reliability of the YBT
reach directions, using a single rater. While the
reliability results for the PM and PL reach directions
presented in this study are lower than that of Shaffer
and colleagues (Shaffer et al., 2013), the time frame
between testing time-points is significantly shorter
(48-hours) than that used in this study (1 week). This
longer follow-up period would likely increase the
amount of within-subject variance between testing
points, potentially explaining the lower ICC scores
for the PM and PL reach directions.
When comparing the inertial sensor derived
variables and the traditional YBT reach distances, 12
ANT variables demonstrated excellent test-retest
reliability (ICC > 0.75), comparable to the reliability
of the traditional reach distance (Table 2).
Importantly, when considering the PM and PL reach
directions, 14 (PM) and 19 (PL) inertial sensor
variables demonstrated excellent test-retest
reliability, superior to the good reliability
demonstrated by the traditional analogue reach
distances. This is of note as the YBT is the current
clinical standard in dynamic balance assessment,
specifically used as an objective outcome measure in
sports medicine populations (Smith et al., 2015,
Plisky et al., 2006, Gribble et al., 2012). Importantly,
the results presented in this reliability study
demonstrate that the inertial sensor quantified YBT
can provide a comparable level of measurement
reliability for the ANT reach direction, and superior
reliability for the PM and PL reach directions.
Furthermore, these 45 quantified variables with
excellent reliability are capable of quantifying
different aspects of balance control and strategy
leveraged by an individual during the YBT, allowing
clinicians and researchers to capture detailed
biomechanical information pertaining to balance
performance during the YBT, outside of the
laboratory setting.
Four variables, gyro x RMS, gyro y AUC FFT,
gyro mag RMS and gyro mag AUC FFT, consistently
provided excellent reliability across all three reach
directions. However, when considering the PM and
PL reach directions alone, it was seen that 11 of the
same inertial sensor derived variables possessed
excellent levels of test-retest reliability. One possible
explanation for the high level of consistency between
the PM and PL directions, when compared with the
ANT direction, is the different movement strategies.
icSPORTS 2018 - 6th International Congress on Sport Sciences Research and Technology Support
66

Table 1: Mean (SD) for the different YBT variables for the two testing time points.
ANT PM PL
Week1 Week2 Week1 Week2 Week1 Week2
ReachDistance 56.8(5.2) 56.5(5.4) 99.7(7.3) 100.4(7.3) 97.7(7) 98.9(7.8)
95EV 365.8(399.7) 380.0(354.3) 369.6(295.4) 459.3(452.3) 504.9(482.9) 485.8(440.9)
GyroX
RMS 7.08(3.3) 6.3(2.4) 17.4(4.9) 18.2(5.5) 17.3(5.4) 18.2(6.2)
SEn 1.4(0.4) 1.4(0.4) 0.5(0.2) 0.5(0.2) 0.5(0.2) 0.5(0.2)
AUCFFT 19.9(7.6) 18.8(6.3) 27.5(11.1) 28.1(10.8)
27.2(11) 27.1(10.5)
Variance 61.4(65.4) 45.1(38.7) 331.6(187) 363204.3 332.2(198.2) 372.5(233.9)
GyroY
RMS 11.3(3.8) 11.5(4.2) 8.9(2.5) 9.2(2.9) 10.6(4.1) 10.5(3.5)
SEn 1.0(0.3) 0.9(0.3) 1.2(0.3) 1.1(0.3) 1.1(0.3) 1(0.3)
AUCFFT 27.0(10.3) 27(10)
22.7(8.5) 22.8(8.4) 25.3(10.8) 25.4(9.7)
Variance 143.4(97.2) 150.8(107.2) 86.2(51.6) 92.1(59.7) 124.4(92.1) 120.9(78.4)
GyroZ
RMS 5.3(2.0) 4.8(1.7) 6.8(2.6) 6.8(2.1) 10.4(2.6) 10.2(2.9)
SEn 1.4(0.3) 1.5(0.3) 1.2(0.3) 1.1(0.3) 0.8(0.2) 0.8(0.3)
AUCFFT
16.9(6.3) 16(5.5) 17.3(6.9) 16.7(5.7) 19.9(7.8) 18.7(6.9)
Variance 33.4(24.0) 26.1(17.7) 54.3(46.6) 51.7(33.8) 114.2(56.1) 112.1(63.3)
GyroMag
RMS 14.7(4.7) 14.2(4.5) 20.9(5.5) 21.7(5.9) 23.1(6.5) 23.6(7.1)
SEn 1.2(0.3) 1.2(0.3) 0.8(0.2) 0.7(0.2) 0.8
(0.3) 0.7(0.3)
AUCFFT 25.4(9.2) 25.2(9.3) 26.9(10.4) 27.7(9.9) 28.2(10.6) 29.3(11.1)
Variance 79.5(50.6) 74(48.6) 152.8(87) 172.3(88.6) 198.6(115.1) 228.1(152.4)
AccelX
RMS 0.9(0.7) 1.9(3.2) 1.2(0.5) 2.5(3.3) 2.1(0.6) 2.9(2.1)
SEn 1.5(0.3) 1.5(0.4) 1.6
(0.4) 1.5(0.3) 0.8(0.2) 0.8(0.2)
AUCFFT 1.9(0.7) 2.2(1.2) 1.6(0.5) 2(1) 2.4(0.8) 2.6(1)
Variance 0.4(0.3) 0.4(0.3) 0.4(0.3) 0.4(0.2) 2.1(0.8) 2.1(0.9)
AccelY
RMS 9.3(0.4) 11.2(4.8) 7.5(0.8) 9.5(5.5) 7.2(0.9) 9.2(5.6)
SEn
1.3(0.4) 1.7(0.3) 0.7(0.3) 0.9(0.6) 0.6(0.3) 0.7(0.6)
AUCFFT 3.4(1.0) 4.1(2) 3.1(0.9) 3.3(1.1) 3.1(0.9) 3.2(1.1)
Variance 0.2(0.1) 0.3(0.4) 2.5(1.5) 2.2(1.6) 3.2(2.2) 3(2.4)
AccelZ
RMS 3.1(1.1) 2.7(1.3) 6.3(1) 6.1(1) 6.4
(1) 6.3(0.9)
SEn 1.3(0.4) 1.4(0.5) 0.5(0.1) 0.4(0.1) 0.6(0.2) 0.5(0.2)
AUCFFT 2.3(0.8) 2.1(0.8) 3.5(1.1) 3.4(0.9) 3.2(1) 3.2(1)
Variance 0.6(0.8) 0.5(0.5) 4(1.6) 4.3(1.5) 3.1(1.5) 3.4(1.7)
AccelMag
RMS 9.9(0.2) 11.9(5.4)
9.9(0) 12(5.6) 9.9(0) 11.9(5.3)
SEn 1.8(0.3) 1.8(0.4) 2(0.3) 1.8(0.4) 1.9(0.3) 1.8(0.4)
AUCFFT 3.5(1.0) 4.1(1.7) 3(1) 3.3(1.6) 2.8(1) 3(1.4)
Variance 0.2(0.1) 0.2(0.2) 0.1(0.1) 0.1(0.1) 0.1(0.1) 0.1(0.1)
Pitch Range 13.1
(5.7) 10.9(4.7) 39.9(8) 40.7(7.5) 44.9(12) 46.3(13.3)
Roll Range 10.6(4.8) 8.7(3.5) 15.4(3.7) 16.5(5.6) 19.7(4.8) 18.3(4.5)
Yaw Range 19.6(6.8) 19.1(6.6) 22.7(6) 21.1(7.6) 26.7(5.6) 27.4(7.3)
Inter-session Test-retest Reliability of the Quantified Y Balance Test
67

Table 2: ICC and 95% CI for the traditional and inertial sensor derived YBT variables.
ANT PM PL
ICC LB UB ICC LB UB ICC LB UB
Reach Distance 0.92 0.84 0.96 0.74 0.54 0.87 0.72 0.50 0.85
95EV 0.62 0.33 0.80 0.86 0.71 0.93 0.73 0.51 0.86
Gyro X
RMS 0.76 0.54 0.88 0.82 0.66 0.91 0.78 0.59 0.88
SEn 0.82 0.66 0.91 0.64 0.36 0.81 0.71 0.44 0.85
AUC FFT 0.74 0.54 0.86 0.81 0.64 0.90 0.81 0.65 0.90
Variance 0.70 0.45 0.84 0.80 0.63 0.90 0.75 0.55 0.87
Gyro Y
RMS 0.86 0.72 0.93 0.67 0.42 0.82 0.79 0.60 0.89
SEn 0.80 0.62 0.90 0.65 0.40 0.81 0.78 0.58 0.89
AUC FFT 0.76 0.56 0.88 0.82 0.67 0.91 0.79 0.60 0.89
Variance 0.87 0.75 0.93 0.65 0.40 0.81 0.71 0.48 0.85
Gyro Z
RMS 0.65 0.39 0.81 0.70 0.47 0.84 0.73 0.51 0.86
SEn 0.66 0.41 0.82 0.64 0.39 0.81 0.77 0.59 0.88
AUC FFT 0.66 0.41 0.82 0.71 0.49 0.85 0.74 0.53 0.86
Variance 0.58 0.30 0.77 0.64 0.38 0.81 0.69 0.45 0.83
Gyro Mag
RMS 0.86 0.73 0.93 0.82 0.66 0.91 0.77 0.59 0.88
SEn 0.66 0.41 0.82 0.69 0.42 0.85 0.69 0.41 0.84
AUC FFT 0.79 0.60 0.89 0.81 0.65 0.90 0.78 0.59 0.88
Variance 0.84 0.70 0.92 0.79 0.61 0.89 0.70 0.48 0.84
Accel X
RMS 0.01 -0.30 0.34 0.08 -0.22 0.40 0.10 -0.21 0.41
SEn 0.65 0.39 0.81 0.64 0.38 0.80 0.75 0.54 0.87
AUC FFT 0.42 0.11 0.67 0.54 0.24 0.75 0.82 0.67 0.91
Variance 0.92 0.83 0.96 0.51 0.21 0.73 0.91 0.82 0.95
Accel Y
RMS 0.74 0.44 0.88 0.71 0.47 0.86 0.72 0.48 0.86
SEn 0.52 0.19 0.74 0.77 0.55 0.88 0.66 0.40 0.83
AUC FFT 0.47 0.13 0.71 0.86 0.72 0.93 0.83 0.66 0.92
Variance 0.09 -0.29 0.44 0.88 0.75 0.94 0.87 0.74 0.94
Accel Z
RMS 0.68 0.42 0.84 0.74 0.53 0.86 0.71 0.48 0.85
SEn 0.62 0.36 0.80 0.62 0.32 0.80 0.56 0.26 0.76
AUC FFT 0.46 0.14 0.69 0.76 0.57 0.88 0.76 0.56 0.88
Variance 0.69 0.45 0.83 0.68 0.45 0.83 0.65 0.40 0.81
Accel Mag
RMS 0.38 0.01 0.66 0.74 0.53 0.86 0.78 0.58 0.89
SEn 0.51 0.17 0.74 0.62 0.32 0.80 0.68 0.42 0.84
AUC FFT 0.67 0.41 0.83 0.76 0.57 0.88 0.85 0.70 0.93
Variance 0.58 0.28 0.78 0.68 0.45 0.83 0.84 0.68 0.92
Pitch Pitch 0.67 0.29 0.85 0.78 0.58 0.89 0.81 0.63 0.91
Roll Roll 0.77 0.52 0.89 0.47 0.14 0.71 0.43 0.09 0.69
Yaw Yaw 0.87 0.73 0.94 0.24 -0.14 0.56 0.70 0.46 0.85
The ANT reach predominantly requires sagittal plane
movements, while the PM and PL reach directions
both require more complex multi-planar movement
(Kang et al., 2015). As a result, the variables that
demonstrated excellent reliability when quantifying
the single planar ANT direction (13 variables) are
distinctly different to those that possessed excellent
reliability when quantifying the multi-planar PM/ PL
reach directions (11 variables).
The results presented in this paper build on
previous research which has demonstrated the intra-
session test-retest reliability and the discriminant
validity of the quantified YBT (Johnston et al.,
2017b). This past work demonstrated that the within-
session test-retest reliability of the inertial sensor
quantified YBT ranged from an ICC of 0.76-0.92 for
the 95EV measure, depending on the reach direction
(Johnston et al., 2017b). While the intra-session
reliability results presented are higher than the inter-
session reliability results presented in this study, the
longer follow-up leveraged in the inter-session study
likely increased the amount of within-subject
variance. As such, when the findings of this study are
viewed in conjunction with those of the previous
studies, it becomes clear that the quantified YBT can
be considered a valid and reliable measure of
dynamic balance performance. This has major
significance as it lays the ground work for the
implementation of this system in clinical populations,
potentially aiding the identification of individuals at
icSPORTS 2018 - 6th International Congress on Sport Sciences Research and Technology Support
68

risk of injury/ disease and tracking recovery and
response to intervention.
While no research has determined the inter-
session test-retest reliability of the quantified YBT,
previous work has established the reliability of other
inertial sensor quantified clinical assessments. Simon
and colleagues (2017) demonstrated that an inertial
sensor derived measure of static balance performance
during the balance error scoring system, obtained
from a lumbar worn iPad, possessed good – excellent
1-week test-retest reliability. Similarly, McGrath and
colleagues (2011) demonstrated that 18 inertial
sensor derived variables obtained during the timed up
and go test possessed excellent test-retest reliability,
over a 4-week period. As such, the findings presented
in this paper contribute to the body of evidence that
inertial sensor quantified clinical assessments can
provide a reliable measure of motor performance.
There are a number of contextual factors that need
to be considered related to this study. Firstly, the
population recruited as part of this study is a young
healthy adult population, aged between 18-40. As
such, these findings may not be generalisable across
different populations. Further research is required to
investigate the inter-session test-retest reliability
across various populations, including clinical and
sporting populations. Secondly, an important
characteristic of this study was the 1-week test-retest
design. The 1-week follow-up period used in this
study was chosen to ensure an adequate washout
period between tests, while reducing the likelihood
that individuals may suffer any injuries or illnesses
which may have impaired their balance between
testing points. This 1 week follow-up period is
consistent with other sensor based balance
assessment inter-session reliability studies in the
literature (Simon et al., 2017, Amick et al., 2015). As
such, the results of this study are promising as they
demonstrated the good-excellent reliability of a large
proportion of the quantified YBT variables.
5 CONCLUSION
The results of this inter-session test-retest reliability
study demonstrate that the quantified YBT, as
instrumented by a single lumbar inertial sensor, can
provide a reliable measure of balance performance,
across all three reach directions. Furthermore, a large
proportion of the quantified variables demonstrated
similar or superior reliability to the traditional
analogue YBT reach distances. As such, this study
lays the groundwork for future work investigating the
utility of the quantified YBT as a digital biomarker of
injury/ disease risk, recovery, and response to
intervention. Further research is required to
investigate the reliability of this measure across
clinical and sporting populations.
ACKNOWLEDGEMENTS
Funding for this study was provided by the Science
Foundation of Ireland (12/RC/2289).
REFERENCES
Alberts, J. L., Thota, A., Hirsch, J., Ozinga, S., Dey, T.,
Schindler, D. D., Koop, M. M., Burke, D. & Linder, S.
M. 2015. Quantification Of The Balance Error Scoring
System With Mobile Technology. Medicine and
Science in Sports and Exercise, 47, 2233-2240.
Amick, R. Z., Chaparro, A., Patterson, J. A. & Jorgensen,
M. J. 2015. Test-Retest Reliability Of The Sway
Balance Mobile Application. Journal of Mobile
Technology in Medicine, 4, 40-47.
Cicchetti, D. V. & Sparrow, S. A. 1981. Developing
Criteria For Establishing Interrater Reliability of
Specific Items: Applications to Assessment of Adaptive
Behavior. Am J Ment Defic, 86, 127-37.
Doherty, C., Bleakley, C. M., Hertel, J., Caulfield, B.,
Ryan, J. & Delahunt, E. 2015. Laboratory Measures of
Postural Control During the Star Excursion Balance
Test After Acute First-Time Lateral Ankle Sprain. J
Athl Train, 50, 651-64.
Greene, B. R., Redmond, S. J. & Caulfield, B. 2017. Fall
Risk Assessment Through Automatic Combination of
Clinical Fall Risk Factors and Body-Worn Sensor Data.
IEEE Journal of Biomedical and Health Informatics,
21, 725-731.
Gribble, P. A., Hertel, J. & Plisky, P. 2012. Using The Star
Excursion Balance Test To Assess Dynamic Postural-
Control Deficits and Outcomes in Lower Extremity
Injury: A Literature And Systematic Review. J Athl
Train, 47, 339-57.
Heldman, D. A., Harris, D. A., Felong, T., Andrzejewski,
K. L., Dorsey, E. R., Giuffrida, J. P., Goldberg, B. &
Burack, M. A. 2017. Telehealth Management of
Parkinson’s Disease using Wearable Sensors: An
Exploratory Study. Digital Biomarkers, 1, 43-51.
Herrington, L., Hatcher, J., Hatcher, A. & Mcnicholas, M.
2009. A Comparison of Star Excursion Balance Test
Reach Distances Between ACL Deficient Patients and
Asymptomatic Controls. The Knee, 16, 149-152.
Holden, S., Boreham, C., Doherty, C., Wang, D. &
Delahunt, E. 2016. A Longitudinal Investigation Into
The Progression of Dynamic Postural Stability
Performance in Adolescents. Gait Posture, 48, 171-
176.
Johnston, W., Moran, T., Dolan, K., Reid, N., Coughlan, G.
& Caulfield, B. 2017a. Objective Quantification of a
Inter-session Test-retest Reliability of the Quantified Y Balance Test
69

Clinical Dynamic Balance Assessment. Br J Sports
Med, 51, A54.
Johnston, W., O'reilly, M., Dolan, K., Reid, N., Coughlan,
G. F. & Caulfield, B. 2016. Objective Classification Of
Dynamic Balance Using A Single Wearable Sensor.
Proceedings Of The 4th International Congress on
Sport Sciences Research and Technology Support.
Porto, Portugal: Springer.
Johnston, W., O’reilly, M., Coughlan, G. F. & Caulfield, B.
2017b. Inertial Sensor Technology Can Capture
Changes In Dynamic Balance Control During The Y
Balance Test. Digital Biomarkers, 1, 106-117.
Kang, M.-H., Kim, G.-M., Kwon, O.-Y., Weon, J.-H., Oh,
J.-S. & An, D.-H. 2015. Relationship Between The
Kinematics Of The Trunk And Lower Extremity And
Performance On The Y-Balance Test. PM&R, 7, 1152-
1158.
Madgwick, S. O., Harrison, A. J. & Vaidyanathan, A. 2011.
Estimation Of Imu And Marg Orientation Using A
Gradient Descent Algorithm. IEEE Int Conf Rehabil
Robot, 2011, 5975346.
Matlab. 2018a. Cumsum [Online]. Available:
Https://Uk.Mathworks.Com/Help/Matlab/Ref/Cumsu
m.Html [Accessed].
Matlab. 2018b. Fast Fourier Transform [Online].
Available: Https://Uk.Mathworks.Com/Help/Matlab/
Ref/Fft.Html [Accessed].
Mcgrath, D., Greene, B. R., Doheny, E. P., Mckeown, D. J.,
De Vito, G. & Caulfield, B. 2011. Reliability Of
Quantitative Tug Measures Of Mobility For Use In
Falls Risk Assessment. Conf Proc IEEE Eng Med Biol
Soc, 2011, 466-9.
Moe-Nilssen, R. 1998. A New Method For Evaluating
Motor Control In Gait Under Real-Life Environmental
Conditions. Part 1: The Instrument. Clin Biomech
(Bristol, Avon), 13, 320-327.
Plisky, P. J., Gorman, P. P., Butler, R. J., Kiesel, K. B.,
Underwood, F. B. & Elkins, B. 2009. The Reliability
Of An Instrumented Device For Measuring
Components Of The Star Excursion Balance Test. N Am
J Sports Phys Ther, 4, 92-99.
Plisky, P. J., Rauh, M. J., Kaminski, T. W. & Underwood,
F. B. 2006. Star Excursion Balance Test As A Predictor
Of Lower Extremity Injury In High School Basketball
Players. Journal of Orthopaedic & Sports Physical
Therapy, 36, 911-919.
Shaffer, S. W., Teyhen, D. S., Lorenson, C. L., Warren, R.
L., Koreerat, C. M., Straseske, C. A. & Childs, J. D.
2013. Y-Balance Test: A Reliability Study Involving
Multiple Raters. Mil Med, 178, 1264-70.
Simon, M., Maerlender, A., Metzger, K., Decoster, L.,
Hollingworth, A. & Valovich Mcleod, T. 2017.
Reliability And Concurrent Validity Of Select C3
Logix Test Components. Developmental
Neuropsychology, 1-14.
Smith, C. A., Chimera, N. J. & Warren, M. 2015.
Association Of Y Balance Test Reach Asymmetry And
Injury In Division I Athletes. Med Sci Sports Exerc, 47,
136-41.
Weiss, A., Herman, T., Giladi, N. & Hausdorff, J. M. 2014.
Objective Assessment Of Fall Risk In Parkinson's
Disease Using A Body-Fixed Sensor Worn For 3 Days.
Plos One, 9, E96675.
Wilkins, J. C., Valovich Mcleod, T. C., Perrin, D. H. &
Gansneder, B. M. 2004. Performance On The Balance
Error Scoring System Decreases After Fatigue. Journal
of Athletic Training, 39, 156-161.
Zijlstra, W. & Hof, A. L. 2003. Assessment Of Spatio-
Temporal Gait Parameters From Trunk Accelerations
During Human Walking. Gait Posture, 18, 1-10.
icSPORTS 2018 - 6th International Congress on Sport Sciences Research and Technology Support
70
