
A Preliminary Study about the Music Influence on EEG and ECG
Signals
Manuel Merino-Monge, Isabel M. Gómez-González, Juan A. Castro-García,
Alberto J. Molina-Cantero and Roylán Quesada-Tabares
Departamento de Tecnología Electrónica, Universidad de Sevilla, Spain
Keywords:
Music, Electrocardiogram, Electroencephalogram, Signal Processing.
Abstract:
In this work, music is used to elicit emotions and the impact produced by it on the electrocardiogram and
electroencephalogram signals is measured. Test consists a sequence of 12 songs where each one is played
during 1 minute. Songs were grouped in 4 sets based on pleasant/activation level. In this preliminary study, 6
male subjects realized the trial. Individuals scored each song using Self-Assessment Manikin (SAM) survey.
Biosignal parameters were analyzed with Kruskal-Wallis test (KWT). Although the sample of the subjects
on whom the test was performed is small, significant variation is observed in 3 parameters extracted from
the electrocardiogram when features are grouped using SAM values from survey filled in by subjects. These
parameters show an increasing of heart rate with arousal level and when songs are not totally matched with
individual preferences. The use of information extracted from biosignals in therapies for individuals with low
interaction is proposed for future studies.
1 INTRODUCTION
The potential of music to evoke emotions make it
a valuable tool in multiple situations. One of the
most interesting applications is music therapy whose
goal is to increase awareness and attention, promote
sensory processing, create a feeling of enjoyment
and develop sense of autonomy and control (Adler
et al., 2017). In (Stephenson, 2006) a paper review
is done about aims and methodologies used by mu-
sic therapists working with individuals with severe
disabilities; music therapy sessions, when designed
in collaboration with educators, may supply a fra-
mework for eliciting and practicing communication
abilities. In (Bradt et al., 2013) a review is done
about the effect of music in in coronary heart dise-
ase (CHD), result shows that music may have a ther-
apeutic effect on anxiety in individuals with CHD,
mainly those with a myocardial infarction; anxiety-
reducing effects are greatest when people can select
which music to listen to; moreover, music may im-
proved systolic blood pressure, heart rate (HR), res-
piratory rate, quality of sleep and pain in persons
with CHD. In another plane it can be found appli-
cations that help us to classified music according to
our mood, for instance in Spotify there are list ac-
cording to different emotional situations in our daily
life
1
. In (Thoma et al., 2012), songs that were emo-
tionally congruent with individual’s mood were pre-
ferred, such that emotion-regulation styles affect the
selection of song characterized by determinate emoti-
ons. Music plays a role in emotion that a film arise,
different perspectives of this can be found in (Ku-
chinke et al., 2013).
There are different strategies that allow to charac-
terize the music with respect to the emotion it arou-
ses. One of them is the evaluation of users. In or-
der to accomplish this it can be used two models for
emotions representation: dimensional and categori-
cal. Dimensional representations used by psycholo-
gists often employ a n-dimensional space to repre-
sent emotions (commonly 2 or 3-dimensional). The
valence-arousal (V-A) representation is one of most
used example of emotional space (Russell, 1980). Va-
lence indicates positive versus negative emotion, and
arousal indicates emotional intensity. The categorical
model uses 6 basic emotions from which the others
can be derived. Another strategy is to extract features
from the audio, the parameter values can determine
the kind of emotion that the music is able of eliciting.
In (Laurier et al., 2012) a mapping between musi-
1
Accessed on April, 2018: https://open.spotify.com/
view/mood-page
100
Merino-Monge, M., Gómez-González, I., Castro-García, J., Molina-Cantero, A. and Quesada-Tabares, R.
A Preliminary Study about the Music Influence on EEG and ECG Signals.
DOI: 10.5220/0006960001000106
In Proceedings of the 5th International Conference on Physiological Computing Systems (PhyCS 2018), pages 100-106
ISBN: 978-989-758-329-2
Copyright © 2018 by SCITEPRESS – Science and Technology Publications, Lda. All rights reserved

cal features (tempo, mode, harmony, loudness, pitch,
etc.) an emotions categories (happiness, sadness, an-
ger, fear, tenderness) is reported, each independent
parameter is presumably insufficient to decide about
one emotion; on the contrary this may need a lush of
musical descriptors. Many studies have demonstrated
that emotions from music are not too subjective, in-
deed within a common culture, the responses can be
greatly consonant among listeners, such that it may
be possible to replicate this in machines. The goal in
(Laurier et al., 2012) is built a system to assess mu-
sical emotions from a song. For this, supervised ma-
chine learning techniques are used.
Related with these concepts in (Fritz et al., 2009) a
cross-cultural study is done. Two sets of subjects par-
ticipated: native African population (Mafa) and Wes-
tern population. Each group listened the music of the
other respective culture is done. The skill to identify
three basic emotion (joy, sad, fear) from Western mu-
sic is investigated in experiment 1. Results show that
emotions from Western songs are universally recog-
nized (Mafa identified the three basic emotions). The
second experiment analyzed pleasantness levels chan-
ges due to spectral manipulation of music in both sub-
ject sets. Several spectral features were altered, like
sensory dissonance. The manipulated songs were un-
preferred with respect to original versions, such that
consonance and dissonance of the music may univer-
sally influence in the pleasantness level.
In (Vieillard et al., 2008) the aim is validated 56
musical extracts.The stimuli were composed with film
genre music. These transmitted four emotions depen-
ding of music features (happy, sad, threat and peace-
fulness), so the study provides suitable material for
research on emotions. In Ekman’s classification sets
happiness, sadness and threat as basic emotions (Ek-
man et al., 1972). The fourth emotion, peacefulness,
was added as oppositeness to threat. These emotions
can be defined in the 2-dimensional space from va-
lence and arousal model.
In (McAdams et al., 2017) is said that ” Of interest
to both music psychology and music informatics from
a computational point of view is the relation between
the acoustic properties that give rise to the timbre at
a given pitch and the perceived emotional quality of
the tone. Musician and non musician listeners heard
137 tones generated at a set dynamic marking (forte)
playing tones at pitch class D across each instru-
ment’s whole pitch interval and with several playing
techniques for standard orchestral instruments drawn
from the brass, woodwind, string, and pitched per-
cussion families”. They scored each tone on six
analogical-categorical scales in terms of valence (po-
sitive/negative and pleasant/unpleasant), energy arou-
sal (awake/tired), tension arousal (excited/calm), pre-
ference (like/dislike), and familiarity. Twenty-three
audio descriptors from the ”Timbre Toolbox” were
processed for each audio and analyzed in two ways
(Peeters et al., 2011): linear partial least squares re-
gression and nonlinear artificial neural net modeling.
These two analyses coincided in terms of the signi-
ficance of various audio descriptors in revealing the
emotion ratings, but some differences were found,
such that, distinct acoustic properties are being sug-
gested.
In (Soleymani et al., 2013) a dataset contains 1000
songs, each one annotated by a minimum of 10 sub-
jects is presented, which is larger than many currently
available music emotion dataset. This study supplies
a dataset for music emotion recognition research and
a baseline system. The dataset consists entirely of cre-
ative commons music from the Free Music Archive,
which as the name suggests, can be shared freely wit-
hout penalty.
The aims of (Rodà et al., 2014) are: check how
music excerpt are grouped as a function of the con-
straints applied to the stimuli; to study which dimen-
sions, accompanied by valence and arousal, can be
employed to represent emotional features of music; to
establish computable musical parameters related with
those dimensions in classification activities. The uses
of verbal labels to express emotions is avoided. Parti-
cipant were asked to completely focused on their own
feelings from musical extracts and to group that trans-
mitted similar subjective emotions.
During recent years neuroscientific research on
music-evoked emotions have increased and in (Koel-
sch, 2014) it can be found a recompilation of studies
of brain structures involve in this. In this work is esta-
blished that the emotional effects caused by music can
be motivated by memory associated with music but a
part of them are induced only by the music itself. In
the previous works, the emotions aroused by the mu-
sic were evaluated using two sources of information:
on the one hand, the extraction of the musical cha-
racteristics of the audios and on the other, the testing
of the users where the feeling of being causes a cer-
tain piece of music This definition can be made using
either the dimensional representation of the emotions
or the categorical one. One way to objectively mea-
sure the emotion desperate for music is to measure the
physiological response that the hearing causes.
The objective of (Goshvarpour et al., 2016) is to
propose an accurate emotion recognition methodo-
logy. To this end, a novel fusion framework based on
wavelet transform, and matching pursuit (MP) algo-
rithm is chosen. Electrocardiogram (ECG) and galva-
nic skin response (GSR) of 11 healthy students were
A Preliminary Study about the Music Influence on EEG and ECG Signals
101

collected while subjects listened to emotional music
clips in (Vieillard et al., 2008), after the section, the
subjects were asked to fill in the questionnaire for the
evaluation of induced emotions. To describe emoti-
ons, three schemes were adopted: two-dimensional
model (five classes), valence (three classes), and arou-
sal (three classes) based emotion categories. Sub-
sequently, the probabilistic neural network was app-
lied to classify affective states. The experiments in-
dicate that the MP-based fusion approach outperform
the wavelet-based fusion technique or methods using
only ECG or GSR indexes. Considering the proposed
fusion techniques, the maximum classification rate of
99.64% and 92.31% was reached for the fusion met-
hodology based on the MP algorithm (five classes of
emotion) and wavelet-based fusion technique (three
classes of valence), respectively. In (Goshvarpour
et al., 2017) results are improved to 100%.
In (Wagner et al., 2005), the most important stages
of a fully implemented emotion recognition system
including data analysis and classification is discussed.
For recording biosignals in different affective states, a
music induction method is used based on four songs
chosen by the users taking into account that can pro-
voke some special memories. Four-channel biosen-
sors are utilized to record electromyogram, electro-
cardiogram, skin conductivity and respiration chan-
ges. After several parameters were calculated from
the raw signals. Linear discriminant function, k-
nearest neighbor and multilayer perceptron were app-
lied together with feature reduction methods. Correct
classification rates of about 92% were reached for all
three classifiers.
In this work, a preliminary study is carried out
with two objectives. The first target is investigating
if the emotions elicited by the music can be detected
in the physiological signals, that is, if it is possi-
ble setting a link between physiological changes and
the pleasant/agitation levels causes to listening music.
For this purpose, parameters of the recorded signals
will be established and an evaluation of their signi-
ficance will be made. The second goal is evaluating
if the background of the subject in terms of experien-
ces, culture and preferences can influence the emotion
aroused by music.
In this first evaluation, the chosen stimuli were
songs not specifically composed to awaken emotions
and which have been previously evaluated in terms of
valency and arousal by other subjects. The evalua-
tion is pending, making use of other types of stimuli.
From songs with which the subjects are more fami-
liar to synthesized music with certain values in the
audio parameters that facilitate the elicitation of cer-
tain emotions.
Table 1: Selected songs and their affective values.
Group File Valence Arousal
1 88 5.5 6.7
1 102 5.4 6.5
1 898 5.5 6.4
2 127 5.3 3
2 979 5.5 3.1
2 686 5.5 3.4
3 227 3.5 3.1
3 297 3.6 3.1
3 530 3.5 3.3
4 161 3.5 6.3
4 729 3.5 6.4
4 987 3.6 6.3
2 METHODOLOGY
The experimentations took place in a small corner,
visually isolated, of 235cm of width and 140cm of
depth of a room. A comfortable temperature was
kept in (22–24
◦
) with sound environment of 29 dB
2
and light lighting to reinforce subject’s focus on the
display (around of 217 lux
3
). Individuals were se-
ated on a padded chair placed 120cm away from a
18.5” monitor (aspect ratio 4:3) with a resolution of
1280 ×1024 pixels and 32 bits of color. Monitor was
aligned with individual head. Each subject was asked
to attend around 18-minute session. The recording in-
terval was split in 2 parts (figure 1): the initial rest pe-
riod of 2 minutes and 12 blocks of songs. Each song’s
block is compounded of a initial recovery (30s), 1 mi-
nutes of audio and filling in emotional survey as soon
as possible (time limitless). A black screen with a
gray cross is shown in the display center during non-
survey periods. Four sets of 3 songs were selected
from (Soleymani et al., 2013) (figure 2 and table 1).
Songs of each set have similar V-A values. Domi-
nance values were ignored based on circumplex mo-
del of affects (Posner et al., 2005), where valence and
arousal are enough to evaluate physiological changes
with behavioral, cognitive activity, and development
studies. On the other hand, survey periods consist in
scoring valence and arousal levels of previous song in
integer scale from 1 (unpleasant/deactivation) up to 9
(pleasant/activation).
2
Measurement was done using a Samsung Galaxy
S5 and Sound Meter App (available on April, 2018:
https://play.google.com/store/apps/details?id=coocent.app.
tools.soundmeter.noisedetector).
3
Measurement was done using a Samsung Galaxy S5
with its hidden menu.
PhyCS 2018 - 5th International Conference on Physiological Computing Systems
102
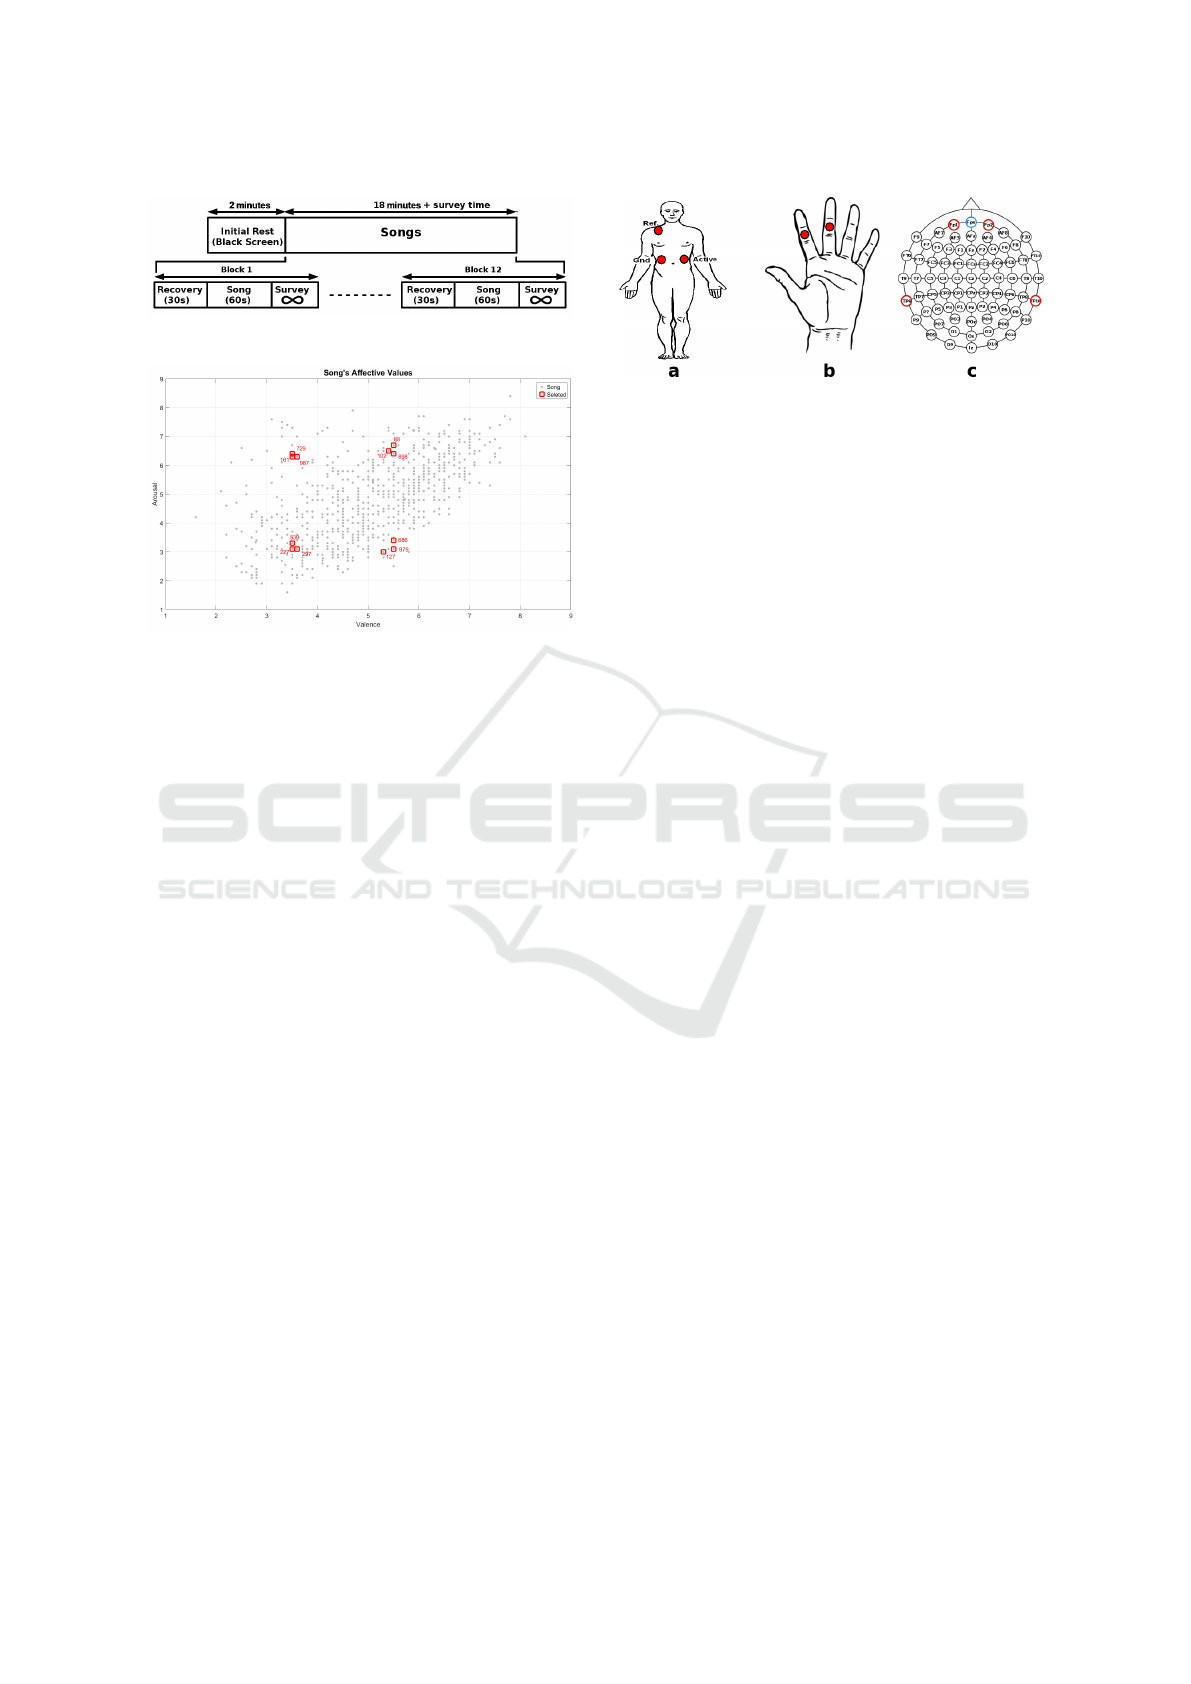
Figure 1: Test scheme.
Figure 2: Selected songs and the other ones from music
database.
2.1 Subjects
The trials were conducted with 6 healthy man volun-
taries aged between 21 and 61 years old (average=43;
standard deviation=15; no woman voluntaries).
2.2 Data Acquisition
Three different biosignals were simultaneously recor-
ded during the tests: ECG, GSR, and electroencepha-
logram (EEG). The electrode locations are shown in
the figure 3. The two first ones were recorded utilized
Arduino UNO and an own design platform connected
to Arduino (Molina et al., 2017) employed Ag/AgCl
electrodes with self-adhesive/conductive gel. Ar-
duino was programmed the library developed by
(Molina-Cantero et al., 2018). Sampling rate was set
to 256 Hz. ECG employed a monopolar assembly,
and GSR assembly was placed on the medial pha-
lanx of index and middle fingers. EEG was recor-
der from Muse device (Krigolson et al., 2017) with
220-Hz sampling rate. The ground electrode is lo-
cated in Fpz, and the recorded channels were: Fp1,
Fp2, TP9, and TP10. These positions are suited for
the goal of this study because frontal positions are
linked with positive/negative emotions(Alves et al.,
2008), while temporal regions are associated audi-
tory processing(Nunez and Srinivasan, 2006). ECG
and EEG data were respectively filtered applied a har-
dware bandpass filter with 0.1-30 and 1-60 Hz, whe-
reas non filter was applied to GSR data. On the ot-
her hand, EEG data must face the presence of several
Figure 3: Electrode locations: a) ECG; b) GSR; c) EEG.
artifacts, such that environmental noise, drift, blink,
saccadic eye movement, face muscle contraction, and
heart rate. A bandpass filter between [0, 8)Hz and a
notch filter (48, 52)Hz to reduce these problems were
applied to EEG signals.
2.3 Biosignal Features
EEG signal was divided in 3 frequency bands:
(8,14]Hz is α, (14,30]Hz is β, and (30, 45]Hz is γ.
α wave is mainly related with occipital region with
awaken, relaxation, and no-open-eye states; β rhythm
is mainly linked with moderate cognitive activity in
central and frontal areas; and γ band is associated with
high cognitive requisites and information processing.
Extracted band parameters are congregated in table 2.
Normalized power of band (NPB) is the normalized
power of the band, relative power (RP) means the
percentage of the band with respect to the total po-
wer of EEG bands, power spectrum centroid (PSC)
corresponds to spectral centroid that is the weighted
mean of the frequencies present in the band, that is,
the ”center of mass” of this one, power spectrum de-
viation respect to the centroid (PSDC) is the gather-
ing of spectrum around the PSC in the band, rather
spectral deviation, and flatness (FL) means the rand-
omness level of signal whose value is in the interval
[0, 1], so that 1 corresponds to a white noise, and 0
indicates spectrum is concentrated in a small number
of harmonics. Notice that value of all features is in
the interval [0, 1].
The RR segments are obtained from the ECG sig-
nal through the algorithm based on lower envelope
developed in (Merino et al., 2015). Different para-
meters are extracted from heart rate and they may be
classified in two groups: information based on tem-
poral analysis (Sörnmo and Laguna, 2005) and shape
waves. The more common calculated parameters of
the first group are the standard deviation of RR in-
tervals (SDNN), the square root of the mean squared
difference of successive RR segments (RMSSD),the
proportion of RR intervals that differ by more than
50ms (pNN50), and the width of the minimum square
difference triangular interpolation of the highest peak
A Preliminary Study about the Music Influence on EEG and ECG Signals
103

Table 2: EEG Band Parameters. x ∈
{
α, β, γ
}
.
Parameter Equation
Normalized power
of band (NPB)
NPB
x
=
∑
f ∈x
PSD( f )
Relative power
(RP)
RP
x
=
NPB
x
γ
∑
y=δ
NPB
y
Power spectrum
centroid (PSC)
FC
x
=
∑
f ∈x
f ·PSD( f )
NPB
x
I
x
= max(x) −min(x)
PSC
x
=
(FC
x
−min(x))
I
x
Power spectrum
deviation respect
to the centroid
(PSDC)
NF
x
( f ) =
( f −min(x))
I
x
DF
x
( f ) = PSD( f ) ·(NF
x
( f ) −PSC
x
)
2
PSDC
x
=
∑
f ∈x
DF
x
( f )
NPB
x
Flatness (FL)
FL
x
=
∏
f ∈x
n·
n
√
PSD( f )
NPB
x
of the histogram of all RR intervals (TINN). These
are used to determine the variability over a short
time period to obtain the influence of parasympat-
hetic nervous system. Important information about
quick random changes of heartbeat is extracted from
pNN50. The second feature set are: amplitude dis-
tance between Q and S waves, Q-S time, R-Q slope,
S-R slope and the kurtosis and skewness of them and
RR segments. Finally, the median of RR segments
(MRR) was obtained too. This measure is based on
the histogram too, it is simple but not as common as
the other measures based in HR.
GSR data were rejected due to saturation pro-
blems.
3 RESULTS
The outlier values were avoided in our analysis using
the interquartile-range method, that is, the values out
of [Q1 - 1.5(Q3 - Q1), Q3 + 1.5(Q3 - Q1)] were eli-
minated, where Q1 and Q3 are the lower and upper
quartiles respectively.
We are interested in discovering how the biosig-
nals features change through the different musics due
to emotions elicited by them. Therefore, the KWT
with 0.05 statistical significance (p-value) is applied
to the parameters. Three analyses were realized. In
the first one, data were grouped based on selected
song sets (figure 2), that is, statistical analysis compa-
res variations of features sorted by 4 different groups
(onwards, KWT4), this means that in this analysis
the subjects’ particular characteristics have not been
taken into account, only the music itself. We were
interested in studying whether the emotion elicited
by the music depends on the user’s background or
not, that is why the two other analyzes have been
proposed. In these ones the features are categorized
base on subjects’ V-A values. The mean of the sco-
res (valence = 5.81 ±2.20; arousal = 3.03 ±1.96)
splits features in 2 categories: low (V1/A1) and high
(V2/A2). Statistical analyses compare variations of
features sorted by 2 different labels in each affective
axis (onwards, KWT2V and KWT2A for valence and
arousal groups respectively). Also, KWT analysis
was applied between baseline and low (V1/A1) and
high (V2/A2) affective groups.
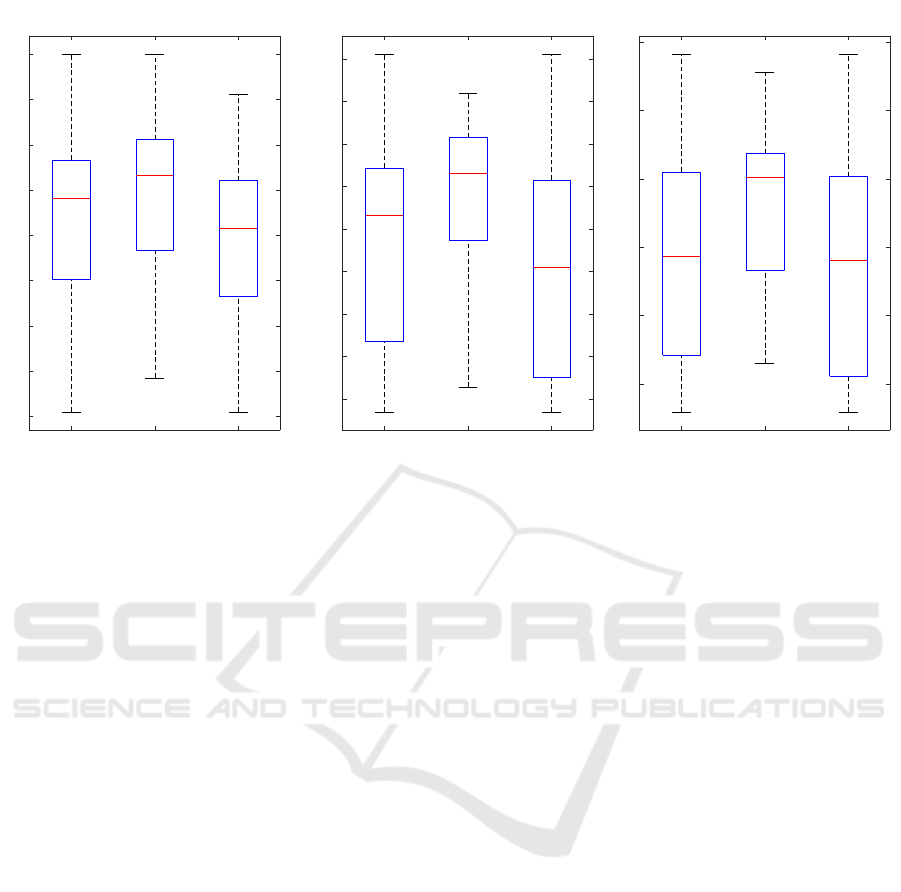
The expected behavior is significant difference be-
tween groups in each analysis. However, EEG data
were non significant for all KWT analysis, while
ECG only three features have significant variations
(figure 4): skewness of RR segments in the KWT2V
analysis, and MRR and R-S slope in the KWT2A ana-
lysis. Positive skewness value indicates a bias to lo-
wer RR segment values, that is, HR is increased when
a song is not totally matched with subject preferen-
ces. Similar meaning is linked with MRR. A smal-
ler value of RR segments is associated with a higher
activation, while these increase with a greater calm
level. This fact coincides with a previous study focu-
sed on stress effect (Monge et al., 2014). Likewise,
the significant of the R-S slope may be caused by
increasing of HR when activation level is increased.
On the other hand, affective groups are not signifi-
cantly different with respect to baseline. Songs with a
less pleasant level (V1) show a greater skewness than
baseline, while more pleasantness musics (V2) draw
normal distribution (similar to baseline). Also, songs
with lower and higher arousal levels exhibit smaller
and greater MRR values with respect to baseline, and
R-S slope is smaller in A1 group ,but almost equal
in A2 group. This fact may be caused by subjects’
expectation about what kind of music they will be lis-
tened.
4 CONCLUSIONS
The target of this study was to analyze the variations
of EEG and ECG and how these are related with sub-
ject’s music preferences. The behavior of EEG fea-
tures are similar in all cases, such that, none of them
show significant variations, while three of ECG para-
meters draw variations due to song if results are grou-
ped according to user punctuations in arousal and va-
lence. Despite, the reduced number of subjects limit
the significant of results.
In future work, the number experimental subjects
of test must be increasing for getting a stronger sta-
tistical analysis. On the other hand, different musi-
PhyCS 2018 - 5th International Conference on Physiological Computing Systems
104
L V1 V2
-0.8
-0.6
-0.4
-0.2
0
0.2
0.4
0.6
0.8
VAlence: Skewness of RR segments
L A1 A2
-50
-40
-30
-20
-10
0
mV/s#
Arousal: R-S Slope
L A1 A2
750
800
850
900
950
1000
1050
1100
1150
miliseconds#
Arousal: Median of RR segments
Figure 4: Boxplots of significant features from KWT statistical analyses. Left figure is the variations of skewness of RR
segments; middle figure contains the changes in median of RR segments; right figure is the variations of slope of R-S wave.
Symbol meanings: “L” indicates baseline, “V” identifies valence, “A” means Arousal, and numbers “1” and “2” indicate group
of lowest and highest levels respectively.
cal stimulus may be employed with the objective of
evaluating influence musical characteristics by them-
selves without considering the profile of the subject.
Based on the results conducted in this work, the in-
formation provided by the physiological signals will
be used to developed an adaptive music system will to
improve interaction capacity of individuals with disa-
bilities, mainly children with special needs.
REFERENCES
Adler, R., Samsonova-Jellison, O., Clark, A., Hua, X.,
Howarth, G., and Cable, W. (2017). The Music Ther-
apy for Multisensory and Body Awareness in Children
and Adults with Severe to Profound Multiple Disabili-
ties: The MuSense Manual. Jessica Kingsley Publis-
hers, Philadelphia, PA.
Alves, N. T., Fukusima, S. S., Aznar-casanova, J. A., Paulo,
U. D. S., and Preto, R. (2008). Models of brain asym-
metry in emotional processing. Psychology & Neuros-
cience, 1(1):63–66.
Bradt, J., Dileo, C., and Potvin, N. (2013). Music for stress
and anxiety reduction in coronary heart disease pa-
tients. The Cochrane database of systematic reviews,
12:CD006577.
Ekman, P., Friesen, W. V., and Ellsworth, P. (1972). Emo-
tion in the human face: guide-lines for research and
an integration of findings. Pergamon Press.
Fritz, T., Jentschke, S., Gosselin, N., Sammler, D., Pe-
retz, I., Turner, R., Friederici, A. D., and Koelsch, S.
(2009). Universal Recognition of Three Basic Emoti-
ons in Music. Current Biology, 19(7):573–576.
Goshvarpour, A., Abbasi, A., and Goshvarpour, A. (2017).
An accurate emotion recognition system using ecg
and gsr signals and matching pursuit method. Bio-
medical Journal, 40(6):355 – 368.
Goshvarpour, A., Abbasi, A., Goshvarpour, A., and Da-
neshvar, S. (2016). A novel signal-based fusion ap-
proach for accurate music emotion recognition. Bio-
medical Engineering: Applications, Basis and Com-
munications, 28(06):1650040.
Koelsch, S. (2014). Brain correlates of music-evoked emo-
tions.
Krigolson, O. E., Williams, C. C., Norton, A., Hassall,
C. D., and Colino, F. L. (2017). Choosing MUSE: Va-
lidation of a low-cost, portable EEG system for ERP
research. Frontiers in Neuroscience, 11(MAR).
Kuchinke, L., Kappelhoff, H., and Koelsch, S. (2013).
Emotion and music in narrative films: A neuroscien-
tific perspective. In The Psychology of Music in Mul-
timedia, chapter 6, pages 118–138. Oxford University
Press.
Laurier, C., Concepts, P. H. M. L., Methodologies, U., and
2012, U. (2012). Automatic detection of emotion in
music: Interaction with emotionally sensitive machi-
nes. Information Resources Management Association
(USA).
McAdams, S., Douglas, C., and Vempala, N. N. (2017).
Perception and modeling of affective qualities of mu-
sical instrument sounds across pitch registers. In
Front. Psychol.
Merino, M., Gómez, I. M., and Molina, A. J. (2015). Enve-
lopment filter and K-means for the detection of QRS
A Preliminary Study about the Music Influence on EEG and ECG Signals
105

waveforms in electrocardiogram. Medical Engineer-
ing and Physics, 37(6):605–609.
Molina, A. J., Gómez, I. M., Guerrero, J., Merino, M., Cas-
tro, J. A., Quesada, R., Berrazueta, S., and de Men-
doza, M. H. (2017). A hardware/software platform to
acquire bioelectrical signals. a case study: Characte-
rizing computer access through attention. In Procee-
dings of the 4th International Conference on Physio-
logical Computing Systems - Volume 1: PhyCS,, pages
76–83. INSTICC, SciTePress.
Molina-Cantero, A. J., Castro-García, J. A., Lebrato-
Vázquez, C., Gómez-González, I. M., and Merino-
Monge, M. (2018). Real-time processing library for
open-source hardware biomedical sensors. Sensors,
18(4).
Monge, M., Gomez, I., and Molina, A. (2014). Robustness
of Parameters from Heart Rate for Mental Stress De-
tection. Exp Clin Cardiol, 20(8):3509–3517.
Nunez, P. L. and Srinivasan, R. (2006). Electric Fields of
the Brain: The Neurophysics of EEG, volume 4.
Peeters, G., Giordano, B. L., Susini, P., Misdariis, N., and
McAdams, S. (2011). The Timbre Toolbox: Ex-
tracting audio descriptors from musical signals. The
Journal of the Acoustical Society of America.
Posner, J., Russell, J. A., and Peterson, B. S. (2005). The
circumplex model of affect: An integrative appro-
ach to affective neuroscience, cognitive development,
and psychopathology. Development and Psychopat-
hology, 17:715–734.
Rodà, A., Canazza, S., and De Poli, G. (2014). Cluste-
ring affective qualities of classical music: Beyond the
valence-arousal plane. IEEE Transactions on Affective
Computing, 5(4):364–376.
Russell, J. A. (1980). A circumplex model of affect. Journal
of Personality and Social Psychology, 39(6):1161–
1178.
Soleymani, M., Caro, M. N., Schmidt, E. M., Sha, C.-Y.,
and Yang, Y.-H. (2013). 1000 songs for emotional
analysis of music. In Proceedings of the 2nd ACM
international workshop on Crowdsourcing for multi-
media - CrowdMM ’13, pages 1–6.
Sörnmo, L. and Laguna, P. (2005). Bioelectrical Signal Pro-
cessing in Cardiac and Neurological Applications.
Stephenson, J. (2006). Music Therapy and the Education
of Students with Severe Disabilities. Education and
Training in Developmental Disabilities, 41(413):290–
299.
Thoma, M. V., Ryf, S., Mohiyeddini, C., Ehlert, U., and
Nater, U. M. (2012). Emotion regulation through lis-
tening to music in everyday situations. Cognition and
Emotion, 26(3):550–560.
Vieillard, S., Peretz, I., Gosselin, N., Khalfa, S., Gagnon,
L., and Bouchard, B. (2008). Happy, sad, scary and
peaceful musical excerpts for research on emotions.
Cognition and Emotion, 22(4):720–752.
Wagner, J., Kim, J., and Andre, E. (2005). From physiologi-
cal signals to emotions: Implementing and comparing
selected methods for feature extraction and classifica-
tion. In 2005 IEEE International Conference on Mul-
timedia and Expo, pages 940–943.
PhyCS 2018 - 5th International Conference on Physiological Computing Systems
106
