
Temperature Rise Characteristic of Engineering Vehicle
Refurbished Tire
Qian
g
Wan
g
, Xiao
j
ie Qi, Yunlon
g
Wan
g
andGuotianWan
g
School of Automobile and Traffic Engineering, Heilongjiang Institute of Technology, Hongqi Street, HarBin, China
63070266
6
@
qq
.com
Keywords: Engineering vehicle refurbished tire, Stead-state temperature field, Finite element analysis, Temperature rise
Characteristics.
Abstract: In order to further clarify the temperature rise characteristic of engineering vehicle refurbished tire, computer
geometry models and the finite element analysis modals of the 26.5 R25 engineering vehicle refurbishment tire
were built using Pro/E Wildfire and ANSYS Workbench software, the boundary conditions of finite element
analysis of steady state temperature field was determined, then the steady-state temperature field test system for
the rolling working condition of engineering vehicle refurbished tire was constructed, and last the temperature
field distribution characteristics and heat flux distribution characteristics of the tire layer, buffer layer, belt layer,
tread body layer, tire side layer and toe mouth rubber layer along the width direction and radial direction of the tire
were obtained. The simulation and test results are shown: the two sides of the tread body layer shoulder had the
highest temperature, with the lowest temperature on the belt layer, buffer layer, and both sides along the width
direction of tread body layer. The interior temperature of the refurbished tire increased with the speed of the
running tire, among them, the temperature of the buffer layer and the tire layer increased greatly, and the tread
body layer was the second, and the temperature of the belt layer was the smallest. The maximum heat flux was
near the shoulder position of the tread body layer.
1 INTRODUCTION
In recent years, with the rapid development of
construction, mining and other industries, the usage
of tires for engineering machinery vehicles is
increasing, but due to its poor working conditions
and frequency of usage, the production of
engineering vehicle waste tires is increasing sharply.
The amount of rubber used for an engineering
vehicle tire is about 15% of the total tire
consumption, therefore, improving the
refurbishment rate of the waste tires of engineering
vehicle, which can effectively improve the
utilization rate of the waste tires of engineering
vehicles, save rubber resources and promote green
environment, thus "black pollution" will be
effectively changed into "black energy"(Liu
Chundao., 2016; Sun Hongyan, 2015). At present,
the research on engineering vehicles refurbished
tires done by developed countries such as America,
Japan, and South Korea and China mainly
concentrated in the refurbishment industry
conditions and related policy analysis, refurbishment
process equipment development, refurbishment
process technology, refurbished tire product quality
evaluation, etc. There are not many studies on
macroscopic and microscopic mechanical properties
in the use of engineering refurbished tire, except
some results gotten by the author of this paper and
the research group in recent years, no results have
been published. Due to the lack of basic technology
of engineering tires refurbishment, engineering
refurbished tires often appear not wear-resisting,
easy to collapse cost block, even tread separation,
and other damage forms caused by blasting and the
blasting in the process of usage, seriously affecting
popularization and application (Ma Xiao., 2015;
Wang Qiying, 2015). For this purpose, this paper
built a computer geometry model, finite element
analysis model and temperature rise characteristic
test system, qualitatively and quantitatively
described and evaluated the temperature rise
characteristics of engineering vehicle refurbished
tire, thus It provides important theoretical guidance
for the researches on the performance evaluation,
optimization of the refurbishment process and the
using promotion.
Wang, Q., Qi, X., Wang, Y. and Wang, G.
Temperature Rise Characteristic of Engineering Vehicle Refurbished Tire.
In 3rd International Conference on Electromechanical Control Technology and Transportation (ICECTT 2018), pages 409-413
ISBN: 978-989-758-312-4
Copyright © 2018 by SCITEPRESS – Science and Technology Publications, Lda. All rights reserved
409
2 THE GEOMETRIC MODEL
CONSTRUCTION OF STEADY
TEMPERATURE FIELD OF
ENGINEERING REFURBISHED
TIRE
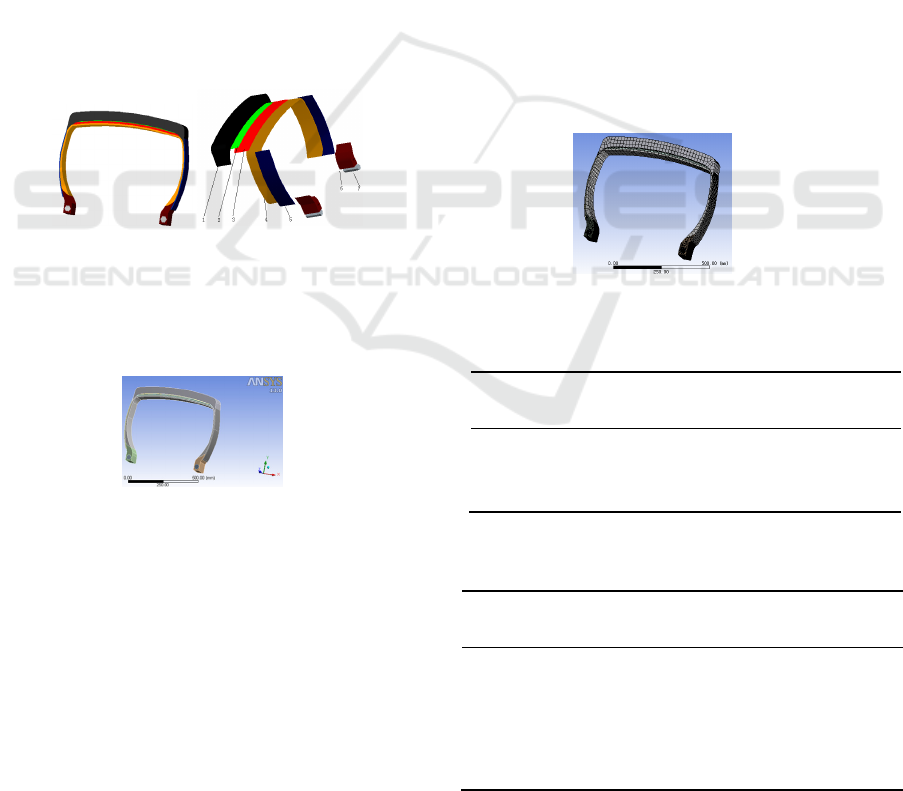
In this paper, tread layer, buffer layer, belt layer, tire
body layer, tire side layer and steel wire ring were
respectively established based on the 26.5R25
refurbished radial tire, combining with its material
distribution model and using Pro/E Wildfire
software, then as shown in fig.1. Virtual assembly
was completed by using Pro/E Wildfire software
assembly module, and saved as IGES format, and
the steady-state temperature field of engineering
refurbished tires was analyzed by using ANSYS
Workbench finite element software, and imported
into ANSYS Workbench software, and the three-
dimensional geometry model is shown in fig.2
(Wang Jun, 2016; Wang Guolin, 2016; Qin Tao,
2016) .
1-Tread layer 2- Buffer layer 3-Belt-layer 4-Tire body
layer 5-Tire
side layer 6-Toe-mouth rubber layer 7- Steel wirering
Figure 1 3D geometry model and explosion model based
on Pro/E Wildfire software
Figure 2 3D geometry model based on ANSYS
Workbench software
3 THE FINITE ELEMENT MODEL
CONSTRUCTION OF
ENGINEERING REFURBISHED
TIRE STEADY-STATE
TEMPERATURE FIELD
The finite element model was created as shown in
fig.3, with 26,762 nodes and 14,333 units. Tread
layer, buffer layer, tire side layer and toe-mouth
rubber layer were simulated by Mooney Rivlin
model, and belt layer and tire body layer were
simulated by composite material layer unit, and steel
wire ring was simulated by physical unit. The heat
conductivity coefficient of each layer is shown in
tab.1, and the heat transfer coefficient of each layer
at different speeds is shown in tab.2. Initial
temperature was set as 20°C, and the measured tire
pressure and calculated temperature under different
speeds are as shown in tab.3. The speed of free
rotation working condition was 40 km/h, and
temperature loading model of 95 ° C tire inner cavity
temperature is as shown in fig.4 (Wang Ruoyun,
2016; Yan Shan, 2016).
Figure 3 Finite element model
Table 1 Heat conductivity coefficient of each layer
Tire
body
layer
Belt
layer
Buf
fer
laye
r
Tre
ad
laye
r
Tire
side
layer
Toe
mouth
rubber
layer
Tire
bead
Heat
conduc
tivity
coeffici
ent
W/m·°C
18.64 34.38 0.24 0.20 0.36 0.28 52.12
Table 2 Heat transfer coefficient of each layer surface at
different speeds
Speed
km/h
w
h
W/(m
2
·°C)
n
h
W/(m
2
·°C)
c
h
W/(m
2
·°C)
q
h
W/(m
2
·°C)
10 15.22 10.65 10.65 6.09
20 27.25 19.08 19.08 10.90
30 38.30 26.81 26.81 15.32
40 48.77 34.14 34.14 19.51
50 58.82 41.17 41.17 23.53
60 68.56 47.99 47.99 27.42
ICECTT 2018 - 3rd International Conference on Electromechanical Control Technology and Transportation
410
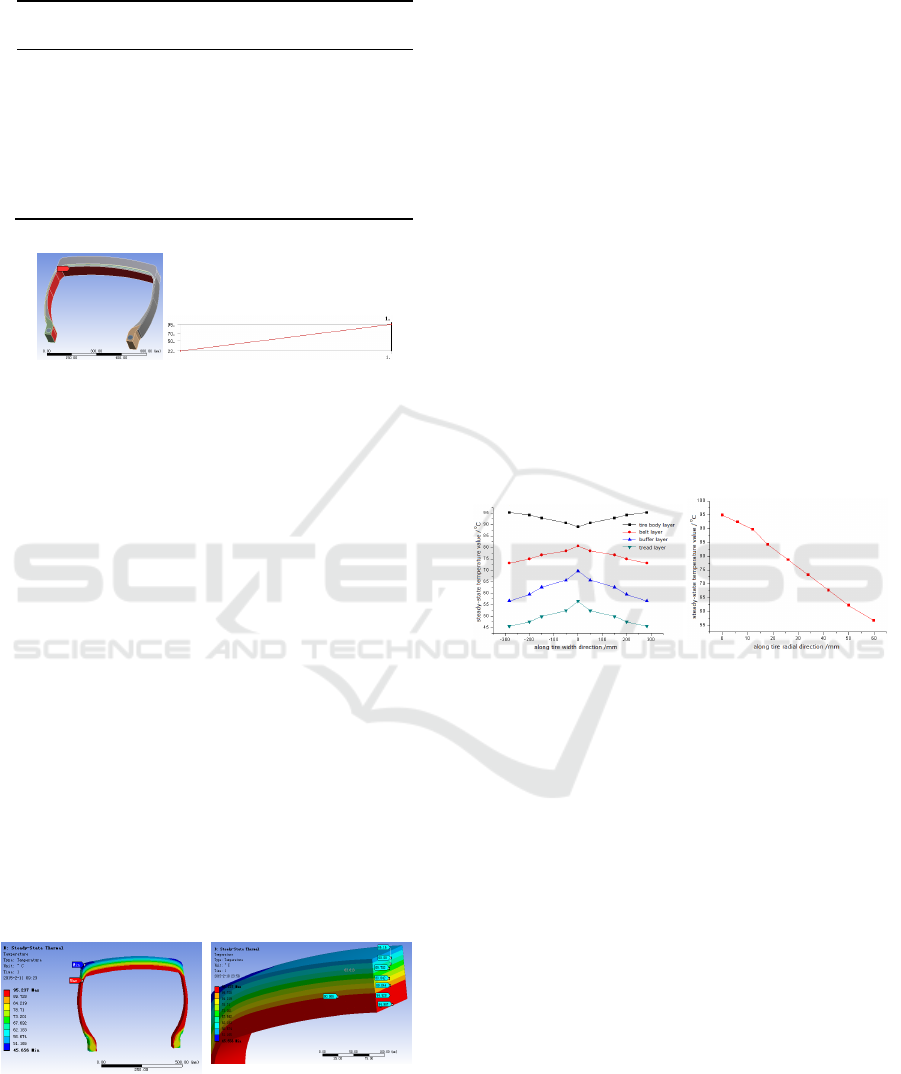
Table 3 The measured tire pressure and calculated
temperature at different turning speeds
Speed km/h
Measured tire pressure
kPa
Calculated inner
cavity air
temperature°C
10 465 30
20 498 51
30 534 75
40 565 95
50 572 99
60 584 107
Figure 4 Temperature loading model
4 SOLUTION AND ANALYSIS
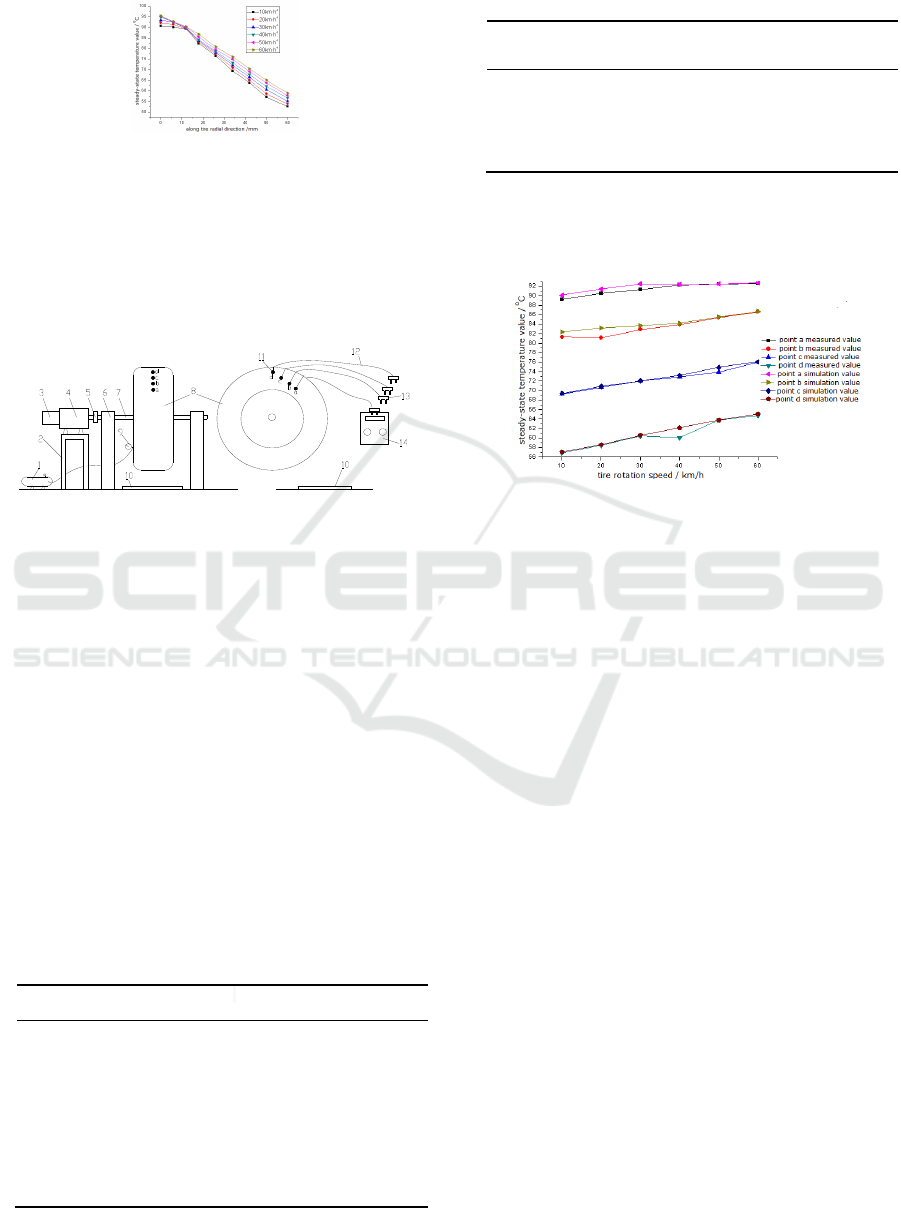
Fig.5 shows the distribution cloud graph of the tire
temperature field and the temperature distribution of
each layer along the radial direction of engineering
refurbished tires. The fig. 5 shows that the
temperature peak appeared inside tire body layer
near the shoulder (95.2°C), the lowest temperature at
tire shoulder of tread surface (45.6°C). The
simulation results show that the heat transferred
from the interior of the engineering refurbished tire
to the exterior, the tire body layer was composed of
a layer of steel wire curtain, whose heat conductivity
was relatively higher than that of rubber and whose
shoulder was the thinnest, so the temperature was
the highest. The shoulder rubber of tread layer was
much thicker and was not conducive to the diffusion
of heat, so the temperature was the lowest. In
addition, because of the tire side was a layer of steel
wire curtain fabric and a thin layer of rubber, thus its
temperature was also high.
Figure 5 Temperature distribution cloud graph of
temperature field and temperature distribution of each
layer along radial direction
Fig.6 shows the temperature distribution curve of
each layer along the width direction and radial
direction. It can be seen from fig.6 and fig.7 that the
temperature at the two sides of shoulder of the tread
body layer was the highest, and the temperature
gradually decreased to the cross section center; the
temperature at both sides of the belt layer, buffer
layer and tread layer along width direction was the
lowest, and the temperature gradually increased to
the cross section center, and among them the change
degree of the belt layer was not large, and the
temperature variation degree of buffer layer and
tread layer was larger. Along the radial direction, the
temperature gradually decreased from interior of the
tire body layer to exterior of the tread layer and
change trend was approximately linear. The
temperature peak of the tire side layer was at the
junction of the tire side layer and the toe mouth
rubber layer, and the temperature highest point of
the toe mouth rubber layer was at the junction of the
toe mouth rubber layer and the steel wire ring, then
the highest temperature of the steel wire ring was
located at the junction of the steel wire ring and the
toe mouth rubber.
(a) (b)
Figure 6 Each layer along width direction(a)and radial
direction(b)temperature distribution
Fig.7 shows the temperature variation curve of
the center line of the tire cross section along the
radial direction at different speeds. It can be seen
from fig. 8 that, with the increase of driving speed,
the temperature of any point of the refurbished tire
increased, and the temperature of the belt layer
increased by a minimum, the tire body layer was
secondary, and the temperature of the buffer layer
and the tread layer increased greatly. The results
show that, with the increase of the driving speed of
the tire, the heat was quickly introduced to the buffer
layer and the tread layer from the tire body layer
through the belt layer. Because the heat conductivity
of the rubber material in the buffer layer and the
tread layer was low, the temperature of this part had
risen sharply. If the heat could not be introduced into
the atmosphere in time, the adhesive force between
the tread layer and the buffer layer, and the buffer
layer and the belt layer would be reduced, even due
Temperature Rise Characteristic of Engineering Vehicle Refurbished Tire
411
to the high temperature effect, the failure of the tread
layer produced.
Figure 7 Temperature variation curves of tire radial
direction at different speeds
The test system composition is shown in fig.8,
and its mainly consists of air compressor 1, bench 2,
motor 3, reducer 4, coupling 5, bracket 6, rotation
axis 7, tires under test 8, tire pressure gauge 9,
platform 10, thermocouple 11, wires 12, plugs 13,
and a thermometer 14.
1- Air compressor 2- Bench 3- Motor 4- Reducer 5-
Coupling 6- Bracket7- Rotation axis 8- Tire under test 9-
Tire pressure gauge 10- Platform 11- Thermocouple 12-
Wires 13- Plugs 14- Thermometer
Figure 8 Composition of testing system
The tire pressure of 26.5R25 engineering
refurbished tire was 600kPa, the inner cavity stable
tire pressure testing results under different rotating
speed working conditions are shown in tab.4, the
steady-state temperature value of each layer is
shown in tab.5, the comparison curve of steady-state
temperature measured results and simulation results
is shown in fig.9, The measured value was close to
the simulation value, which verified the correctness
of the simulation model.
Table 4 The inner cavity stable tire pressure of
engineering refurbished tires under different rotation
speeds
Speed
km/h
Running time
h
Initial tire
p
ressure
k
Pa
Stable tire
p
ressure kPa
10 2 600 615
20 2 600 648
30 2 600 684
40 2 600 715
50 2 600 748
60 2 600 783
Table 5 The steady-state temperature value of engineering
refurbished tires under different rotation speeds
Speed
km/h
Temperature
of measured
point a °C
Temperature
of measured
point b °C
Temperature
of measured
point c °C
Temperature
of measured
point d °C
10
89.2 81.3 69.3 56.9
20
90.5 81.1 70.7 58.5
30 91.3 82.9 72.1 60.5
40 92.3 83.9 72.9 60.1
50 92.5 85.4 73.9 63.8
60 92.6 86.6 76.0 64.7
Stating: Measured points a,b,c and d respectively
represent the central section of tire body layer, the
central section of belt layer, the central section of
buffer layer, and the central section of tread layer.
Figure 9 Comparison curve of measured value and
simulation value of steady-state temperature distribution at
different rotation speeds
5 CONCLUSION
(1)Temperature was higher on both sides of the tire
shoulder of tire body layer, which gradually
decreased to the center of the cross section, and the
lowest temperature was at the both sides of the width
direction of belt layer, buffer layer and tread layer,
which gradually increased to the center of the cross
section, moreover, the changing degree of the belt
layer was not large, and the temperature variation
degree of buffer layer and tire layer was larger.
(2)With the increase of the running speed, the
temperature of any point of interior tire was all
increased, among them the temperature increasing
degree of the belt layer was the smallest, and the
layer of the tire body layer was the second, and the
temperature increasing degree of the buffer layer and
the tread layer was much larger.
(3)The maximum heat flux of the tire body layer
was near the shoulder part, the maximum heat flux
was on both sides of the width direction of the belt
layer and of the tread layer, the maximum heat flux
was on both sides of the width direction of the buffer
layer, the maximum heat flux was at the junction of
the tire side layer and the tire body layer, the
maximum heat flux was at the junction of the toe-
ICECTT 2018 - 3rd International Conference on Electromechanical Control Technology and Transportation
412

mouth rubber layer and the tire body layer, and the
heat flux in the middle part of the steel wire ring was
the largest.
(4)The heat from engineering refurbished tires
would gather at the junction of the shoulder position
and the various layers, therefore, it is necessary to
pay more attention to the close adhesion between the
shoulder position and the buffer layer and the tread
rubber. At the same time, the transition of the rubber
joint in each layer should be smooth, which reduces
the probability of the failure of the shoulder position
and each layer.
ACKNOWLEDGEMENTS
Project originating from: Heilongjiang Province
Natural Science Fund in 2015(E2015025)
REFERENCES
Liu Chundao. The Tire Refurbishment Industry Leads the
Future of Low-Carbon Energy Saving [J]. Modern
Rubber Technology,2016,42(02):9-14.
Sun Hongyan, Zhang Qianchuan. The Quality Control
and Inspection of Automobile Refurbished Tire [J].
Shandong Industrial Technology,2015,(22):30.
Ma Xiao.Tire Refurbishment Method[J].Tire Industry,
2015,35(01):23.
Wang Qiying, Li Zongjian, Zhou Yingmei, Hao
Lingzhong. A New Way Analysis to Giant
Engineering Machinery Tire Refurbishment[J].Rubber
Plastic Technology and Equipment, 2015,41(01):15-
20.
Wang Jun,Li Liang,Sun Lin and so on. Finite Element
Analysis of 245/70R16Tire [J]. The Tire Industry,
2016,36(09):520-528.
Wang Guolin, Tong Xin, Dong Zilong, Xu Haiqing. Study
on the Relationship between the Grounding
Characteristics of Radial Tire and Tire Crown
Temperature Field [J].Rubber
Industry,2016,63(05):276-280.
Qin Tao. Automatic Partitioning Program Research on
Tire Finite Element Grid [D]. Donghua University,
2016.
Wang Ruoyun. Study on Dynamic Mechanical Properties
of Tire Rubber Material Based on Finite Element
Analysis Technology [D]. Beijing University of
Chemical Technology, 2016.
Yan Shan,Wang Wei. Finite Element Analysis and
Experimental Study on Complex Tread Pattern Tire
[J]. Rubber Industry,2016,63(02):102-106.
Temperature Rise Characteristic of Engineering Vehicle Refurbished Tire
413
