
A Data Mining Service for Non-Programmers
Artur Pedroso, Bruno Leonel Lopes, Jaime Correia, Filipe Araujo, Jorge Cardoso and R ui Ped ro Paiva
CISUC, Dept. of Informatics Engineering, University of Coimbra, Portugal
Keywords:
Data Science, Data Mining, Machine Learning, Microservices.
Abstract:
Wit h the emergence of Big Data, t he scarcity of data scientists to analyse all the data being produced in
different domains became evident. To train new data scientists faster, web applications providing data science
practices without requiring programming skills can be a great help. However, some available web applications
lack in providing good data mining practices, specially for assessment and selection of models. Thus, in this
paper we describe a system, currently under development, t hat will provide the construction of data mining
processes enforcing good data mining practices. The system will be available through a web UI and will f oll ow
a microservices architecture that i s still being designed and tested. Preliminary usability tests, were conducted
with two groups of users to evaluate the envisioned concept for the creation of data mining processes. In these
tests we observed a general high level of user satisfaction. To assess the performance of the current system
design, we have done tests in a public cloud w here we observed interesting results that will guide us in new
directions.
1 INTRODUCTION
In a broad view, data mining is th e pro cess of disco-
vering interesting patterns and knowledge from large
amounts of data (Han et al., 2011). However, for
the correct app lica tion of data m ining p rocesses and
also for the evolution of the field, c ompetent data
scientists are required, a resource in high demand
these days (Henke et al., 2016; M iller and Hughes,
2017). To fill such demand, more data scientists need
to be trained, which requires time due to the diver-
sity of discipline s to learn(Cao, 2017). Thus, by a b-
stracting somehow pro gramming languages from the
data scientist’s path, we might reduce the necessary
time to train them.
Having the data mining process in mind, we deci-
ded to create a system that allows users to build work-
flows re presenting the data mining pro cess. It will b e
available through a web UI providing good usability
heuristics (Nielsen, 199 4), and gu iding the user in th e
creation of data mining processes without requir ing
programming skills.
The user will be able to create expe riments based
on workflows compo sed by sequential data mining
tasks. These tasks will allow data insertion , prepro-
cessing, feature selection, model c reation and model
evaluation. Some tasks will include parameters that
can be used in grid search along with nested c ross
validation enforcing good model a ssessment and se-
lection practices (Cawley and Talbot, 2010).
To evaluate th e envisioned system, we cre ated a
first prototype and conducted usability tests using a
group of users familiar with data mining frameworks,
and another group of users without experience with
related tools, though having a background in statis-
tics, whom can also benefit with our software. We ob-
served an overall positive user satisfaction with both
groups.
To evaluate the imp act of the current microservi-
ces architecture in the perfor mance of the system, we
deployed it in a public cloud and realised tests using
datasets with different sizes. The results are interes-
ting and an incentive to guide us in new directions.
The remaining document is organ ised as f ollows.
In Section 2, we analyse related re search and applica-
tions. In Section 3, we present an overview of the en-
visioned user interface and the system architecture. I n
Section 4, we present prelimin a ry experiments done
and the respective results. Finally, in section 5 we
draw the main conclusions of this work and po int o ut
future research directions.
2 RELATED WORK
Some applications in production already provide the
creation of data mining processes without requiring
340
Pedroso, A., Lopes, B., Correia, J., Araujo, F., Cardoso, J. and Paiva, R.
A Data Mining Service for Non-Programmers.
DOI: 10.5220/0007226003400346
In Proceedings of the 10th International Joint Conference on Knowledge Discovery, Knowledge Engineering and Knowledge Management (IC3K 2018) - Volume 1: KDIR, pages 340-346
ISBN: 978-989-758-330-8
Copyright © 2018 by SCITEPRESS – Science and Technology Publications, Lda. All rights reserved
users to hold prog ramming skills.
Azure Machine Learning Studio
1
is a publicly
available software-as-a-service solution that allows its
users to cre a te data mining workflows by dragging
blocks that represent data mining tasks into a working
area.
RapidMiner Studio
2
and Orange
3
provide the
same concept as Azure Machine Learning Studio for
the creation of data mining processes. However, th e se
are local solutions.
The thre e previous tools require users to create
complex workflows to assess the performance of mo-
dels including different tasks and parameter s. Cross
validation in Az ure and Orange is just applied to the
model creation phase and do es not include prior o pe-
rations like feature selection which is a b a d practice
for estimating the model’s perfo rmance (Cawley and
Talbot, 2010).
H2O Flow
4
offers a fully distributed in-memory
ML open source platform that can be deployed in
clusters. The platform can be used from a web UI that
gives the possibility to apply machine learning (ML)
in a sequence of steps without requ iring users to have
programming skills. However the user is limited to
uploading datasets an d building models using the pro-
vided ML algorithms. Other data mining tasks (e.g.,
feature selec tion) are not available .
Weka
5
is a local solu tion that e nables the app lica -
tion of data mining task s to datasets. It can be c ome
complex to build da ta minin g processes composed of
multiple tasks and paramete rs.
(Kranjc et al., 2017) and (Medvedev et al., 2017)
are both researc h projects to provide cloud solutions
for the crea tion of data mining processes through a
web UI employin g similar concepts (drag-and-drop)
as Azure, RapidMiner and Orange. Both systems do
not solve the problems exposed by the p revious sys-
tems.
Besides RapidMiner, none of the above applicati-
ons provide the insertion of a data mining experiment
in a (ne sted) cross validation loop. It is also com -
mon to see in some of the previous systems that cross
validation is applied o nly to the final mode l without
including prior tasks, such as feature selection in the
loop, which is a bad practice (Hastie et al., 2001; Ca-
wley and Talbot, 20 10).
Adding to the problems abovementioned, none of
these systems g uide the user in the d ata mining pro-
cess.
1
https://studio.azureml.net/
2
https://rapidminer.com/products/studio/
3
https://orange.biolab.si/
4
https://www.h2o.ai/
5
https://www.cs.waikato.ac.nz/ml/weka/
Having in mind these limitations, the following re-
quirements will be addressed in our system:
• Provide a web UI with good usability for non-
programmers to execute data mining tasks.
• Guide the user in the creation of a data mining
process.
• Provide different da ta preprocessing methods, fe-
ature selection and machine learning algorithms.
• Allow the crea tion of data min ing experiments in-
cluding different tasks, feature s and pa rameters
for evalu ation and selection of the best model (th e
one with “best” features and parameters). Here,
good data mining practices will be guaranteed,
e.g., nested cross validation.
• Provide an applicatio n accessible from the cloud
where data mining workflows can b e left running
and accessed later.
• Provide a scalable system to support a large num-
bers of simultaneous users.
3 DESIGN AND
IMPLEMENTATION
In this section we proc eed to present the user interface
that was used in the usability tests and the architecture
as it is at the mom e nt.
3.1 User Interface
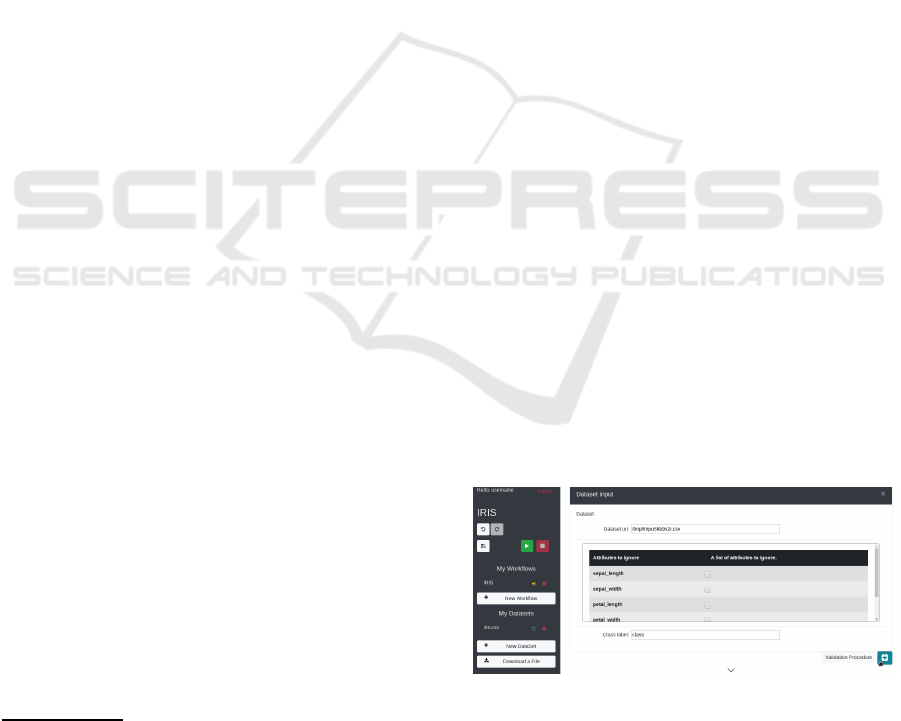
The UI is divided in two key areas, as we can see in
Figure 1. The darker area on the left includes operati-
ons for creation and retr ieval of workflows and data-
sets. It also enables the execution and interruption of
workflows that are built on the right are a.
Figure 1: User interface - showing a dataset insertion task
and the option to insert a validation procedure after clicking
the plus button.
The area on the right is wher e the user builds the
workflow insertin g tasks that com pose a data mining
process.
A Data Mining Service for Non-Programmers
341
To guide the user in the data mining process, the
tasks are available for insertion according to a predefi-
ned grammar that is presented next in EBNF notation:
start = dataset_input val_procedure
val_procedure = ((assessment_method _1
{(preprocessin g_1 | feature_selecti on_1)}
create_model) | ( asse ssment_method_2
(preprocessing _2 | feature_selectio n_2 |
create_model)) )
preprocessing_ 1 = "preprocessing_method"
{val_procedure _1}
feature_select ion_1 = "feature_sele ction_algorithm"
{val_procedure _1}
preprocessing_ 2 = "preprocessing_method"
{val_procedure _2}
feature_select ion_2 = "feature_sele ction_algorithm"
{val_procedure _2}
create_model = "machine_learning_al gorithm"
"eval_metrics"
assessment_met hod_1 = "cross_valida tion" |
"hold_out" | "t_v_t"
assessment_met hod_2 = "use_entire_d ata"
dataset_input = "dataset_input"
val_procedure_ 1 = (preprocessing_1 |
feature_select ion_1)
val_procedure_ 2 = (preprocessing_2 |
feature_select ion_2 | create_model)
In this grammar, the terminals are between dou-
ble quotes. These are sp ecific tasks to be executed
and m ight have different representatio ns. For exam-
ple, “preprocessing
method” might be a z-score nor-
malisation or a min-max normalisation task.
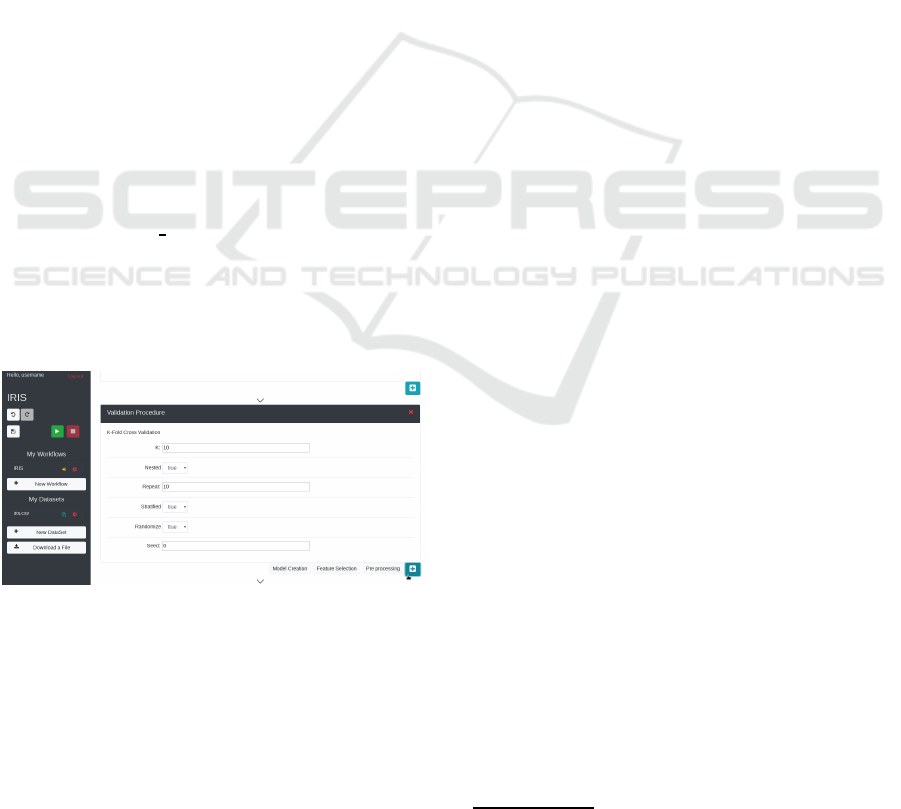
In Figures 1 and 2 we show that when the user
clicks the plus button to add a new task, depending on
the current state of the workflow, s/he only sees the
tasks according to the previous grammar.
Figure 2: UI - Showing cross validation task (a validation
procedure task) and the tasks that can be used after.
In summary, the six types of task that can be used
in the workflow are the following:
• Dataset Input: a unique task where the user spe-
cifies the data set to use. S/he can also choose to
remove features during this step.
• Validation Procedure: contains tasks that spe-
cify a method to be used in the creation of the
data mining proce ss. The user can define if
the next tasks should be included in an a sses-
sment/selection process (e.g., cross validation), or
if the tasks should be created using all data.
• Preprocessing: contains tasks that apply transfor-
mations to attribute values (e.g., z-scor e normali-
zation).
• Feature Selection: contains tasks to assess the
relevance of featur es for selection (e.g., Relieff).
• Model Creation: contains tasks for the creation
of models using different algorithms (e.g., Sup-
port Vector Machine (SVM )).
• Model Evaluation: contains tasks that spec ify
the metrics to use for performance evaluation
(e.g., recall and precision).
3.2 Architecture
The previous UI is part of a microservices architecture
that we illustrate in Figure 3.
In this arch itec ture, a user can acce ss the UI
through the UI Service that provides a web applica-
tion written in ReactJS, fr om which further req uests
are done to our API Gateway that redirects the reque-
sts to different services accordingly.
The Tasks Serv ic e returns representations of d a ta
mining tasks that can be used to comp ose the seq uen-
tial data mining workflow.
The User Service enables users to login with a
username and a password and holds information re-
lated to users.
The Templates Service contains predefined tem-
plates of d ata mining workflows useful for certain
data and business dom ains.
The Datasets Service stores uploade d datasets in a
central file system (Network File System (NFS)) and
also returns data from the NFS accordin g to users’
requests. The MongoDB in D a ta sets Service is used
to store metadata related to uploaded datasets.
Then, we have the Workflows Service that trans-
lates sequential workflows sent by user s to a repre-
sentation that is understandable by Netflix Conduc-
tor
6
. The new representation is sent to the Conductor
Service that employs Netflix Conductor, an d becomes
available to be processed by different Data Science
services/workers. The Workflows Service is also con -
tacted to return the status of workflows sent by users.
By using the Netflix Conductor technology we
can organise the tasks in a certain sequence and the
Data Scien c e services can pull the scheduled tasks
and work on them in p arallel and inde pendently, fol-
lowing a com peting consumers pattern (Hohpe and
6
https://netflix.github.io/conductor/
KDIR 2018 - 10th International Conference on Knowledge Discovery and Information Retrieval
342
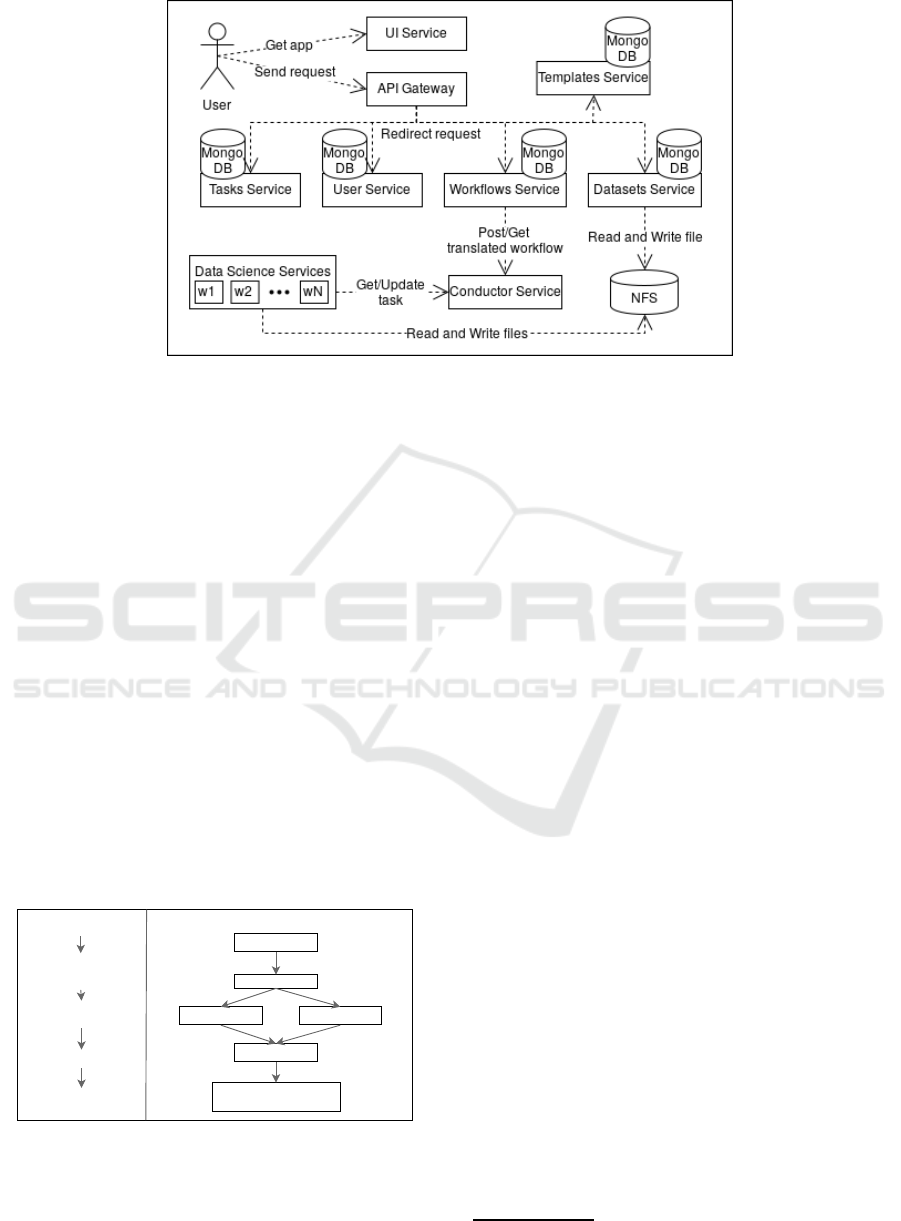
Figure 3: Current system’s architecture.
Woolf, 2003). Netflix Conductor a llows that tasks ap-
pearing ahead in a workflow’s path are executed just
after the prior tasks have been executed.
The Data Science Services are multiple fine
grained services/workers that work on specific data
science tasks pulled from the Conductor Service.
These D a ta Science Services share files (e. g., data-
sets, models) between them by writing and reading
to/from the NFS.
The communications between all the services pre -
sented in the architecture a re performed using th e
HTTP pr otocol, mainly through REST APIs. A ll the
services can be scaled out independently.
To better u nderstand how individual da ta science
tasks are processed in the system, in Figure 4 we pre-
sent an examp le of a translation from a sequential
workflow sent by the user (on the left), to its repre-
sentation in Netflix Conductor (on the right). This
translation abstracts users from the creation o f com-
plex workflows, which is an advantage over other sy-
stems such as Azure ML Studio, as abovementio ned.
Dataset input
Train-Test
validation
procedure
Feature Scaling
SVM
Classification
performance
Split Dataset
Feature scaling
Feature scalingSVM creation
SVM prediction
Calculate classification
performance
Figure 4: Example of a data mining workflow translation.
The sequential workflow sent by the u ser contains
the location of the dataset to use, the procedure to eva-
luate the process ( hold out / train-test method), a fea-
ture scaling task that is followed by a model creation
task using the SVM algorithm, an d finally there is a
task to show the classification perform ance o f the pro-
duced model.
Upon receiving the workflow, the Workflows Ser-
vice translates it to the Netflix Conductor representa-
tion. In the new representation, the flow starts with
a Split Data set task (split original data into training
and test sets), followed by a fea ture scaling task (ap-
plied to the training set). Then, an SVM creation task
(applied to the p rocessed training set) and a feature
scaling task (a pplied to the testing set and using info
from the p revious feature scaling task) can be handled
in parallel. The SVM pre diction task (applied to the
processed test set and using the model created before)
appears next, and finally, we have a task to compute
the classification perf ormance of th e model. It is nor-
mal that tasks appearing ahead in the workflow use
data produced in preceding tasks.
4 EXPERIMENTS
In this section we present the tests done with a first
prototy pe of the system dep loye d on a cluster in Goo-
gle Kubernetes Engine
7
. For that we used 4 instances
with 2 vCPUs and 7.5GB of RAM each.
4.1 Usability Tests
4.1.1 Setup
The usability tests provided a crucial role in evalu-
ating the prototype and validating the paradig m of
7
https://cloud.google.com/kubernetes-engine/
A Data Mining Service for Non-Programmers
343
1 1,5 2 2,5 3 3,5 4 4,5 5
You understood the exercises that were assigned
Doing the exercises was a pleasant experience
This application is relevant to solve problems like
the Iris one
The application is attractive
The design is easy to understand
It was easy to find the required functionalities
The application met my expectations
Learning how to use this application was easy
You would use this application again to solve
similar problems
Would recommend this application to a colleague
Questionnaire results
TYPE A TYPE B
Figure 5: Average and standard deviation of the users’ responses.
constructing data mining processes using sequential
tasks. The tests consisted in having the users exe-
cute a few exercises using th e interface and getting
their feedback. This fee dback was then used to evalu-
ate the users’ experience, the usability of the interface
and the value that was provided to them, hence vali-
dating the concept.
We divided the users in two types:
• Type A: Users with no experie nce with data mi-
ning sy stems and no knowledge in data mining or
programming languages (8 users).
• Type B: Users w ith experience in d ata mining sy-
stems (mainly Orange), with knowledge in data
mining but without prog ramming skills (11 u sers).
The usability tests started with a quick overview
of the platform and its functionalities, which took less
than 3 minutes. After this introduction and question
answering, we gave the users a script with a few exe-
rcises estimated to be solved in less than 20 minutes.
In the end we gave a questionnaire that the users had
to fill abo ut their experience, and their thoughts on the
relevance of the system.
To keep the tests simple we dec ided to ask the
users to make six exercises using the iris flower da-
taset (Anderson, 1936).
The exercises were simple and intertwined, ma-
king the user have a feeling of progress during their
execution.
Briefly, the exercises that we asked them to per-
form were the following:
1. To scale the attributes of the dataset betwee n the
values 0 and 1.
2. To create an SVM model and to use the hold-out
proced ure to assess the m odel per formance. Also
verify the accuracy and f-measure of the produced
model.
3. Same exercise a s before, however including a fea-
ture scaling o peration before model creation. This
was conducted to verify whe ther the user was
aware that tasks could be crea te d and rem oved in
the middle of a workflow previously created.
4. To perform feature selection using the Relieff al-
gorithm and different numbers of fea tures to see
which attributes would have the most predictive
capabilities.
5. To build an SVM model prec e ded by feature sca-
ling using the teo best features discovered in the
previous exercise and to use cr oss validation to va-
lidate the model.
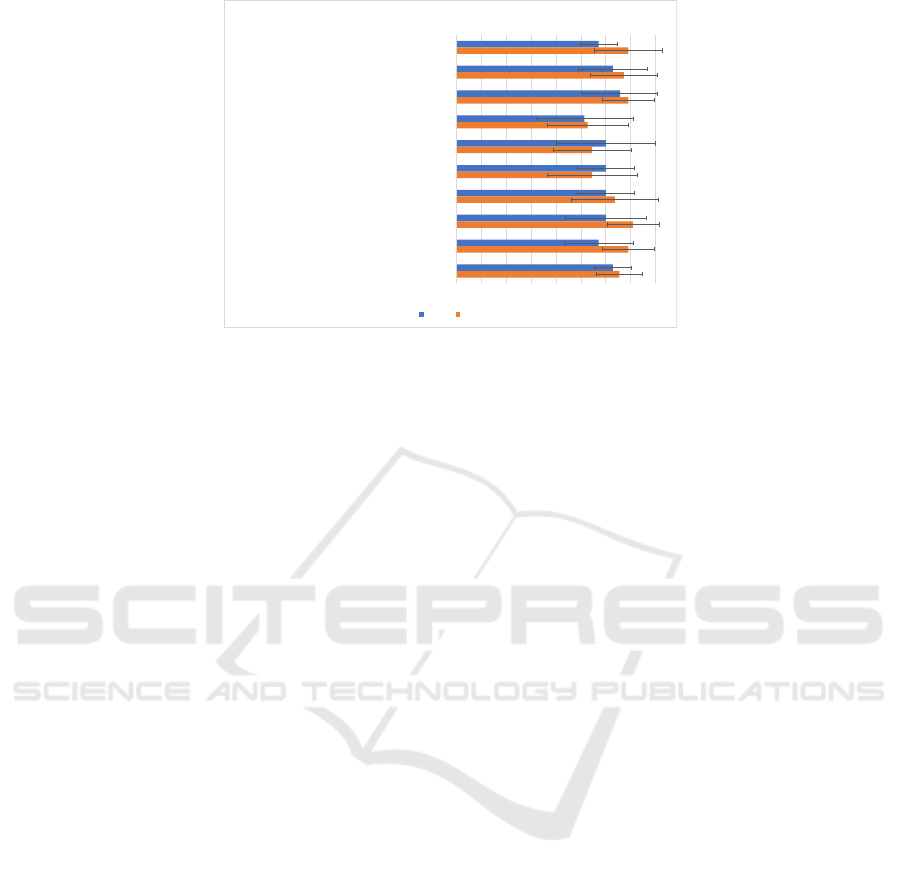
4.1.2 Results
After performing the tests we asked the users to fill a
questionn aire, which allowed us to know how much
the users liked the interface, their experience using
the tool and if they found it useful. Each statement
could be answered as: totally disagree, disag ree, inde-
cisive, agree and totally agree . To analyse the average
response and the standard deviation we converted the
answers to num bers, where number 1 translates to “to-
tally disagre” and 5 to “totally agree ”.
As seen in Figure 5 the values are all above
average. The most satisfactory results were that users
found the interface easy to use, they would recom -
mend it to colleagues and that they would use it again
to solve related prob le ms. The attractiveness of th e in-
terface, even though it was very positive, scored lower
than the other metrics; this was expected since this is a
prototy pe and that part was not a priority. The results
acquired from typ e A users are lower than the ones
from type B. This showed that the users with no expe-
rience (type A) had more difficulty using the interface
which was expected, but surprisingly they found ea-
KDIR 2018 - 10th International Conference on Knowledge Discovery and Information Retrieval
344

sier to find the required functionalities and the design
simpler to understand.
Besides answering the questionnaire the users also
had a place to write sug gestions, critiques and what
they liked the most in the application. This feedback
reinfor c ed what was discovered during the question-
naire and it was very satisfactory. None o f the criti-
ques were about the conc ept we aim to prove and the
things they liked the most were inline with the objecti-
ves we tried to achieve when building the application.
4.2 Computational Performance Tests
Basic preliminary computational performance tests
were done to assess how the system will behave with
the current architecture. We executed tests using two
randomly generated numerical da ta sets with a binary
response class: Dataset 1 containing 10000 rows and
1001 columns (34.2 MB) a nd Dataset 2 with 20000
rows and 100 1 columns (68.4 MB).
Using each dataset we created 10 times a Na¨ıve
Bayes model and evaluated its classification perfor-
mance using 10-fold cross validation.
As a baseline, we performed the same experiments
with H2O deployed in an equal cluster.
The results can be seen in Figure 6.
0,00
50,00
100,00
150,00
200,00
Dataset 1 Dataset 2
Time (sec.)
Time to execute a data mining job
Our system
H2O
Figure 6: Tests performed with our system and H2O.
It ca n be seen that o ur system is slower in the pre-
liminary tests, but this is nothing we were not ex-
pecting, as we are storing intermedia te results in a
centralised disk using NFS, while H2O stores them
in memory. We will address th is issue in the future.
5 CONCLUSION
We presented a service for non-programmers to per-
form data mining experiments employing good ma-
chine learning / data mining practices. We prototy-
ped a c loud application following a microservices ar-
chitecture with an interface that aim s to achieve high
usability metrics.
To evaluate a first prototype and validate the
paradigm of visu a l programming using sequential
tasks we made experiments with experienced and
non-experienced users which provided us satisfactory
feedback.
Future works will include not only more usability
tests with experienc ed users to improve the user inte r-
face in aesthetics and fu nctionality te rms, but mainly
the investment in optimising the current architecture,
which might include exploring the storage of interme-
diate results in memory and other techniques that can
produce results faster.
ACKNOWLEDGEMENTS
This work was c a rried out under the project
PTDC/EEI-ESS/1189/2014 Data Science for Non-
Programmers, supporte d by COMPETE 2 020, Portu-
gal 2020-POCI, UE-FEDER a nd FCT.
REFERENCES
Anderson, E. (1936). The species problem in iris. Annals
of the Missouri Botanical Garden, 23:457–509.
Cao, L. (2017). Data science: A comprehensive overview.
ACM Comput. Surv., 50(3):43:1–43:42.
Cawley, G. C. and Talbot, N. L. (2010). On over-fitting in
model selection and subsequent selection bias in per-
formance evaluation. Journal of Machine Learning
Research, 11(Jul):2079–2107.
Han, J., Pei, J., and Kamber, M. (2011). Data mining: con-
cepts and techniques. Elsevier.
Hastie, T., Tibshirani, R., and Friedman, J. (2001). The Ele-
ments of Statistical Learning. Springer Series in Sta-
tistics. Springer New York Inc., New York, NY, USA.
Henke, N., Bughin, J., Chui, M., Manyika, J., Saleh, T.,
Wiseman, B., and Sethupathy, G. (2016). The age of
analytics: Competing in a data-driven world. McKin-
sey Global Institute, 4.
Hohpe, G. and Woolf, B. (2003). Enterprise Integration
Patterns: Designing, Building, and Deploying Messa-
ging Solutions. Addison-Wesley Longman Publishing
Co., Inc., Boston, MA, USA.
Kranjc, J., Ora, R., Podpean, V., Lavra, N., and Robnik-
ikonja, M. (2017). Clowdflows: Online workflows for
distributed big data mining. Future Generation Com-
puter Systems, 68:38 – 58.
Medvedev, V., Kurasova, O., Bernataviien, J., Treigys, P.,
Marcinkeviius, V., and Dzemyda, G. (2017). A new
web-based solution for modelling data mining proces-
ses. Simulation Modelling Practice and Theory, 76:34
– 46. High-Performance Modelling and Simulation
for Big Data Applications.
A Data Mining Service for Non-Programmers
345

Miller, S. and Hughes, D. (2017). The quant crunch: How
the demand for data science skills is disrupting the job
market. Burning Glass Technologies.
Nielsen, J. (1994). Enhancing the explanatory power of usa-
bility heuristics. I n Proceedings of the SIGCHI Confe-
rence on Human Factors in Computing Systems, CHI
’94, pages 152–158, New York, NY, USA. ACM.
KDIR 2018 - 10th International Conference on Knowledge Discovery and Information Retrieval
346
