
Relationship between Landscape Pattern and Environmental Indices
in Ebinur Lake Wetland National Natural Reserve
Fei Zhang
1,2,*
, Yushanjiang Ayinuer
1,2
, Hsiang-te Kung
3
and Ping Shi
4
1
Key Laboratory of Smart City and Environmental Modeling of Higher Education Institute, College of Resources and
Environment Sciences, Xinjiang University, Urumqi, 830046, PR China;
2
Key Laboratory of Oasis Ecology, Xinjiang University, Urumqi 830046, China;
3
Department of Earth Sciences, The University of Memphis, Memphis, TN 38152, USA;
4
School of Foreign Languages, Jining Medical University, Jining, Shandong 272067 Urumqi, 830046, PR China.
Email: zhangfei3s@163.com
Keywords: Land use/cover, remote sensing, CA-Markov model, simulation and forecast, ecological environment
quality index, Ebinur Lake Wetland Nature Reserve
Abstract: The study of spatial-temporal changes of the landscape is important in revealing the mechanisms and laws
of landscape succession, and to search the relationship between human activities and the environment. This
paper presents a research of land use/cover change (LUCC) from 1998 to 2006 and from 2006 to 2014; it
also simulates and forecasts land use/cover types of Ebinur Lake Wetland National Nature Reserve
(ELWNNR) by using the CA-Markov model. The purposes of this study were determined to the
characteristics of landscape patterns in different altitudes. Results showed that: (1) LUCC was “three plus
three minus” in ELWNNR. The bared lakebed and desert obviously expanded; land use/cover dynamic
degree was 9.5% from 1998 to 2006 for bared lakebed; and 34.1% from 2006 to 2014 for desert. The
transform area of land use/cover type would smaller from 2022 to 2030; (2) There were significant
correlations between environment quality indices and the landscape indicators; the composition and spatial
structure of the landscape affected the spatial distribution of environment quality indices; (3) The R
2
of
multiple linear stepwise regression model of environmental quality indices and landscape indices in the
study area was 0.7, which suggested significant correlation between these two indices. It proved that it is
feasible to estimate the environmental quality indices of the study area by landscape indices. The quantified
effects of landscape structure variations on this index helped to better understand the effects of land use on
it and they are important for policy making and land use planning.
1 INTRODUCTION
Land use/cover change (LUCC) is one of the most
important consequences of global change; the
impact of LUCC on the watershed’s water cycle has
always been an essential part in the study about
global change and hydrology (Xia et al., 2006).
Establishing a simulating model is an effective and
reliable measure to describe, explain and
reappearance of LUCC in the past, as well as
forecast LUCC in the future to formulate
countermeasures (Han et al., 2011; Veldkamp et al.,
2001). The study of LUCC is of great significance
for understanding the stability of environment and
the sustainable utilization of water and land
resources (Wang et al., 2015; Chen et al., 2015; Tsai
et al., 2015). Reasonable land use/cover-landscape
changes can produce favorable environmental
effects, while excessive reclamation of ecosystems
can lead to a series of environmental problems, such
as desertification, vegetation degradation, reduction
of water area and so on (Brun et al., 2015; Hansen et
al., 2007; Ye et al., 2015). Therefore, the
environmental effects, which are caused by land
use/cover-landscape changes, have become an
important topic in this field. Furthermore, the
application of statistics (Moghadam et al., 2015;
Zhao et al., 2015), GIS and RS technology (Chen et
al., 2015), landscape ecology models (Wang et al.,
132
Zhang, F., Ayinuer, Y., Kung, H-t. and Shi, P.
Relationship between Landscape Pattern and Environmental Indices in Ebinur Lake Wetland National Natural Reserve.
In Proceedings of the International Workshop on Environment and Geoscience (IWEG 2018), pages 132-138
ISBN: 978-989-758-342-1
Copyright © 2018 by SCITEPRESS – Science and Technology Publications, Lda. All rights reserved
2009; Zeng., 2014; Paroissien., 2015) provide the
practical and theoretical framework.
The landscape pattern indices are objectively
used to evaluate the environment, because it is easy
to obtain and almost undisturbed by human factors.
Currently, the academic circles are mainly focus on
the changes in land use/cover-landscape patterns and
the effects of natural factors on environment
(Camacho et al., 2015; Vadrevu et al., 2015; Conrad
et al., 2015; Bing et al., 2015; Terra., 2014);
meanwhile there is less research on the correlation
analysis, which is based on landscape pattern and
environment quality. The ELWNNR is the most
representative wetland desert in China. Affected by
geography, climate and human activities, this
ecosystem is fragile; water and soil resources are
scarce, and the unreasonable distribution of
landscape patterns and human interference have
caused a series of negative environmental effect on
ecology (Lu et al., 2014). Consequently, research
based on the regional landscape pattern will be
crucial for monitoring the indicators and
implementing managing strategies for sustainable
development. Therefore, the purpose of the study is
to: i) analyze the current and future changes in land
use/cover in ELWNNR; ii) quantitatively study the
relationship between land use/cover patterns and the
environment to provide theoretical support for
conservation purposes and sustainable development
of agriculture in the region.
2 MATERIAL AND METHODS
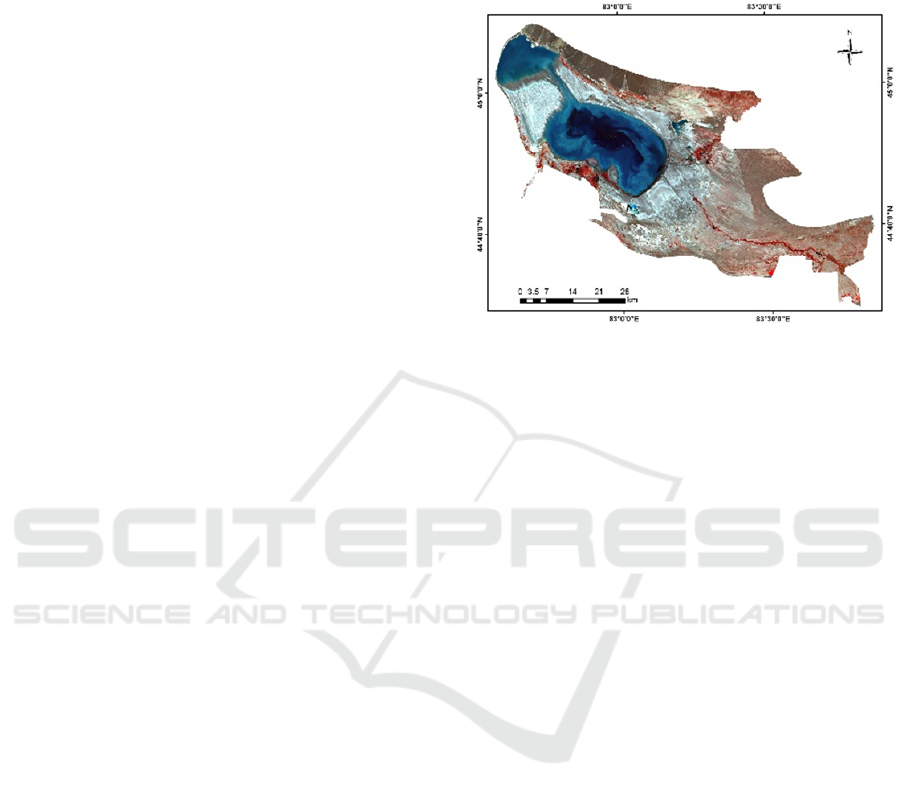
2.1 Study Area
The study area has a total surface of about 2670.85
km
2
(Figure 1). This region represents the lowest
depression and water-salt collection center in the
western Junggar basin. It is in the hinterland of the
Eurasian continent and integrates wetlands and
deserts, representing one of the key areas in that
basin (Xie et al., 2010). The average annual
temperature of the ELWNNR is 8°C, characterized
by low rainfall, and greater evaporation than
precipitation. With the typical temperate and arid
continental climate, the ELWNNR is a typical
ecologically fragile zone. The lake area is rich in
habitat types and is one of the few concentrated
areas of desert species in the inland desert (Wang et
al., 2015). At present, the environment of the region
has been seriously damaged and the balance of
ecosystems has been seriously affected.
Figure 1: Location map of ELWNNR.
2.2 Data Acquisition and Methods
Landsat 7 TM and Landsat OLI images from the
ELWNNR were used in this study, that were
acquired in September 1998, July 2006 and
September 2014 (data from the U.S. Geological
Survey, URL: http://earthexplorer.usgs.gov/website).
The track number of the satellite images is 146/29.
Images were pre-processed, performing geometric
correction, radiation correction and image
enhancement under the support of ENVI 5.1
software. Then, remote sensing images were clipped
to center in the study area. Supervised classification
and visual interpretation were used to classify each
of the land use/cover types, that were divided into
six categories: water body, forest grassland, dry lake
bed, saline alkali land, desert, and others. Then, that
classification was verified by combining a
topographic map, a DEM and Google Earth. The
land use/cover classification map was developed for
the three years 1998, 2006 and 2014 and the overall
accuracy of the three remote sensing images were
above 89%.
2.3 The Dynamic Simulation of Land
Use/Cover Types
In this study, the classified images from 1998, 2006
and 2014 were selected in this study as input into the
model to calculate matrices of conversion areas and
conversion probabilities. A transition areas matrix
expresses the total area (in cells) expected to be
changed in the next time. Also, a transition
probability matrix determines the probability of a
Relationship between Landscape Pattern and Environmental Indices in Ebinur Lake Wetland National Natural Reserve
133
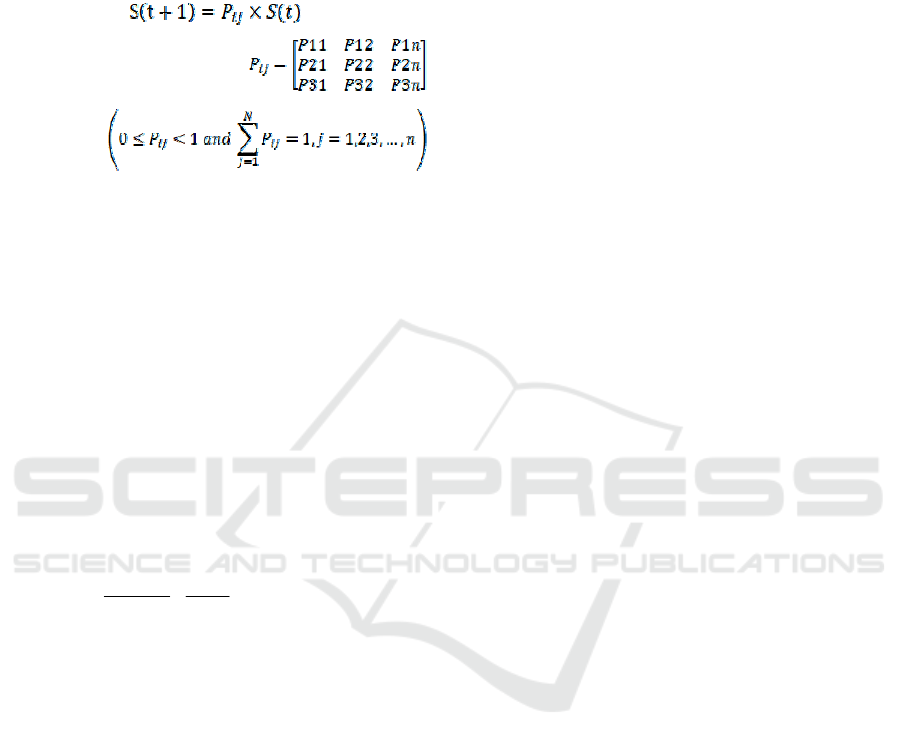
pixel in a land use class to change into another class
during that time. The prediction of future land use
changes can be calculated based on conditional
probability formula by using the following equation:
and
(1)
Where S(t) is the state of the system at time t; S(t
+ 1) is the state of the system at time (t + 1); Pij is
the matrix of transition probability in a state (Al-
sharif and Pradhan, 2013). The output of CA–
Markov algorithm is the predicted land cover map
for mentioned future year.
2.4 Dynamic Degree of LUCC
The rate of LUCC is an important index to reflect
the intensity of regional land use change. A dynamic
degree indicates the stability of the land use type and
is represented in percentage. Land use dynamic
models are usually divided into both single and
comprehensive degree. The single land use dynamic
can be formulated as follows:
21
121
1
100%
tt
t
AA
k
Att
(2)
Where k represents the dynamic degree of a
certain land use and % is the unit, At1 and At2
represent the area of various land use types at the
beginning of the and the end of the study; t1and t2
are the initial and final stages of the change.
2.5 The Selection and Calculation of
Landscape Indices in ELWNNR
Landscape indices are widely used in the analysis of
many landscape patterns. It can provide a lot of
information as well as it can reflect the
characteristics of its composition and spatial
configuration (Wu, 2007). In this research, Frag
stats 4.2 were used to compute landscape pattern
indices in the study area, PLAND (Landscape types’
percentage), PD (patch fragmentation), mean patch
size (MPS), Largest Patch Index (LPI), ED (edge
density), area - weighted mean patch highest-
resolution dimension (AWMPFD), COHESION
(plaque connection degree), AI (aggregation degree
of plaques) were selected on the class level to assist
with the exploration of the landscape characteristics
in this study; meanwhile, number of patches (NP),
ED (edge density), Landscape Shape Index, (LSI),
Largest Patch Index (LPI), COHESION (plaque
connection degree), AI (aggregation degree of
plaques) and SHDI (Shannon diversity Index),
CONTAG (spreading Index) were selected on the
landscape level to obtain the differences among the
landscape metrics in the different land use/cover
classifications for the entire ELWNNR. The
concepts, calculation methods and ecological
significance of these indices were summarized by
Wu (2007).
2.6 Environment Quality Indices
The overall status of a regional environmental
quality is comprehensively the total area
environment quality indices Et (Liu et al., 2003); it
is obtained by considering the area ratio of each land
use/cover type and the weighted sum of relative
ecosystem service values; its expression is:
1
/
n
tii
i
EACTA
(3)
Where Ai is the land use/cover type area of Class
i in the study period T; Ci is the service value of the
relative ecosystem of land use/cover type of Class i;
n is the number of land use/cover types in the study
area; TA is the total area of the region.
3 RESULTS AND ANALYSIS
3.1 Spatio-Temporal Change of Land
Use/Cover Pattern in Ebinur Lake
The most significant change can be observed in the
water area. According to the statistical annual book
from 1998 to 2006, the precipitation has increased
(Figure 2). In 2004, the government implemented
the increase water project of the Ebinur Lake, which
eventually led to the increase of the water body from
1998 to 2006 (Bai, 2010). However, the extension of
the area occupied by water, showed a decreased
from 2006 to 2014. This fact was partly due to the
massive reclamation of land and the rapid increase
of the cultivated land. Meanwhile, Bortala, Jinghe
and Kuitun rivers were used for irrigation and
IWEG 2018 - International Workshop on Environment and Geoscience
134
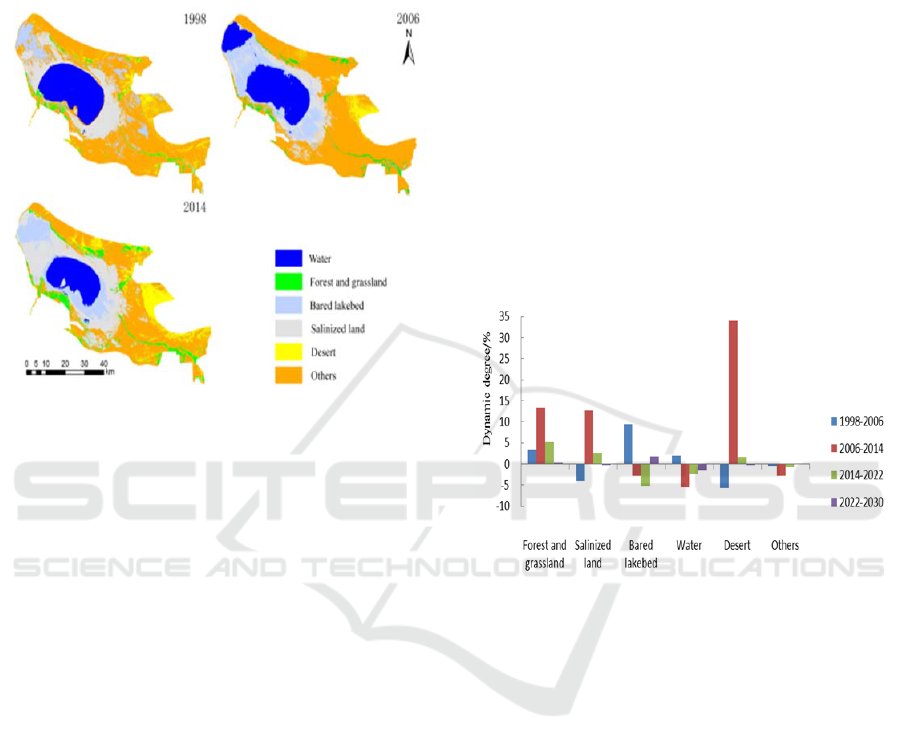
resulted in the decrease of water in Ebinur Lake and
increase of bared lake bed. Furthermore, the desert is
expanding as a consequence.
Figure 2: Land use/cover of ELWNNR in 1998, 2006 and
2014.
From 1998 to 2006, the area of salinized land,
desert and others has decreased mainly by the land
use/cover passive attitudes (-5.8% and -4.0%,
respectively) (Figure 3). The government carried out
a water increase project of Ebinur Lake in 2004 and
the area of water body increased and the area of dry
lake bed decreased as a consequence. Compared
with 2004, the area of bared lakebed increased and
the area of water body decreased in 2006. However,
compared with 1998, the area of water body and dry
lake bed expanded to a certain extent, because of
artificial water increase project. Therefore, forest,
grassland, bared bed, and water body showed an
expansion. Until 2014, the bared lakebed, water
body, and other land species showed a decreasing
trend. However, forest, grassland, salinized land,
and desert are constantly expanding, in which the
dynamic degree of desert is 34.1%. From 2014 to
2022, the bared lakebed, water body, and other areas
show a trend to decrease in extension. The bared
lakebed had a drastic decrease (-5.2%). The area of
forest, grassland, salinized land, and desert increased
instead; meanwhile the dynamic degree of forest and
grassland was 5.2%. In 2030, these changes were
expected to be limited (Figure 3).
The overall LUCC in the ELWNNR showed to
distinct trends (Figure 3): the increase of forest,
grassland, saline land and desert, and the decrease of
dry lake bed, water body, and other lands. After the
establishment of the ELWNNR, human activities
have been relatively reduced and natural grasslands
have been restored; it is mainly attributed to the
national implementation of projects, such as
returning farmland to forests, returning pasture to
grassland, and recognizing the importance of the
environment. However, the water area of Ebinur
Lake continues to shrink, because of an increase in
cultivated land and a large amount of water
resources used for irrigation; consequently, resulting
the desertification and salinization of bare lake-bed.
Meanwhile, the strong wind in Alashankou has
accelerated the expansion of saline land. Therefore,
it is urgent to manage the saline land in the western
part of ELWNNR.
Figure 3: Dynamic degree of land use/cover types of the
ELWNNR from1998 to 2030.
3.2 The Correlation Analysis between
Landscape Indices and
Environmental Quality Indices
The correlation between landscape indices and
environmental quality indices based on class level
and landscape level were shown in Figure 4 and
Table 1. From the landscape level, the environment
quality indices of forest-grassland are positively
correlated with landscape type percentage, patch
fragmentation, maximum patch indices, boundary
density, area weighted average patch fractal
dimension, and patch connectivity. However, there
was a significant and negative correlation between
environment quality indices of forest-grassland with
the average patch area, indicating that the effect of
forest and grass land on the environment was higher
than other land use/cover types.
Relationship between Landscape Pattern and Environmental Indices in Ebinur Lake Wetland National Natural Reserve
135
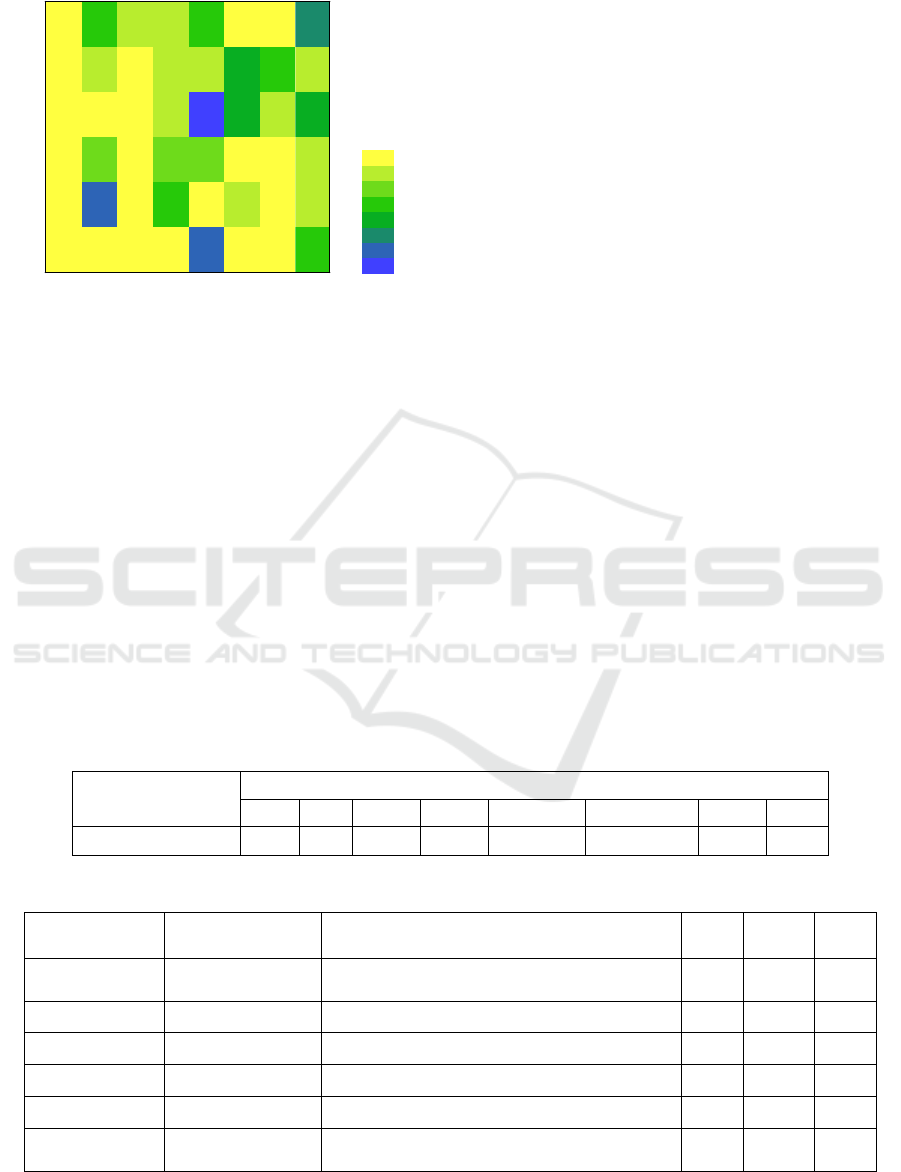
0.003
0.909
0.9880.349
0.868 0.259
-0.069
0.67-0.053-0.965
0.754
-0.317
0.241
0.6170.9930.961
0.936
0.627
-0.2290.64
0.7170.8540.514
0.988
0.9540.1130.722
0.7170.1080.765
0.991
0.363
0.962 0.714
0.7110.8880.555
0.94
0.1750.961
-0.619
0.996
0.9930.907
-0.624
0.9990.994
Others
Salinized
land
Bared
lakebed
Water
Desert
Forest and
grassland
COHESION AI
AWMPFDMPS
ED
LPIPD
-1.0
-0.75
-0.50
-0.25
0.0
0.25
0.50
0.75
1.0
PLAND
0.999
R
Figure 4: Pearson correlation coefficients between
environment quality indices and landscape pattern indices
on class level.
The environmental quality indices of the
salinized land were positively correlated with the
percentage of landscape type, the maximum patch
indices, the average patch area and the patch
connectivity; and it was negatively correlated with
the patch fragmentation. The environmental quality
indices of the bared lakebed have a positive
correlation with the percentage of landscape types,
the maximum patch indices, the area-weighted
average plaque fractal dimension, and the patch
connectivity. The large amount of cultivated land
area rapidly increased due to the human demand for
crops and the use of water from Boltara, Jinghe and
Kuitun Rivers. As a result, the lake surface shrank,
and the area of bared lakebed increased. Therefore,
it should pay attention to the protection of forest
grassland and the prevention and control of salinized
land.
At the landscape level, the environmental quality
indices were negatively correlated with the number
of patches, boundary density, landscape shape index
and Shannon diversity index. There is a significant
and high positive correlation among patch index,
patch connectivity, plaque aggregation and spread
index.
Since the regional environmental quality indices
were influenced by the spatial pattern of landscape
pattern indices, multivariate correlation analysis
(Table 2) was performed based on single factor
analysis. Key landscape indices were pointed among
numerous landscape indices that affect the
environmental quality indices. The R
2
value of
multiple linear stepwise regression model of
environmental quality indices and landscape indices
(p<0.05) was greater than 0.7, indicating that the
value of landscape indices and the value of
environmental quality indices in the study area were
significantly correlated. Landscape indices can be
then used to estimate the environmental quality
indices of the study area.
Table 1: Pearson correlation coefficients between environment quality indices and landscape pattern indices on class level.
Environment indices
Landscape pattern indices
NP LPI ED LSI CONTAG COHESION SHDI AI
(E)
-0.96 0.78 -0.911 -0.911 0.91 0.667 -0.792 0.909
Table 2: Relationship between landscape indices and environment quality indices.
Environment
Indices
Landscape pattern
indices
Regression equation R
2
RMSE Sig.
E
Forest and grassland
PLAND, LPI E
Forest and grassland
=-0.913PLAND+2.146LPI-
4.323
0.888 0.0027 0.032
E
Salinized land
PLAND, PD E
Salinized land
=2.344PLAND-0.374PD-13.557 0.797 0.0676 0.035
E
Bared lakebed
LPI, AI E
Bared lakebed
=0.037LPI+0.128AI-1.082 0.76 0.3 0.01
E
Water
LPI, AI E
Water
=2.02LPI-56.687AI+252.918 0.83 0.053 0.04
E
Desert
PLAND, ED E
Desert
=2.234PLAND+0.007ED-13.181 0.78 0.08 0.001
E
Others
COHESION, AI E
Others
=257.226COHESION-2.774AI-
1176.746
0.793 0.0767 0.028
IWEG 2018 - International Workshop on Environment and Geoscience
136

4 DISCUSSION AND
CONCLUSIONS
The CA-Markov model has always been a common
model for predicting LUCC. The CA model has a
strong capability in simulating the spatial-temporal
characteristics of complex systems. That is why it
has been extensively used as a spatially dynamic
model in LULC research (Adhikari and Southworth
2012). This model can be understood as a dynamic
and relatively simple spatial system, in which the
state of each cell of the matrix depends on the
previous state of the cells enclosed inside a defined
neighbourhood, in accordance with a set of
transition rules. Therefore, the CA model is capable
enough to predict the spatial distribution of the
LULC pattern and its dynamics because it adds the
spatial properties of LULC. Because human factors
are the most important reason for LUCC, the
simulated results of CA-Markov model are highly
uncertain. Therefore, we will try to explore new
methods and make the results practical in future
studies. The CA-Markov model effectively
combined the advantages of the Markov model and
the CA model, improving the simulation accuracy.
This research built a CA model spatial filter of 5
pixels×5 pixels, but it did not compare spatial filters
of different sizes. Therefore, future research could
be focused on the effect of spatial resolution.
This study can reflect the LUCC of the
ELWNNR in 1998-2014 and is closely related to the
landscape pattern and environment situation, which
can be used to provide reference for environment
protection in the ELWNNR. Results show that
regional landscape pattern and environment change
are key component to develop policies in the
ELWNNR and control environmental pollution. The
environment should improve CONTAG, SHDI and
CONNECT indices at the landscape and class levels,
but affect CONNECT, NP, PD, and ED indices. The
entire study is based on remote sensing
interpretation and requires accurate data that should
be further improved in subsequent studies.
Based on Landsat TM, in 1998 and 2006, and
Landsat OLI remote sensing images, from 2014, this
research studies current and future changes of land
use/cover-landscape patterns and establishes a
quantitative expression of landscape pattern and
environmental quality indices. We can conclude that:
(1) The LUCC in the ELWNNR shows a trend with
“three increases and three decreases” in the
descriptor indices used in this study. From 1998 to
2006, the expansion of dry lake bed was notorious.
In 2014, the desert continued to expand, with a
dynamic degree of 34.1%. From 2014 to 2022, the
dry lake bed, water bodies, and other areas have a
trend to decrease. By 2030, the land use/cover type
conversion area will be smaller. (2) The landscape
indices and the environmental quality indices in the
study area are significantly correlated, proving that
the composition of the landscape and the spatial
structure of the land use have a great impact on the
regional environmental quality and the landscape
indices can be used to estimate the environmental
quality.
ACKNOWLEDGEMENTS
We are grateful for the financial support provided by
the Natural Science Foundation of Xinjiang Uygur
Autonomous Region, China (2016D01C029), the
authors wish to thank the referees for providing
helpful suggestions in improving this manuscript.
REFERENCES
Adhikari S, Southworth J 2012 Simulating forest cover
changes of Bannerghatta National Park based on a CA-
Markov model: a remote sensing approach Remote
Sens. 4(10) 3215
Al-sharif AAA, Pradhan B 2013 Monitoring and
predicting land use change in Tripoli Metropolitan City
using an integrated Markov chain and cellular
automata models in GIS Arab. J. Geosci. 7(10) 4291
Bing Z, Gao J., 2015. Research on the Impact of Human
Activities on the Landscape Pattern in Jiuzhaigou
Nature Reserve. Aasri International Conference on
Circuits and Systems.
Brun C, Cook A R, Lee J S H, et al. 2015 Analysis of
deforestation and protected area effectiveness in
Indonesia: A comparison of Bayesian spatial models
Global Environmental Change 31 285
Bai, X., 2010. Study on the wetland ecological
vulnerability and its driving system in Ebinur lake in
XinJiang. East China Normal University.
Chen L, Yang X, Chen L, et al. 2015 Impact assessment
of land use planning driving forces on environment
Environmental Impact Assessment Review 55(6) 126
Chen S F, 2015 Relationship between land use and soil
erosion in the subtropical mountain areas of north
Guangdong province Journal of Arid Land Resources
and Environment 29(2) 80
Camacho C, Pérez-Barahona A, 2015 Land use dynamics
and the environment Journal of Economic Dynamics&
Control 52(52) 96
Relationship between Landscape Pattern and Environmental Indices in Ebinur Lake Wetland National Natural Reserve
137

Conrad C, Rudloff M, Abdullaev I, et al. 2015 Measuring
rural settlement expansion in Uzbekistan using remote
sensing to support spatial planning Applied Geography
62 29
Duan Z, Zhang F, Kong X, 2005 Method for information
mining of land-use change and its application
Transactions of the Chinese Society of Agricultural
Engineering 21(12) 60
Han C J, Wu K N, Liu D Y, et al. 2011 On Cropland
Prediction of Zhengzhou Based on Markov Model in
Multi-Projects Soils 43(3) 453
Hansen A J, Defries R, 2007 Ecological Mechanisms
Linking Protected Areas to Surrounding Lands
Ecological Applications 17(4) 974
Lei B, Zhu K W, Li J H, et al. 2016 Study on the Influence
of Land Use Change on Landscape Pattern and Eco-
environmental Status Environmental Impact
Assessment 38(3) 87
Liu Y, Gao J, Yang Y, 2003 A holistic approach towards
assessment of severity of land degradation along the
Great Wall in northern Shaanxi Province, China
Environmental Monitoring & Assessment 82(2) 187
Lu C Y, Sun Q Y, Li H, et al. 2014 Estimation of
groundwater recharge in arid and semi-arid areas based
on water cycle simulation Shuili Xuebao 45(6) 701
Moghadam B K, Jabarifar M, Bagheri M, et al. 2015
Effects of land use change on soil splash erosion in the
semi-arid region of Iran Geoderma 241–242 210
Paroissien J B, Darboux F, Couturier A, et al. 2015 A
method for modeling the effects of climate and land
use changes on erosion and sustainability of soil in a
Mediterranean watershed (Languedoc, France) Journal
of Environmental Management 150 57
Tsai Y, Zia A, Koliba C, et al. 2015 An interactive land
use transition agent-based model (ILUTABM):
Endogenizing human-environment interactions in the
Western Missisquoi Watershed Land Use Policy 49
161
Terra T N, Santos R F D, Costa D C, 2014 Land use
changes in protected areas and their future: The legal
effectiveness of landscape protection Land Use Policy
38(2) 378
Vadrevu K P, Justice C, Prasad T, et al. 2015 Land
cover/land use change and impacts on environment in
South Asia Journal of Environmental Management
148 1
Veldkamp A, Lambin E F, 2001 Predicting land-use
change Agriculture Ecosystems & Environment 85(1-3)
1
Wang Y, Shao M, Zhang C, et al. 2015 Choosing an
optimal land-use pattern for restoring eco-
environments in a semiarid region of the Chinese
Loess Plateau Ecological Engineering 74(5) 213
Wang K, Wang H J, Shi X Z, et al. 2009 Landscape
analysis of dynamic soil erosion in Subtropical China:
a case study in Xingguo County, Jiangxi Province Soil
& Tillage Research 105(2) 313
Wang L, Ding J L, 2015 Vegetation index feature change
and its influencing factors and spatial-temporal process
analysis of desert grassland in the Ebinur Lake Nature
Reserve, Xinjiang Acta Prataculturae Sinica 24(5) 4
Wu J G, 2007
Landscape Ecology—Pattern,
Process, Scale and Grade. Beijing: Higher
Education Press. (in Chinese)
Xie X, Wang H W, Tashpolat T, 2010 Study on
Landscape Pattern Change in Ebinur Lake Region
based on RS and GIS Journal of Desert Research 30(5)
1166
Xia J, Zuo Q T, 2006 Advances in International
Hydrological Science Research Advances in Earth
Science 21(3) 256
Ye X, Liu G, Li Z, et al. 2015 Assessing Local and
Surrounding Threats to the Protected Area Network in
a Biodiversity Hotspot: The Hengduan Mountains of
Southwest China Plos One 10(9) e0138533
Zhang Y, Zhang F, Wang J, et al., 2016 Evaluation of the
Landscape Patterns Vulnerability and Analysis of
Spatial -Temporal Patterns in the Typical Region of the
Ebinur Lake Journal of Catastrophology 31(3) 222
Zhao G S, Liu J Y, Kuang W H, et al. 2015 Disturbance
impacts of land use change on biodiversity
conservation priority areas across China during 1990-
2010 Acta Geographica Sinica 69(5) 1640
Zeng, Y. N., 2014 Simulation of land-use changes and
landscape ecological assessment in eastern part of
Qinghai Plateau Transactions of the Chinese Society of
Agricultural Engineering 30(4) 185
IWEG 2018 - International Workshop on Environment and Geoscience
138
