
Influence of Annealing Temperature on
R
ecrystallization Texture
and Formability of Extra-deep Drawing Steel for Enameling
Zhimin Zhang
1a
, Zaiwang Liu
1b
, Xueqi Huang
1c
, Yongqiang Xue
2d
and Libin Yang
2e
1
Shougang Group Co.,Ltd. Research Institute of Technology, Beijing, China
2
Shougang Jingtang United Iron & Steel Co.,Ltd, Tangshan, China
e
ylibin3@163.com
Keywords: Extra-deep drawing steel for enamelling, Annealing temperature, Recrystallization texture, precipitated
phase.
Abstract: Extra-deep drawing steel sheets for enameling were annealed at different temperatures. Microstructure,
precipitated particles and recrystallization texture of annealed steel were observed. Mechanical properties of
annealed steel were measured. Results show that recrystallization textures of annealed steel mainly
distribute along γ orientation line. Main recrystallization textures of annealed steel are {111}<110> and
{111}<112>. r value increases with the increase of annealing temperature due to higher intensity of textures
{111}<110> and {111}<112> obtained at higher temperature. With increase of annealing temperature
intensity of texture {111}<110> increases obviously whereas intensity of texture {111}<112> shows only a
small increase. Because pinning effect of TiC particles on grains with texture {111}<110> is much stronger
than on grains with texture {111}<112>. Coarsening of TiC particles is a necessary condition for full
development of texture {111}<110> in annealing process. It is also an important factor to obtain excellent
formability for steel sheet.
1 INTRODUCTION
Cold rolled steel sheets for enameling have some
particular characteristics: good appearance, high
abrasion resistance, strong corrosion resistance and
excellent resistance to high temperature. So they are
widely used in industry of home appliances,
metallurgy, chemistry and building [1]. Extra-deep
drawing steel for enameling is a special steel with
excellent formability and enamel property [2]. It is a
kind of ultra-low carbon steel. It has high
elongation, n value and r value. So it is suitable to
make some products with complex shape and strict
enameling process, such as bathtub, electric oven,
gas cooker, decoration panel for building and so on.
Fish-scaling resistance is necessary for
enameling steel [3]. Fish-scaling resistance of
enameling steel is studied in many references [3-6].
Formability and recrystallization texture are also
necessary for extra-deep drawing steel for
enameling. The excellent deep drawing property of
steel is closely related to γ texture (<111>//ND) [7].
The greater the number of grains with lattice plane
{111} parallel to rolled surface means higher r value
and better formability [8]. Microstructure,
precipitated phase, recrystallization texture and
formability of extra-deep drawing steel for
enameling annealed at different temperatures were
observed or measured in this work in order to study
the relation between formability and recrystallization
texture.
2 MATERIALS AND METHODS
The experimental material is cold rolled steel sheets
which can make into extra-deep drawing steel sheets
for enameling by annealing process. Chemical
composition of experimental steel is shown in Table
1.
Table 1: Chemical composition of experimental steel
(mass fraction, %).
C Si Mn P S Alt Ti
0.005 0.04 0.17 0.01 0.01 0.05 0.05
The experimental steel sheets were annealed at
750, 790 and 830 ℃ respectively. Annealing method
was continuous annealing. Tested samples were cut
out from annealed steel sheets for optical
microscope (OM), transmission electron microscope
(TEM), texture and mechanical property experiment.
All samples were cut out at 1/4 sheet width position.
Size of samples for OM and TEM experiment was
10mm×10mm×0.6mm. Microstructures were
observed by LEXT3100 OM and precipitates were
observed by JEM-2100F(HR) TEM. Size of samples
for texture was 20mm×15mm×0.6mm.
Recrystallization texture was measured by X-Ray
Diffractomer. Mechanical property experiment was
carried out by Instron tensile testing machine
following national standard GB/T 228.1-2010.
Gauge length of sample for tensile testing was
50mm. Tensile direction was perpendicular to
rolling direction.
3 RESULTS AND ANALYSIS
3.1 Microstructure and Precipitated
Phase
Microstructures of steel annealed at different
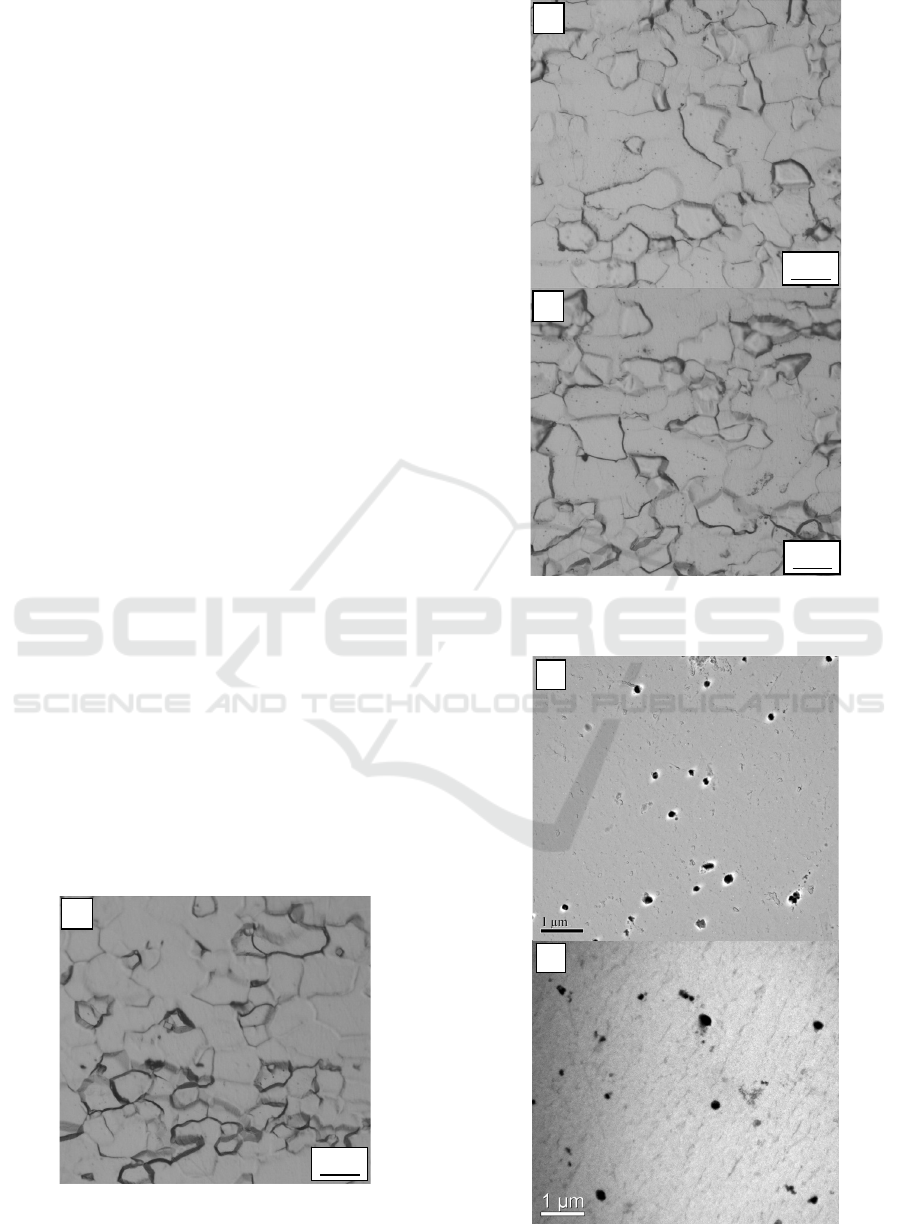
temperatures are shown in Figure 1. It can be seen
from Figure 1 that microstructures of steel annealed
above 750 ℃ are fully recrystallized.
Microstructures of annealed steel consist of ferrite
and some fine precipitated particles. Size of ferrite
grains increases during annealing process. The
higher annealing temperature, the bigger size of
ferrite grains, shows Figure 1. Average size of ferrite
grains for steel annealed at 750, 790 and 830 ℃ is
15.2, 17.8 and 18.5 μm respectively. Precipitated
particles in ferrite matrix of steel annealed at
different temperature observed by TEM are shown
in Figure 2.
Figure 1: Microstructure of steel annealed at different
temperatures (a) 750 ℃; (b) 790 ℃; (c) 830 ℃.
(b)
(a)
(c)
20μ
m
(b)
20μ
m
(a)
20μ
m
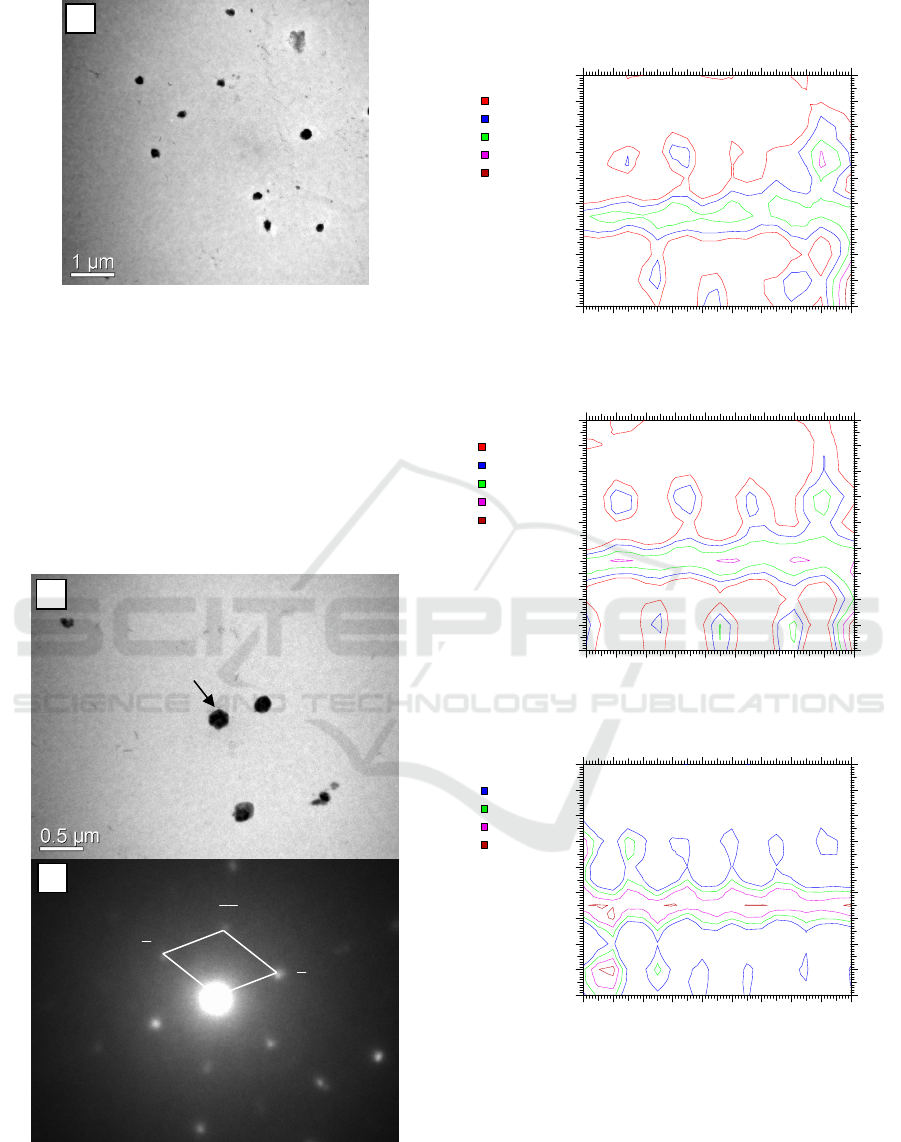
Figure 2: Precipitated particles in steel annealed at
different temperatures (a) 750 ℃; (b) 790 ℃; (c) 830 ℃.
It can be seen from Figure 2 that size of
precipitated particles increases during annealing
process. The higher annealing temperature, the
bigger size of precipitated particles, shows Figure 2.
Average size of precipitated particles in steel
annealed at 750, 790 and 830 ℃ is 101.2, 118.0 and
148.9 nm respectively. Precipitated particle was
identified as TiC by indexing corresponding
diffraction spot, as shown in Figure 3.
Figure 3: Precipitated particles in steel annealed at 830 ℃
(a) and diffraction spot (b).
3.2 Recrystallization Texture
Figure 4: Orientation distribution function sections
(ODFs) in φ2=45° of steel annealed at different
temperatures (a) 750 ℃; (b) 790 ℃; (c) 830 ℃.
Orientation distribution function sections (ODFs) in
φ2=45° of steel annealed at different temperatures
are shown in Figure 4. It can be seen from Figure 4
that recrystallization textures of annealed steel
mainly distribute along γ orientation line. When
3.28
2.73
2.18
1.63
3.2
8
2.73
2.18
1.63
PHI
Phi1
Constant Phi2 = 45
0
10
20
30
40
50
60
70
80
90
0
10
20
30
40
50
60
70
80
90
(c)
3.93
3.27
2.61
1.95
1.30
3.93
3.2
7
2.61
1.95
1.30
PHI
Phi1
Constant Phi2 = 45
0
10
20
30
40
50
60
70
80
90
0
10
20
30
40
50
60
70
80
90
(b)
3.91
3.2
6
2.60
1.95
1.29
PHI
Phi1
Constant Phi2 = 45
0
10
20
30
40
50
60
70
80
90
0
10
20
30
40
50
60
70
80
90
3.91
3.26
2.60
1.95
1.29
(a)
(b)
000
B=[111]
220
202
422
(a)
(c)
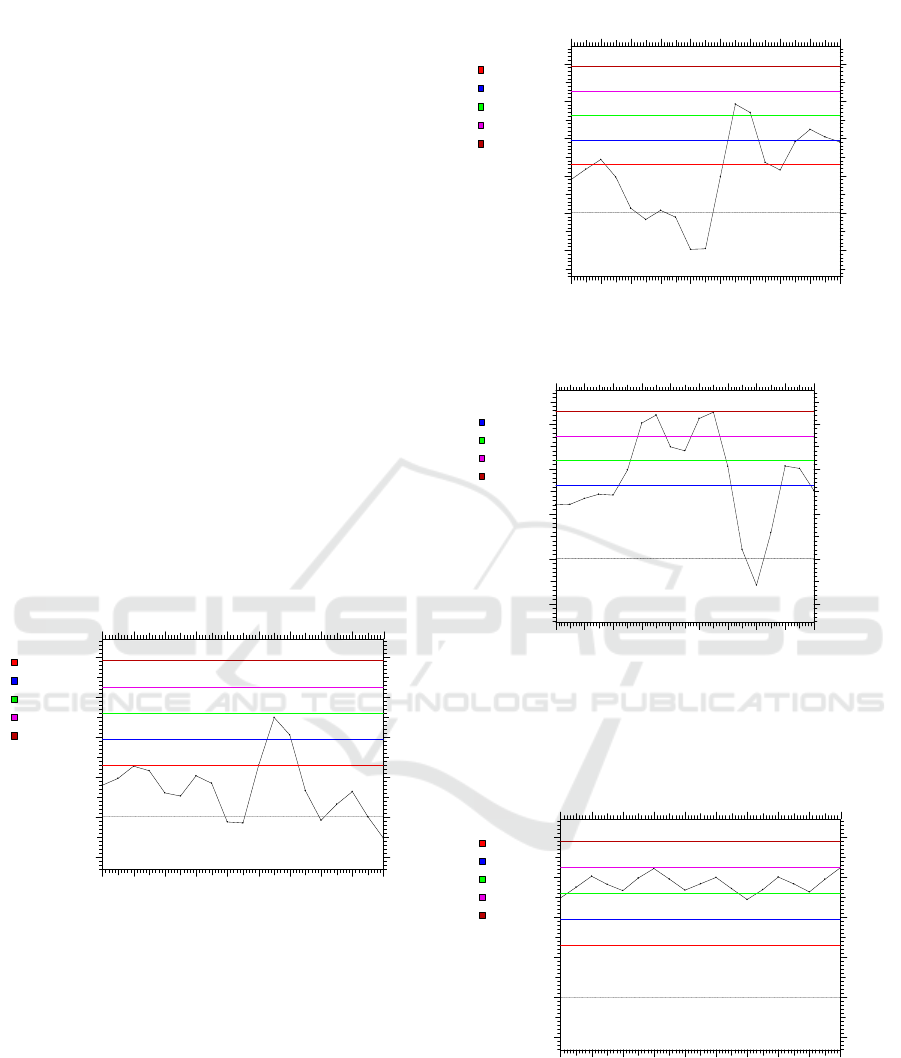
steel is annealed at 750 ℃, intensity peak is 3.91 and
the corresponding texture is {110}<001>, secondary
intensity peak is 2.60 and the corresponding texture
is {111}<112>. When steel is annealed at 790 ℃,
intensity peak is 3.93 and the corresponding texture
is {110}<001>, secondary intensity peak is 3.27 and
the corresponding texture is {111}<112>. When
steel is annealed at 830 ℃, intensity peak is 3.28 and
the corresponding texture is {111}<110>, secondary
intensity peak is 3.28 and the corresponding texture
is {111}<112>. Higher intensity of recrystallization
texture means higher volume fraction of grains with
corresponding recrystallization texture.
Orientation densities on α orientation line of steel
annealed at different temperatures are shown in
Figure 5. It can be seen from Figure 5 that intensity
peak is 2.5 and the corresponding texture is
{111}<110> when steel is annealed at 750 ℃ ,
intensity peak is 2.9 and the corresponding texture is
{111}<110> when steel is annealed at 790 ℃ ,
intensity peak is 3.28 and the corresponding texture
is {111}<110> when steel is annealed at 830 ℃.
Intensity of texture {111}<110> increases obviously
with increase of annealing temperature.
Figure 5: Orientation densities on α orientation line of
steel annealed at different temperatures (a) 750 ℃; (b) 790
℃; (c) 830 ℃.
3.91
3.26
2.60
1.95
1.29
(a)
Density
phi1
FO Space phi1, phi2=45.0, PHI=55.0
-1.3
-1
0
1
2
3
4
0
10
20
30
40
50
60
70
80
90
{
111
}
<110>
{
111
}
<123>
{
111
}
<112>
(c)
3.28
2.73
2.18
1.63
Density
PHI
FO Space PHI, phi1=0.0, phi2=45.0
-1.4
-1
0
1
2
3
0
10
20
30
40
50
60
70
80
90
{
001
}
<110>
{
110
}
<110>
{
118
}
<110>
{
113
}
<110>
{
223
}
<110>
{
332
}
<110>
{
554
}
<110>
{
111
}
<110>
{
112
}
<110>
3.93
3.27
2.61
1.95
1.30
Density
PHI
FO Space PHI, phi1=0.0, phi2=45.0
-1.7
-1
0
1
2
3
4
0
10
20
30
40
50
60
70
80
90
{
001
}
<110>
{
110
}
<110>
{
118
}
<110>
{
113
}
<110>
{
223
}
<110>
{
332
}
<110>
{
554
}
<110>
{
111
}
<110>
{
112
}
<110>
3.93
3.27
2.61
1.95
1.30
(b)
3.91
3.26
2.60
1.95
1.29
{
001
}
<110>
{
110
}
<110>
{
118
}
<110>
{
113
}
<110>
{
223
}
<110>
{
332
}
<110>
{
554
}
<110>
{
111
}
<110>
{
112
}
<110>
3.91
3.26
2.60
1.95
1.29
Density
PHI
FO Space PHI, phi1=0.0, phi2=45.0
-1.3
-1
0
1
2
3
4
0
10
20
30
40
50
60
70
80
90
(a)
Figure 6: Orientation densities on γ orientation line of
steel annealed at different temperatures (a) 750 ℃; (b) 790
℃; (c) 830 ℃.
Orientation densities on γ orientation line of steel
annealed at different temperatures are shown in
Figure 6. It can be seen from Figure 6 that when
steel is annealed at 750 ℃, intensity peak is 3.26 and
the corresponding texture is {111}<112>. When
steel is annealed at 790 ℃, intensity peak is 3.4 and
the corresponding texture is between {111}<110>
and {111}<123>, secondary intensity peak is 3.27
and the corresponding texture is {111}<112>. When
steel is annealed at 830 ℃, intensity peak is 3.28 and
the corresponding texture is {111}<112>.
3.3 Mechanical Properties
Table 2: Mechanical properties of steel annealed at
different temperatures.
Annealing
temperature
R
p0.2
(MPa)
R
m
(MPa)
A
50
(%)
n r
750 ℃
120 294 46.0 0.29 2.30
790 ℃
110 288 49 0.30 2.35
830 ℃
105 295 47.5 0.31 2.68
Mechanical properties of steel annealed at different
temperatures are shown in Table 2. It can be seen
from Table 2 that: with increase of annealing
temperature, yield strength (R
p0.2
) decreases, n value
and r value increases but tensile strength (R
m
) has no
obvious change. Formability of extra-deep drawing
steel is closely related to mechanical properties,
especially r value. Higher r value means better
formability. r value is closely related to
recrystallization texture.
4 DISCUSSION
According to Figure 5 and Figure 6, with increase of
annealing temperature, intensity of texture
{111}<110> increases obviously whereas intensity
of texture {111}<112> shows only a small increase.
Sizes of grain and precipitates, recrystallization
texture and r value of steel annealed at different
temperatures are listed in Table 3. It can be seen
from Table 3 that main recrystallization textures of
experimental steel are {111}<110> and {111}<112>
which contribute to high r value. r value increases
with the increase of annealing temperature due to
higher intensity of textures {111}<110> and
{111}<112> obtained at higher temperature. This
indicates volume fraction of grains with texture
{111}<110> or texture {111}<112> increases at
higher annealing temperature.
Table 3: Sizes of grain and precipitated TiC,
recrystallization texture and r value of steel annealed at
different temperatures.
Annealing
temperature
(℃)
Grai
n
size,
μm
Sizes
of TiC,
nm
Main
recrystallization
texture
Density
of
texture
r
750 15.2 101.2
{111}<110> 2.5
2.30
{111}<112>
3.26
790 17.8 118
{111}<110>
2.9
2.35
{111}<112>
3.27
830 18.5 148.9
{111}<110> 3.28
2.68
{111}<112>
3.28
Recrystallization of metal includes nucleation
and growth of recrystallized grains. According to
Figure 1, all grains of steel annealed at 750 ℃ are
equiaxed. So growth of recrystallized grains is only
involved and nucleation of recrystallized grains is
not involved when steel is annealed above 750 ℃.
This mechanism of secondary phases is Ostwald
ripening [9]. During annealing process, volume
3.28
2.73
2.18
1.63
Density
phi1
FO Space phi1, phi2=45.0, PHI=55.0
-1.4
-1
0
1
2
3
0
10
20
30
40
50
60
70
80
90
{111}<110>
{111}<123>
{111}<112>
3.28
2.73
2.18
1.63
(c)
3.93
3.27
2.61
1.95
1.30
(b)
Density
phi1
FO Space phi1, phi2=45.0, PHI=55.0
-1.7
-1
0
1
2
3
4
0
10
20
30
40
50
60
70
80
90
{
111
}
<110>
{
111
}
<123>
{
111
}
<112>

fraction of TiC in steel remains the same, but size of
TiC particles increases and quantity of TiC particles
decreases. Growth of recrystallized grains should
satisfy both thermodynamic condition and kinetics
condition. Kinetics condition is activity of grain
boundaries. The relation between activity of grain
boundaries B and diffusion coefficient of grain
boundaries D is [10]:
B=D/RT (1)
where R is gas constant, T is temperature. The
relation between D and T is
RT
Q
eDD
−
=
0
(2)
where D
0
is diffusion constant, Q is diffusion
activation energy. Activity of grain boundaries
increases with increase of temperature. Rising
temperature provides power to migration of grain
boundaries. Grain boundaries also receive resistance.
The resistance comes from precipitated particles in
steel. Resistance F per unit area of grain boundary
can be described as [10]:
r
F
b
ϕγ
2
3
=
(3)
where φ is volume fraction of precipitated particles,
γ
b
is energy per unit area of grain boundary, r is
radius of precipitated particle. It can be seen from
Equation (3) that F will decrease if φ decreases or r
increases. From Table 3 size of precipitated TiC
increases with increase of annealing temperature. F
should decrease with increase of annealing
temperature. That is to say, pinning effect of TiC on
grain boundaries weakens with increase of annealing
temperature.
If pinning effect of TiC on grains with all kinds
of texture is the same, growth chance of grains with
every texture is similar, intensity of every texture
will have no obvious change with increase of size of
TiC. But pinning effects of TiC on grains with
texture {111}<110> and on grains with texture
{111}<112> are different in fact. From Table 3, with
increase of size of TiC, intensity of texture
{111}<110> increases obviously whereas intensity
of texture {111}<112> shows only a small increase.
It indicates pinning effect of TiC on grains with
texture {111}<110> is much stronger than on grains
with texture {111}<112>. During annealing process
TiC particles coarsen and their pinning effect on
grains weakens. So intensity of texture {111}<110>
and {111}<112> increases and intensity of texture
{111}<110> increases obviously. Coarsening of TiC
particles is a necessary condition for full
development of texture {111}<110> in annealing
process. It is also an important factor to obtain
excellent formability for steel sheet.
5 CONCLUSIONS
(1) Recrystallization textures of extra-deep drawing
steel for enameling after annealing process mainly
distribute along γ orientation line. Main
recrystallization textures of annealed steel are
{111}<110> and {111}<112>.
(2) r value increases with the increase of
annealing temperature due to higher intensity of
texture {111}<110> and {111}<112> obtained at
higher temperature. With increase of annealing
temperature intensity of texture {111}<110>
increases obviously whereas intensity of texture
{111}<112> shows only a small increase. Because
pinning effect of TiC particles on grains with texture
{111}<110> is much stronger than on grains with
texture {111}<112>.
(3) In annealing process TiC particles coarsen
and their pinning effect on grains weakens.
Coarsening of TiC particles is a necessary condition
for full development of texture {111}<110> in
annealing process. It is also an important factor to
obtain excellent formability for steel sheet.
REFERENCES
1. DONG Futao, DU Linxiu, LIU Xianghua, et al.
Influence of continuous annealing process on
microstructure and properties of boron containing
enamel steel [J]. Acta Metallurgica Sinica, 2013,
49(10):1160-1168.
2. SUN Quanshe. Mechanism research and development
of extra deep drawability cold-rolled sheet steel for
enameling [D]. Beijing: University of Science and
Technology Beijing, 2007.
3. FENG Zhimin, FU Yulan, ZHAO Keqing. Remedy for
fishscale on enamel steel sheet [J]. Acta Metallurgica
Sinica, 1986, 22(4):B189-B191.
4. DONG Futao, DU Linxiu, LIU Xianghua, et al. Effect
of Ti(C,N) precipitation on texture evolution and fish-
scale resistance of ultra-low carbon Ti-bearing enamel
steel [J]. Journal of Iron and Steel Research,
International, 2013, 20(4): 39-45.
5. YUAN Xiaomin, ZHANG Qingan, SUN Quanshe.
Measurement of precipitates in enameled steel sheet
[J]. Journal of Iron and Steel Research, 2000, 12(5):
58-60.

6. Nicholas Winzer, Oliver Rott, Richard Thiessen, et al.
Hydrogen diffusion and trapping in Ti-modified
advanced high strength steels [J]. Materials & Design,
2016, 92:450-461.
7. CHEN Weiye, TONG Weiping, ZHANG Hui, et al.
Texture evolution and growth of differently sized
grains in IF steel during annealing [J]. Acta
Metallurgica Sinica, 2010, 46(9): 1055-1060.
8. QIAN Jianqing, YUAN Xinyun. Properties testing and
defect analysis of deep drawing cold-rolled sheet steel
[M]. Beijing: Metallurgical Industry Press, 2012, 72-
73.
9. YONG Qilong, 2006. Secondary phases in steels
Metallurgical Industry Press. Beijing.
10. SHI Deke, 1999. Fundamentals of material science
[M]. Machine Press. Beijing.
