
Spatial Analysis of the correlation between Topographic Wetness
Index with Annual Parasites Incidence Malaria in South Central
Timor District 2017 – Indonesia
Nelson
1
, Iwan Dwi Laksono
1
and Setya Haksama
2
1
Postgraduated of School, AirlanggaUniversity,Surabaya, Indonesia
2
Public Health Faculty, AirlanggaUniversity,Surabaya, Indonesia
Keywords: TWI, Malaria, API, Endemic, SAGA GIS.
Abstract: Malaria occurs in 106 countries in the world with 97 of them are malaria endemic countries including
Indonesia. East Nusa Tenggara province is one of the provinces in Indonesia with malaria incidence of 6.8
and prevalence of 23.3. South Central Timor District is one of malaria endemic districts with Annual
Parasites Incidence in year 2017 equal to 2,7 per 1000 population with case number 1,301.This research
aims to determine the relation of Topographic Wetness Index category (Ranged Very High => 8.8, High =
7.0 8.8, Medium = 6.0 7.0, Low = 5.2 6.0, Very Low = <5.2) with the category of Endemic Value
Annual Parasite Incidence (Ranged High => 5, Medium = 1-5, Low = <1) in 278 villages in South Central
Timor district. The method of this study employs spatial analysis with DEM 30 Meter data and analysed by
SAGA GIS application and then using Kendall's Tau test statistic analysis to observe the relation between
TWI category and API category. The result obtained was =
determine Malaria endemic areas.
1 INTRODUCTION
Transmission of Malaria occurs in 106 countries in
the World and 97 countries of which endemic areas
of Malaria according to the World Malaria Report of
2014 (Health Ministry Republic of Indonesia, 2014)
the incidence of malaria in Indonesia tends to
decline from 2005-2013, in 2005, incidence of
number of Blood Count (SD) examinations for
malaria diagnosis test increased, from 47% (982,828
Blood Disorders examinations from 2,113,265
clinical cases) in 2005, to 63% (1,164,405 Blood
Disorders examinations from 1,849,062 clinical
cases) in 2011, However, the success is still happen
because during 2011 malaria outbreaks were still
occurred of malaria in 9 districts / cities from 7
provinces with cases reached 1,139 cases with 14
cases of death or case fatality rate (CFR) reached
1.22%. The 5 provinces with the highest incidence
and prevalence in Indonesia are Papua (9.8% and
28.6%), East Nusa Tenggara (6.8% and 23.3%),
West Papua (6.7% and 19.4%) , Central Sulawesi
(5.1% and 12.5%), and Maluku (3.8% and 10.7%)
(Health Ministry Republic of Indonesia, 2013).
The aim of this study is to use an elevation data
derived Topographic Wetness Index (TWI) within
each village of one district in West Timor and then
to find out the relationship between TWI and
malaria API data. TWI data is the result of analysis
from Digital Elevation Modeling (DEM) 30 Meter
data to describe of malaria risk area. TWI data is
used with the intention to predict the Anopheles
mosquito breeding place of malaria disease vector.
The TWI data can be used to predict the Malaria
vector mosquito breeding area compared to land use
or land cover data (Cohen et al., 2010).
Topographic Wetness Index (TWI) is a water
tendency to accumulate at one point based on the
force of gravity where water always flows to a lower
place (Quinn and Planchon, 1991). Thus the value of
the index is much greater on a very flat slope while
the index on a steep slope is smaller (Haas, 2010). If
an area accumulates the flow of water then the soil
will become saturated with water causing
inundation. This puddle occurs due to the pores of
376
Nelson, ., Laksono, I. and Haksama, S.
Spatial Analysis of the correlation between Topographic Wetness Index with Annual Parasites Incidence Malaria in South Central Timor District 2017 â
˘
A ¸S Indonesia.
DOI: 10.5220/0007543303760380
In Proceedings of the 2nd International Conference Postgraduate School (ICPS 2018), pages 376-380
ISBN: 978-989-758-348-3
Copyright
c
2018 by SCITEPRESS – Science and Technology Publications, Lda. All rights reserved
the soil is no longer able to accommodate water.
This puddle is the potential for Anopheles mosquito
breeding which is a vector of Malaria disease
A study link to the Topographic Wetness Index
to areas at risk for malaria was Cohen et al (2008).
The topography of the Wetness Index in Kenya with
a highly variable field is more accurate in predicting
homes with malaria risk than considering the
characteristics of land cover / land use. The results
of this study are like those produced in South
Central Timor District. This circumstance explaines
the correlation between TWI and API.
Based on the secondary data of malaria incidence
in South Central Timor District the relation between
TWI and API has been analyzed to predict the
malaria risk in those areas.
The results of this study can provide a quick
overview to the community at large and Puskesmas
staff in particular to further take steps to anticipate
and manage malaria. Mapping of malaria risk areas
are very helpful in the elimination of malaria,
especially in the provision of medicines and the
process of program intervention such as the
provision of netting for the people residing in the
region (Rahadjo, 2016).
The use of DEM data in predicting malaria
vector is more effective. This is explained in the
results of research conducted by Jephtha C Nmor,
2013 in Africa. In this study, a possible location map
of where malaria vector habitat is very helpful in the
integrated malaria treatment program in Africa
2 METHOD
The research was conducted in South Central Timor
District, East Nusa Tenggara Province. The
population of South Central Timor District based on
the projection of population in 2016 is 461,881
people consisting of 227,877 males and 233,804
females. Population growth rate of South Central
Timor District in 2016 is 0,56%, and population
density is 117 soul / Km2. (Central Berau of Statistic
TTS District, 2017)
District Health Office in 2014 showed that the
number of positive malaria patients with microscopy
examination is 3,654 patients with API of 8 per 1000
population, meaning that for every 1000 people
there are about 8 people suffering from positive
malaria. Data in the Year 2017 indicates that the
number of patients as many as 1,301 positive
malaria patients with API of 2.7 per 1000
population, meaning that in every 1000 people there
are 3 people who suffer from positive malaria.
(South Central Timor Health Office, 2014).
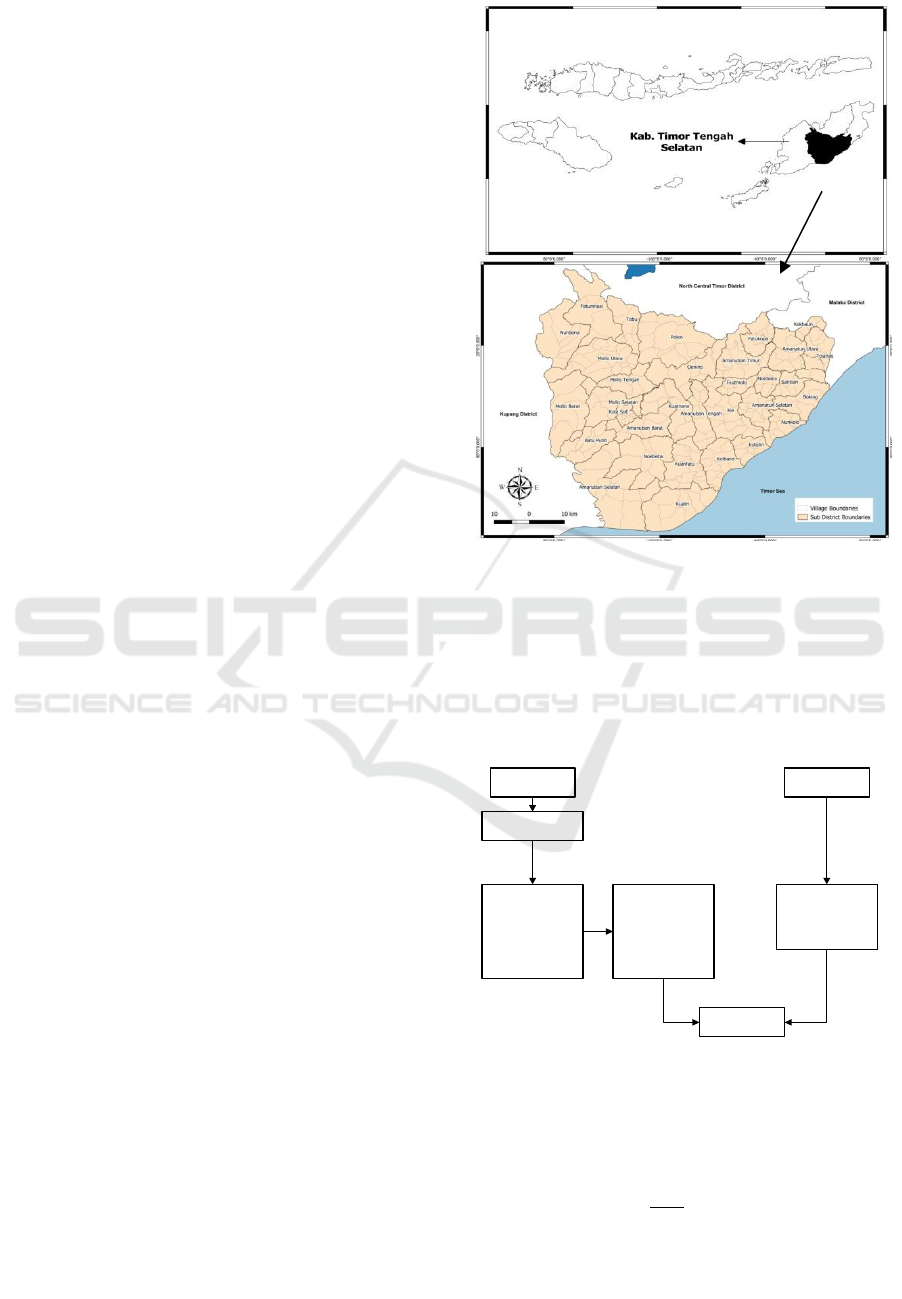
Figure 1: Study South Central Timor (TTS) district in East
Nusa Tenggara Province.
This research uses spatial analysis method to get
the result of the average value of TWI in 278
villages and then use statistical analysis to see the
correlation between TWI category with malaria API
in each village. Spatial analysis uses SAGA GIS
(Rohan Fisher, 2012) and Layout uses QGIS.
Figure 2: Flow Chart Processing TWI data and API
2.1 TWI Pre-processing
The TWI formula used is as follows:
W = Ln
∝
𝑡𝑎𝑛𝛽
(1)
W : wetness index
DEM 30 Meter
Basic Terain Analysis
API Village
Topographic Wetness
Indeks class
Very High > 8,8
High 7,0
Moderate 6,0
Low < 5,2
Very Low < 5,2
TWI mean data each
village class polygon
Very High > 8,8
High 7,0
Moderate 6,0
Low 5,2
Very Low < 5,2
API class polygon
More High > 20
High 6 - 20
Moderate 1
Low = < 1
API Village
Spatial Analysis of the correlation between Topographic Wetness Index with Annual Parasites Incidence Malaria in South Central Timor
District 2017 â
˘
A¸S Indonesia
377
Α :Accumulation of the upper slopes that drain
water at a point in each contour unit
ß : The angle of the slope at that point
The steps taken to obtain TWI value for each
village is to download DEM data from USSG with
30 Meter resolution. Furthermore, spatial analysis
was done with SAGA GIS software (Rohan Fisher,
2012), then classified into 5 classes. Very High >
8.8, High 7,0 8,8, Medium 6,0 7,0, Low 6,0 7,0
and Very Low < 5,2. The results of this
classification are incorporated into the village area
shape file with the mean TWI data per village. All
this process is done with SAGA GIS software. The
use of TWI data is to find out the malaria risk areas.
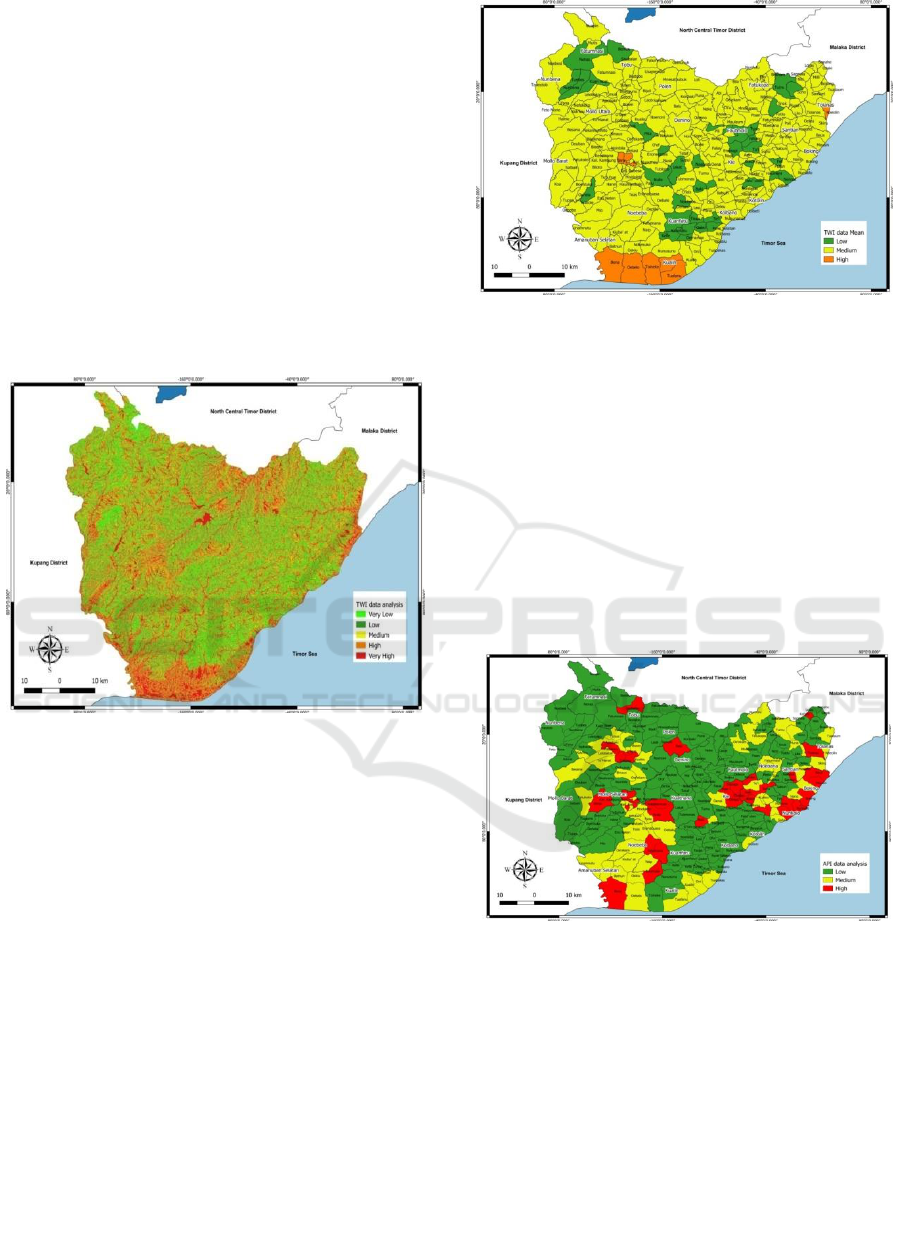
Figure 3: TWI data Analysis
3 RESULT
The map above shows the result of analysis Mean
TWI data for each village in the district of South
Central Timor. From 278 villages, the result is 11
villages with high TWI category (orange color),
TWI with medium category as many as 246 villages
with yellow color and TWI with low category of 21
villages with green color on the map above.
Figure 4: TWI data mean each Villages
The Malaria API data was obtained from the
health office of the district of Central South Timor in
the field of health problem control. This API data is
the number of malaria morbidity based on laboratory
results per 1000 population within 1 year stated in
the permil. The data are categorized into: High> 5,
Medium 1-5 and low = <1 (MOH, 1999). The
malaria district of South Central Timor district in
2017, obtained by 2.7 per 1000 population with the
number of cases of 1,301. This API data is inputted
into village area shape file and created into several
category
Figure 5: API data Analysis
Analysis of API data in 149 villages are
categorized as low and marked with yellow color,
the medium category occurs at 92 villages and
marked with green color, and high level occurs at 92
villages and marked with red color (figure 5).
Villages with high category spread in 16 sub-
districts, those are South Amanatun, West
Amanuban, South Amanuban, Amanuban Center,
Boking, KiE, Kokbaun, SoE City, South Mollo,
North Mollo, Noebeba, Nunkolo, Polen, Santian,
Tobu and Toianas.
ICPS 2018 - 2nd International Conference Postgraduate School
378

Statistical test aims to see whether there is a link
between the data TWI and API. The result of this
research is Kendall's Tau statistic test where the
researcher compares the category or class of Malaria
risk based on Topographic Wetness Index with
category or class of Annual Parasites Incidence and
0,146, sig = 0,010.
This result shows that there is correlation between
TWI and API.
4 DISCUSSION
The use of TWI data in predicting the risk of malaria
should be considered as an additional tool in the
program of malaria elimination in South Central
Timor District. This is in line to research conducted
by Cohen et al (2010) in which TWI data is better at
predicting malaria risk than land cover data and land
use data. The use of TWI data is also supported by
the technological development and the increasing
availability of free satellite imagery data by
providers. The availability of a free version of
software and application, has beneficial for
researchers to obtain spatial data (Fisher et al.,
2018).
Topography is a major factor in which moist or
wet areas are identified to have high vector densities.
Wet areas in the area is inundated inviting vector
Anopheles mosquito to breed. It will be even worse
if the area is a malaria endemic (Mwakalinga et al.,
2018). Malaria is strongly influenced by
environmental ecology. Furthermore, rapid people
movement increase the transmission of malaria.
The use of the TWI to predict malaria risk areas
is motivated by a shift in malaria cases that
previously occurred in many coastal areas, but now
the annual data of Parasites Incidence are also high
in mountainous areas. The large number of malaria
cases in mountainous areas, has challenged the
prediction of malaria risk areas that uses elevation
data of a region.
Mapping the malaria risk areas is very important
in the process of eliminating malaria. This mapping
is a basis for elimination activities in order to be
right on determining target. If we do not know about
malaria risk areas it will be difficult to carry out the
elimination activities, with this analysis, malaria
program managers in the district or provincial level
will be able to predict malaria risk areas and conduct
the activities in order to eliminate malaria
appropriately.
5 CONCLUSION
The result of this study shows that there are
correlation between TWI and API. The use of TWI
analysis results is very good for predicting areas at
risk of malaria. This is in line with the results of the
analysis that the TWI category is linked to the 2017
data API in 278 villages / sub-districts in South
Central Timor District. It needs to be done in-depth
analysis to see more other variables especially
location of malaria patient on risky area. The result
of this analysis can be a guide for Puskesmas and
Health Department to conduct a program of
elimination of malaria disease in South Central
Timor District.
REFERENCE
Central Berau of Statistic TTS District (2017) South
Central Timor in Number 2017. SoE.
Cohen, J. M. et al.
indices predict household malaria risk better than
land-use and land-cover in the western Kenya
Malaria Journal, 9(1), p. 328. doi:
10.1186/1475-2875-9-328.
Fisher, R. P. et al. satellite imagery and
digital elevation model analyses enabling natural
resource management in the developing world:
Singapore
Journal of Tropical Geography, 39(1), pp. 4561.
doi: 10.1111/sjtg.12210.
Haas, J. (2010)
(March), p. 103. Available at: http://www.diva-
portal.org/smash/record.jsf?pid=diva2:460111.
Health Department Republic Indonesia (1999) Modul
Epidemiologi Malaria. Edited by D. of C. A. S.
Disease.
Health Ministry Republic of Indonesia (2013) Basic
Health Research 2013. Jakarta.
Health Ministry Republic of Indonesia (2014) Malaria
guidelines management. Jakarta.
Mwakalinga, V. M. et al.
the interfaces between human and aquatic
mosquito habitats to enable barrier targeting of
Royal
Society Open Science, 5(5), p. 161055. doi:
10.1098/rsos.161055.
Nmor, J. C. et al.
predicting malaria vector breeding habitats:
Parasites and Vectors. Parasites & Vectors, 6(1),
p. 1. doi: 10.1186/1756-3305-6-14.
hillslope flow paths for distributed hydrological
Hydrological Processes, 5(1), pp. 5979. doi:
10.1002/hyp.3360050106.
Spatial Analysis of the correlation between Topographic Wetness Index with Annual Parasites Incidence Malaria in South Central Timor
District 2017 â
˘
A¸S Indonesia
379

Untuk Manajemen Risiko Dampak Perubahan
Iklim Global Terhadap Ledakan Malaria Di
Jurnal Vektora, 3(1), pp. 5380.
Display and Analysis of Satellite Imagery with a
9.
South Central Timor Health Office (2014) Health Profile.
SoE.
ICPS 2018 - 2nd International Conference Postgraduate School
380
