
Spatial Distribution Pattern of Nitraria L. in Tarim Basin
Y Feng
1,
*, H L Xin
2
, Y Li
1
and W J Li
1
1
Xinjiang Institute of Ecology and Geography, Chinese Academy of Sciences,
Urumqi, 830011, P.R. China,
2
Department of Pharmacognosy, School of Pharmacy, Second Military Medical
University, Shanghai 200433, P.R. China
Corresponding author and e-mail: Y Feng, luckfy@ms.xjb.ac.cn
Abstract. Based on the field survey and integrated with typical sample area recording, the
quantifying spatial distribution patterns of Nitraria populations were analyzed with dispersion
coefficient, average clumping index, aggregation index, Cassie index, Morisita index, and
negative binomial indexes. The results showed that the five species of Nitraria of spatial
distribution patterns are the cluster distribution, which are different in the level of aggregation,
in order of most intensity, it goes: Nitraria sphaerocarpa, N.sibirica, N. tangutorum, N.
roborowskii and N. pamirica. This is related to the population characteristics, habitat
condition and species density effect.
1. Introduction
Spatial distribution pattern is an important tool in plant ecology [1, 2]. Generally speaking, the spatial
distributions of plant species are mainly three types: there are random distribution, regular
distribution and clumped distribution. The population spatial distribution pattern is refers to
the population individual present the spatial distribution state in the community. All there are each
species biology characteristics, the embodiment of the interspecific relationship and its effect by the
environmental conditions, and it is an important attribute of the population [3, 4]. Living spatial
distribution pattern adapting to its environment is one of natural selection's results. The population
spatial distribution pattern of the study is not only quantitatively described spatial structure but also
exposing its cause, expound dynamically change in population and communities. In our study, the
dynamic spatial pattern of the dominant population in a community had been
investigated; understand the intraspecific competition and interspecific competition of life
history strategy. To grasp ecological environment status and infer basis for environmental protection
and fashioning conservation measures.
The genus Nitraria L.(Nitrariaceae) consists of 11 species grows in desert areas of Asia ,Europe,
African and Australian[5]. In China species of Nitraria mainly distributes in northwestern desert
[6,7]. There are 5 species in China and 5 species in Xinjiang province [8] . They possess the
characteristics of toleration of drought and freezing salinity sand burying, grow well in the arid and
semi-arid area of China They can easily produce adventitious roots and rhizomes and develop new
stems when covered by sand leads to a local decrease in wind velocity So they are excellent pioneer
sand shrubs for the restoration of ecosystem in desertification areas. Nitraria L. plants may have all
Feng, Y., Xin, H., Li, Y. and Li, W.
Spatial Distribution Pattern of Nitraria L. in Tarim Basin.
In Proceedings of the International Workshop on Environmental Management, Science and Engineering (IWEMSE 2018), pages 285-290
ISBN: 978-989-758-344-5
Copyright © 2018 by SCITEPRESS – Science and Technology Publications, Lda. All rights reserved
285

ecological function for an obstruction to movement of sand and stabilization of Xinjiang oasis this
paper gives an account of Nitraria the classification, resources distribution and the spatial
distributions of plant species in Xinjiang Tarim Basin. Which are can provide valuable information
for community protection and manage desert floras and rational utilization of Nitraria L. plants.
2. Materials and methods
2.1. Natural situation of the research area
Tarim basin is the largest inland basin in China, is also one of the famous arid basin in the world.
Which about 1100 km long east-west, 600 km wide north-south and 10634 square km land area.
The terrain of Tarim Basin slopes downwards from the southwest to the northeast. Mountains, plains
and desert of the three major types of landforms are total Tarim basin area of 47.3%, 21.6% and
31.1 % [9].Because is located in the inland, and surrounded by mountains, forming typical arid desert
climate. Annual sunshine hours is around 2800 ~ 3200 hours. Frost-free period is around 180 ~ 270
days. Annual average temperature is around 10 ~ 12°C , annual precipitation is around 20 -70 mm,
but annual evaporation is as high as 2000 ~ 3000 mm. All this makes desert plants lacking in variety,
sparsely distributed and giving very low coverage, the vegetative composition was simple and
dominated by xeric resistance saline and alkaline vegetative community. So the natural vegetation
mainly consists of xerophytes and desert species, including Sympegma regelii, Sarcozygium
xanthoxylon, Haloxylon ammodendron, Hexinia polydichotoma, Reaumuria soongoric, Anabasis
aphylla ,Lycium ruthenicum etc. In conclusion, the southern part of
the Tarim Basin is the most fragile eec-environment area in Xinjiang. Nitraria plants are typical
native and desert species, and it also possesses significant ecological and scientific value in
arid and semi-arid regions [10]. This paper discussed
is an important constructive and dominant species of Nitraria distribution in Tarim basin. This
vegetation is the basis of vegetation restoration and construction of the Tarim basin.
2.2. Field investigations
During vegetations growth period 2013-2014 year, the research team studied Nitraria L. spatial
distribution data of the 5 species in the arid and semi-arid Xinjiang Tarim Basin regions. Forty-five
quadrates of 10×10m were selected more representative, comprehensive and integrity in every plot,
the herbaceous species composition, individual density and coverage (%) were evaluated. Then 45
distribution plots were collected and mapped using ArcGis10.0 (Figure 1.).
Results show that the shrub of Nitraria had a distribution mainly between 37.09°-42.35°N,
74.11°-88.16°E, elevation is 840-3800 m. They have been diversified the living environment,
circle around piedmont alluvial floodplain Gobi, desert and salt desert wetlands of Tarim Basin, with
often grow widely in the fixed and semi fixed sands dune, covered sand beach. Among them, N.
sphaerocarpa and N. sibirica are widely-distributed community type, but N. tangutorum are seemed
only distributed in north of Tarim Basin. N. pamirica are only distributed at high altitudes in Pamirs
of Tarim Basin. N. roborowskii are seemed only distributed in the five counties of Tarim Basin.
IWEMSE 2018 - International Workshop on Environmental Management, Science and Engineering
286
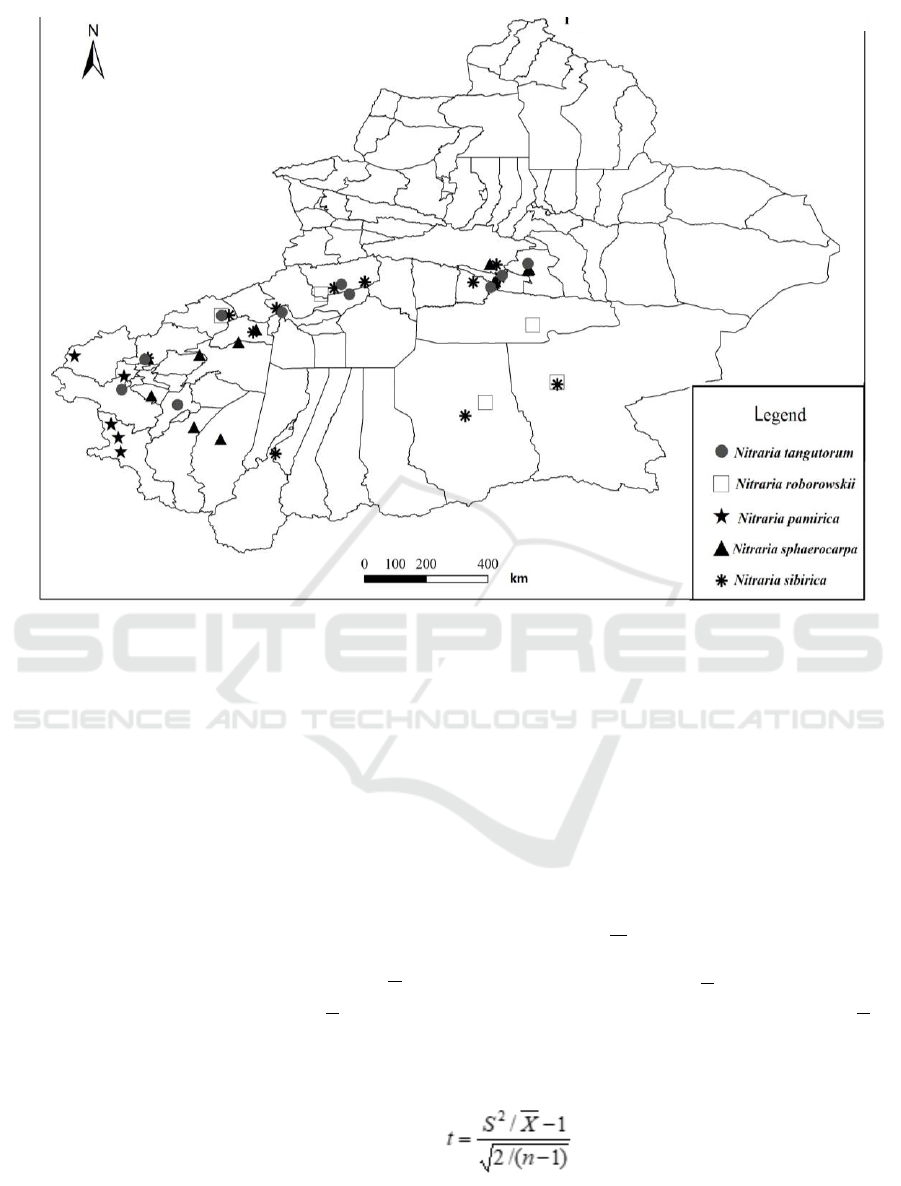
Figure 1. Distribution of the five Nitraria L.
2.3. Data analysis
The purpose of this experiment was to investigate Nitraria population dynamics, quantifying spatial
patterns and its position in the community. One of the most frequently employed methods in
detecting spatial distribution patterns of population’s is the dispersion coefficient Method,
negative binomial method and aggregation intensity index[11,12,13].
According to quadrate investigation and for above-ground vegetation individual plants per quadrat
were computed for each species of variance and mean, then spatial pattern of Nitraria was analyzed
in detail as follows.
(i)Dispersion coefficient (C) was calculated as:
XSC /
2
(1)
In the formula, S2 is sample variance, and
X
is the sample mean. When
2
S
=
X
; it indicates random
or Poisson distribution, when
2
S
<
X
distribution of the population is uniform and when
2
S
>
X
, it
indicates aggregation.
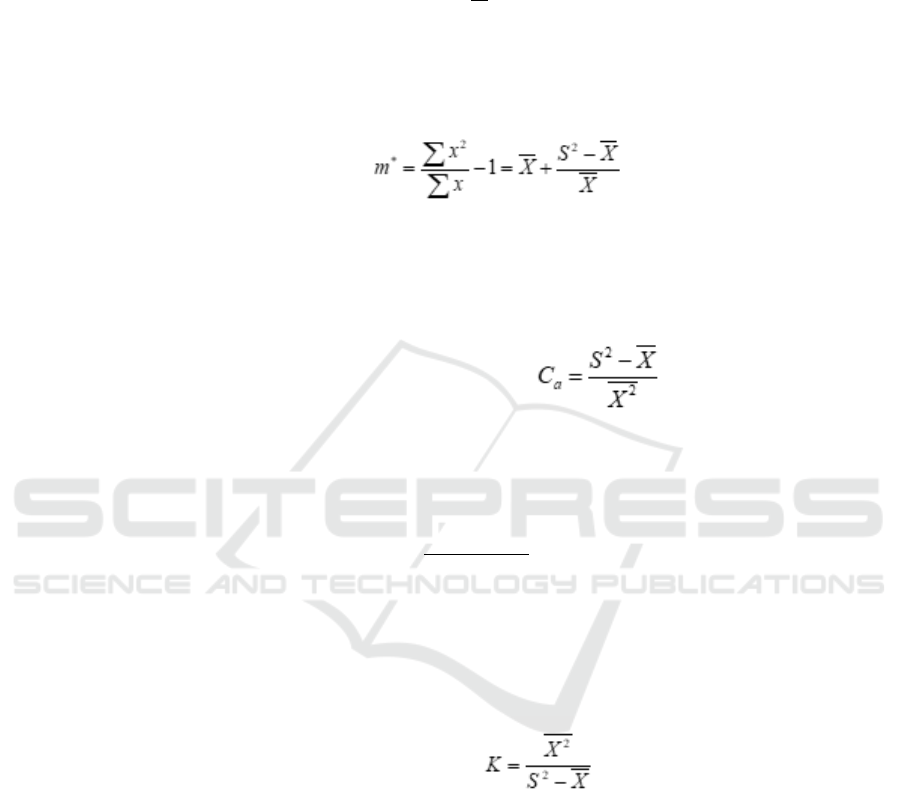
(ii) Average crowded degree (t).
(2)
Spatial Distribution Pattern of Nitraria L. in Tarim Basin
287
In the formula, n is the total number of the sampling unit, and confirm the significant level of
difference by comparing t and t (n-1).When the calculated value of T is less than the corresponding
SE (T), the population is known to follow negative binomial distribution.
(iii) Clumping David index and Moore’s index (I
t
).
1/
2
XSI
t
(3)
In the formula, If It < 0, the population will be uniform distribution, if the It > 0, it is aggregated
distribution, and if It =1, it is be random distribution.
(iv) Lloyd’s index of mean crowding index (m*) and aggregation index (m*/m).
(4)
In the formula, m* is average crowded degree, X is the number of individual in a sample plot, m is
the total mean. If m*/m < 1, the population will be uniform distribution, if the m*/m > l, it is
aggregated distribution, and if m*/m = 1, it is random distribution.
( v) Cassie index (Ca).
(5)
If Ca < 0, the population will be uniform distribution, if the Ca > 0, it is aggregated distribution, and
if Ca = 0, it is random distribution.
( vi) Morisita index (Iδ).
n
xx
xx
I
2
2
)(
(6)
x is the total number of plants in the sampling area, n is the number of quadrat in the sampling area.
If Iδ < 1, the population will be uniform distribution, if the Iδ > 1, it is aggregated distribution, and if
Iδ = 1, it is random distribution.
( vii) Negative binomial indexes (K).
(7)
K value of less than eight indicates aggregated distribution, while K values of more than eight
signifies random or Poisson distribution.
3. Results
We can see from Table1, which seven indices of pattern is well provides a simple quantitative
description of spatial patterns.
The five species of Nitraria of C Values were all greater than 1, the degree of clustered
distribution from high to low are N.sphaerocarpa, N.tangutorum, N.sibirica, N.roborowskii and
N.pamirica.
T test were 0.735-4.615, respectively, all significantly greater than 1, indicating all had a clustered
distribution based on the T -Value.
IWEMSE 2018 - International Workshop on Environmental Management, Science and Engineering
288

Table1. Spatial distribution patterns of the five species of Nitraria L.
Coenotype
Scale
(m×m)
S
2
C
T
test
I
t
m*
m*/m
C
a
I
δ
K
Pattern
N.sibirica
10*10
4.218
5.913
1.713
1.607
0.859
5.626
1.152
0.044
1.157
-22.814
C
N.roborowskii
10*10
2,542
4.583
1.555
1.121
0.709
4.138
1.103
0.052
1.116
-19.417
C
N.sphaerocarpa
10*10
5.636
4.114
1.370
4.615
1.810
4.484
1.990
0.169
1.285
14.562
P
N.pamirica
10*10
1.756
3.925
1.447
0.735
0.600
3.372
1.059
0.1129
1.087
-7.728
C
N.tangutorum
10*10
3.286
4.429
1.742
1.660
0.958
4.171
1.142
0.051
1.149
-19.618
C
* C represents clumped distribution, P represents Poisson distribution.
Clumping David index (It) were greater than 0, the results show that 5 species are clustered
distribution, but only in the range of 0.6~1.81, the degree of clustered is not so high.
5 species of m* /m values were all greater than 1, they are all clustered distribution.
5 species of Ca values were all greater than 0, they are all clustered distribution.
5 species of I
δ
values were all greater than 1, they are all clustered distribution.
K values of Nitraria sphaerocarpa is greater than 8, so Nitraria sphaerocarpa is Poisson
distribution. In addition, N.tangutorum, N.sibirica, N.roborowskii and N.pamirica are all clustered
distribution.
To this end, each values of analysis result indicating spatial distribution patterns of the five
species of Nitraria are all cluster distribution, but are different in the level of aggregation, in
order of most intensity, it goes: Nitraria sphaerocarpa, N.sibirica, N. tangutorum, N. roborowskii
and N. pamirica. These results conform to Nitraria population of fragment distribution features.
The results showed that Nitraria biomass was significantly affected by the spatial pattern. Based
on aboveground biomass production we defined Nitraria sphaerocarpa, N.sibirica as a strong and N.
roborowskii and N. pamirica as a weak competitor. The degree of clustered results is also
in agreement with 5 species of wide growth status. And the level of clustered was relied on
the density of population.
In the dunes, the relief becomes more uneven. Surface quicksand were blown away, seeds were
down to the bottom. When soil moisture and temperature of the cache microhabitat are beneficial
to seed germination, fall off in the concave of seeds will sprout, So that the population expansion,
density increased, formed a cluster distribution. Cluster distribution is more advantageous to adapt to
the harsh environment and ensure the populations multiply.
4. Discussion
This article made the conclusion below: the five species of Nitraria L. of spatial distribution patterns
are the cluster distribution. This is related to the population characteristics, habitat condition and
species density effect. Nitraria is drought shrub with propagate by seed, It owns strong adaptability
and self-reproduction ability, First the seeds grow into little plants. Then their clustered distribution
around the centre of mother plant, along with the seed scattering and the plant rhizome reproducing,
the aggregation intensity gradually strengthened and community stability gradually increased .The
population diffusing periods are intrude into and settle down mother plant of matrix centered.
Nitraria growth environment is more severe, the structure of community was not perfect,
having relatively few species and low coverage. Therefore, gathered strength is plants reduce specific
competition relations, avoid animal feeding, and also is the important strategy to maintain
community stability. In order to adapting to the bitter natural geographical environment and a race
for limited resources, the shrub of Nitraria occupies dominant status to survive by clannishness and
X
Spatial Distribution Pattern of Nitraria L. in Tarim Basin
289

the cluster distribution. Generally speaking, the high community stability, the power dominant
species cluster degree. So, the stability of the community is in proportion to cluster degree [14].
It is a consequence of Nitraria modern distribution pattern is a historical period, geology, climate
and human activity, as so on. Correct analysis of the Nitraria situation and find out the cost of
management measures is a very urgent task. Because of Nitraria living from arid land that not only
gets little rain but also has been damaged by overgrazing, deforestation and human destruction.
Under drought stress, Nitraria of the branches are aging, and new branches germination ability weak
and low seed setting percentage. Nitraria resource has been gradually reduce
[15].All this influences soil conservation, ecological balance, climate adjustment, and windbreak
and sand-fixation. Nitraria habitats are very fragile, where natural resources are depleted. Maintain
and improve the ecological system of Nitraria helps to maintain ecosystem balance and prevent land
desertification in south of Xinjiang.
Acknowledgements
This research was supported by the National Science Foundation of China “Phylofloristics Study on
the shrub flora in Xinjiang” (NSF-31770227) and the Province Natural Science Foundation of
Xinjiang (Y553151). We would like to thank Mr.Yan Li, Mr. Aergen, who assisted us collected
Nitraria sample in the field.
References
[1] Tilman D and Kareiva P 1997 Spatial Ecology: The Role of Space in Population Dynamics
and Interspecific Interactions (Princeton: Princeton University Press)
[2] Dieckmann U, Law R and Metz J A J (Eds.) 2000 the Geometry of Ecological Interactions:
Simplifying Spatial Complexity (Cambridge: Cambridge University Press)
[3] Legender P and Fortin M J 1989 Spatial pattern and ecological analysis Vegetation
80:107-138
[4] Levin S A 1992 The problem of pattern and Scale in Ecology. Ecology 73:1943-l967
[5] Pan X L, Shen G M and Chen P 1999 A Preliminary Research on Taxonomy and Systematics
of Genus Nitraria.Acta Botanica Yunnanica 21 (3) :287-295
[6] Liu Y X 1998 Nitraria In: Xu Langran & Huang Chengchiu, eds. Fl. Reipubl. Popularis
Sin( Zygophyllaceae) 43(1): 116-123
[7] Liu Y X 2008 Nitraria L In: Wu Z Y, P H. Raven .Flora of China,( Nittrariaceae)(Beijing:
Science Press and St. Louis: Missouri Botanical Garden Press) chapter 11 pp 41-45
[8] Fan J H and Yang C Y 2011 Nitraria L. In: Flora Xinjiangensis. (Urumqi: Xinjiang
Scienceand Technology Publishing House) chapter 3 pp 303–305
[9] Fan Z L, Ma Y J, Fang J and Wang R H 2001 Relations Retween Exploitation-utilization of
Water Resources and Oasis Evolution and Ecological Balance in Tarim Basin. Journal of
Natural Resources 16(1): 22- 27
[10] Mu G J 1995 Types, Origin and Evolution of the Vegetation Cones of Taklimakan Desert Arid
Zone Research 12 (suppl.): 31-37.
[11] L loyd M L1967 Mean crowding Journal of Animal Ecology 36 1-30
[12] Morisita M 1971 Composition of the Iδ index. Researches in Population Ecology 13 1-27
[13] Lan G Y and Lei R D 2003 Brief introduction of Spatial Methods to Distribution Patterns of
Population Journal of Northwest Forestry College 18 (2) :17-21
[14] Hu K, Li Y, Li D L and Zhu G Q 2012 Spatial Distribution Pattern of Desert Plants
Zygophyllum Xanthoxylum. Journal of Southwest forestry University 32 (4):2095-1914.
[15] Liu Y X 1995 A Study on Origin and Formation of the Chinese Desert Floras 33 (2) :132-143
IWEMSE 2018 - International Workshop on Environmental Management, Science and Engineering
290
