
Shoreline Changes Due to Breakwater around Navigation Channel of
Belawan Port
Chairunnisa, Siti Nur Atiah and Rizki Wahyuni
Civil Engineering Department, Universitas Jenderal Achmad Yani, Cimahi, West Java, Indonesia
Keywords: Shoreline, Breakwater, Belawan Port.
Abstract: Shoreline change is caused by longshore sediment transport which is the effect of nearshore wave induced
current. Other causes are physical condition and coastal geomorphology such as bathymetry contour and
coastal protection structure. This paper studies shoreline change in Belawan Port which is located in North
Sumatra, Indonesia. In study area, breakwater is proposed to protect the navigation channel of Belawan Port
from sedimentation problem. The objective of this study is to predict shoreline change around Belawan Port
due to the existence of breakwater by using one-line model, GENESIS. GENESIS is used for predicting the
behaviour of shorelines in response to coastal engineering and/or beach replenishment activities that may
affect long shore sediment transport. The input of the model are bathymetry contour and shoreline position,
waves characteristics (height, period and direction), median sediment diameter (d50), and structure position
and its estimate permeability. The output of the model is the change of shoreline position after a period of
time. Shoreline change around Belawan Port has been analysed under the effects of existing breakwater.
The existence of breakwater can change the natural balance of sediment transport and affect the shoreline
change that occurred.
1 INTRODUCTION
Shoreline change is a natural process which caused
by sediment transport. Sediment can be transported
by current (gravity-, wind-, wave-, tide- and density-
driven currents), by the oscillatory water motion
itself (wave-related transport) or by a combination of
currents and short waves, while in coastal waters the
sediment transport processes are strongly affected by
the high-frequency waves which generally act as
sediment stirring agents; the sediments are then
transported by the mean current (Rijn, 1993).
Shoreline change is primarily driven by the gradients
in total longshore sediment transport and by the
cross-shore transport owing to variability in incident
wave energy (Idier, et.al, 2018). Longshore and
cross-shore sediment transport leads to shoreline
changes, and an accurate prediction of sediment
transport is possible only if the wave and current
hydrodynamics of the coastal area is well understood
(Balas, et.al, 2011).
The development of coastal structures
significantly affects the natural balance of sediment
transport and may cause erosion and accretion in the
coastal areas. The main problems in coastal structure
development is determine sediment movement
patterns or shoreline change patterns that have been
happened or will happen to certain period of time.
By knowing the pattern that happened then the
optimal coastal structure development will be
achieved (Pranoto, 2007).
Shoreline changes due to coastal structures
existence is studied by many researchers. Vaidya et
al. (2015) studied shoreline response to coastal
structure, the result showed there was deposition on
the up drift side and erosion on the down drift side
of the groin, the effect of the increased length of the
groin beyond surf zone is almost negligible, and
since a longer groin traps most of the sand it results
in more erosion on the down drift side. Balas et al.
(2011) observed erosion between two existing
coastal structure, groin and breakwater, which
happen because this groin disturbs the sediment
transport that feeds the beach, and based on
numerical study that to prevent the erosion it is
necessary to remove the previously constructed
groin.
Mathematical modelling of shoreline change is
very useful for understanding and predicting the
long-term evolution of the sandy beaches due to the
Chairunnisa, ., Atiah, S. and Wahyuni, R.
Shoreline Changes Due to Breakwater around Navigation Channel of Belawan Port.
DOI: 10.5220/0008374000550059
In Proceedings of the 6th International Seminar on Ocean and Coastal Engineering, Environmental and Natural Disaster Management (ISOCEEN 2018), pages 55-59
ISBN: 978-989-758-455-8
Copyright
c
2020 by SCITEPRESS – Science and Technology Publications, Lda. All rights reserved
55
construction of these coastal structures. This paper
study the shoreline changes due to breakwater
around navigation channel of Belawan Port, so the
effect of this structure in the future can be estimated.
2 STUDY AREA
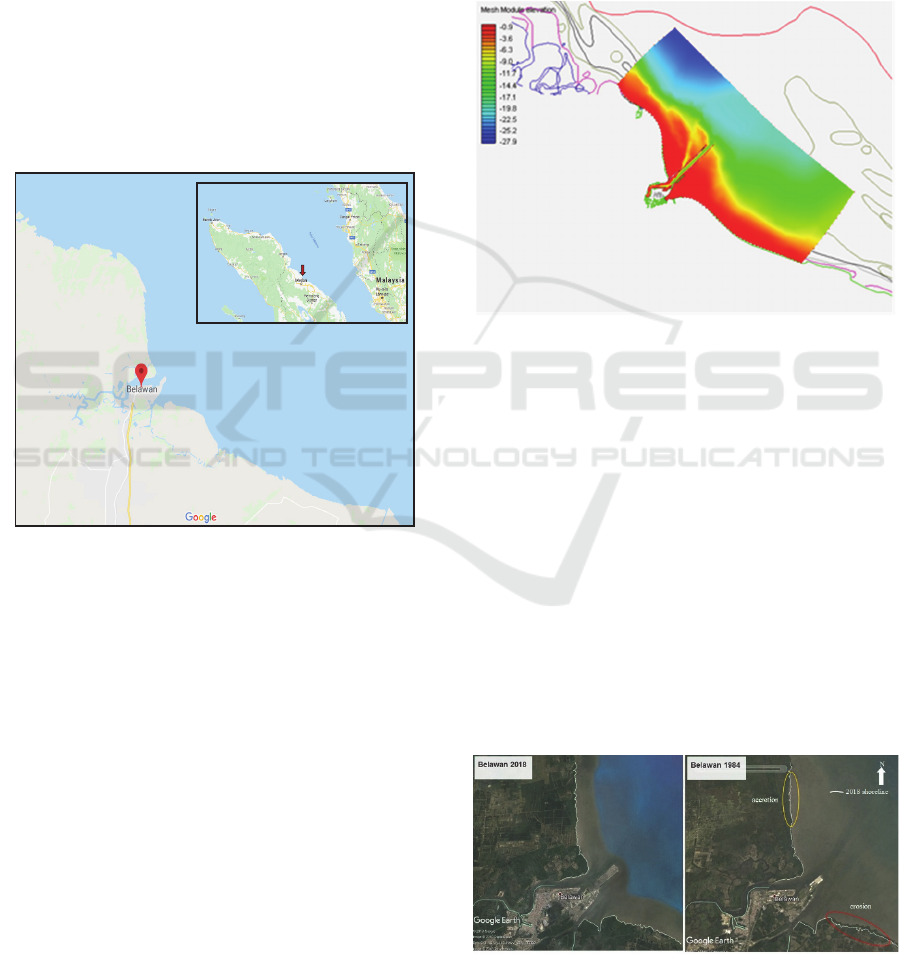
Belawan Port is located in North Sumatera,
Indonesia. Its mathematical coordinates are 03°47’
North Latitude and 98°42’ East Longitude. The
location of Belawan Port is very strategic, adjacent
to the Malacca Strait which is an international
navigation lane. As the gateway to the economy of
the North Sumatra region, Belawan Port must
increase port services in the form of facilities and
equipment.
Figure 1: Belawan Port Location.
One of the keys to the development of Belawan
Port is the improvement of navigation channel
capacity, which can be done with several
development scenarios such as increasing the width
of the navigation channel and its depth, or by
determining the location of a new channel. However,
considering the natural condition of Belawan port is
located in the mouth of two rivers and open water,
so naturally it has problems with the hydraulic and
environmental aspects which have the potential to
cause sedimentation. Thus, the planned development
scenario must be able to respond to these natural
phenomena. The sedimentation phenomenon is a
consequence of the existence of Belawan Port, so
that sedimentation behaviour needs to be well
recognized so that port development can be carried
out optimally.
Figure 2 present a scenario that proposed for
Belawan Port development with considering the
sedimentation phenomenon. In the scenario, a new
location of navigation channel is proposed with -14
m LWS depth, 140 m width, and 1: 6 slope. To
prevent sedimentation, the Belawan river was
diverted, and the breakwater is proposed to be built
in the left and right of the navigation channel from
shore area until -10 m depth. The length of the
breakwater is about 9-10 km.
Figure 2: Belawan Port Development Scenario.
In addition to the phenomenon of sedimentation
in Belawan, there have been significant shoreline
changes around the Port of Belawan. This can be
observed by comparing the shoreline on 1984
satellite imagery with 2018 (Figure 3). In a period of
34 years there has been considerable erosion and
accretion. Erosion occurred on the coast to the right
of Belawan port which reached ± 200 m, while
accretion occurred on the coast to the left of
Belawan Port which reached ± 100 m. The amount
of erosion and accretion that occurs, shows that the
shore around Belawan Port are quite dynamic.
Considering the length of the proposed breakwater is
quite long, 9-10 km, it certainly will have an effect
on the balance of the natural sediment transport in
that location, so that it needs further analysis.
Figure 3: Belawan Shoreline Position in 1984 and 2018.
ISOCEEN 2018 - 6th International Seminar on Ocean and Coastal Engineering, Environmental and Natural Disaster Management
56

3 METHODOLOGY
Generally, this study is carried out following the
stage of data collection, literature study, data
analysis, simulation, and evaluation. The flow chart
can be seen in Figure 4.
Figure 4: Flow Chart of Study.
Data collection includes the information of
coastal area (shoreline position), bathymetry
contour, global map, wind data (velocity and
direction), sediment size, and other related data.
Analysis is conducted for wind data. Wind data is
analysed statistically to get the dominant wind event
at study area, and to forecast wave event using
hindcasting analysis. The result of hindcasting
analysis is time series of wave height and wave
period. Wave time series, shoreline position, median
sediment diameter (d50), and structure position and
its estimate permeability, will be used as the input
for shoreline change simulation with GENESIS.
Furthermore, shoreline change due to breakwater
around navigation channel of Belawan Port can be
predicted.
3.1 Shoreline Changes Model
GENESIS (generalized model for simulating
shoreline) is numerical modelling system that is
designed to simulate long-term shoreline change at
coastal engineering projects (Hanson, 1989). This
model can estimate the value of long shore transport
rate and shoreline changes due to sediment transport
without or with a coastal structure for a certain
period. The simulating steps can be seen in Figure 5.
Figure 5: Simulating Step by GENESIS.
The calculation process is carried out by
predicting longshore transport based on the shape of
the beach face, while shoreline forecasting will be
calculated by considering longshore transport aspect
that occurs. The longshore transport rate (Q) has a
unit of m3/year, because the movement is parallel to
the coast so there are two alternative movements, the
right and left relative to an observer standing on the
beach facing the sea. Left movement is Qlt, and right
movement is Qrt, so that obtained gross sediment
transport rate (gross), Qg = Qlt + Qrt and level of net
transport (net), | Qn | = Qlt – Qrt.
Qg values are used to predict siltation levels in an
open water channel, Qn is used for protected groove
designs and estimates of coastal erosion, and Qlt and
Qrt for the design of sediment build up behind a
coastal structure that withstand sediment movement.
In the calculation of the Genesis model, longshore
transport calculations are carried out using the result
of equation modification from the equation:
Q (+) = ½ (Qg + Qn) (1)
Q (-) = ½ (Qg – Qn) (2)
The results of the modified equation are written
in the following equation:
b
b
b
s
B
g
k
k
),a(
ρ
ρ
CH
Q
tan416,1
cos
2sin
2
416118
2
1
2
(3)
Where:
H = wave height
Cg = speed of wave motion (based on wave
theory linear)
Shoreline Changes Due to Breakwater around Navigation Channel of Belawan Port
57

a = 1 - sand porosity in the coastal area
ρs = sand density
ρ = density of water
θb = the angle of breaking waves is measured
from the local coastline
k1 = approach coefficients form the relationship
between transport values and long shore energy
k2 = coefficient of comparison between beach
slope and breaking wave height
tan β = slope of the coastline along the surf
zone area until the longshore sand transport
4 RESULT AND DISCUSSION
4.1 Wind and Wave Condition
The wind events in 1992-2001 at Belawan Port
showed in Table 1.
Table 1: Percentage of Wind Events in 1992 – 2001.
Percentage of Wind Events
Direction
Wind Velocity (knot)
<10 15-10 15-20 20-25 >25 Total
North 3.621 0.405 0.037 0.001 0.003 4.07
Northeast 13.099 2.106 0.082 0.017 0.004 15.31
East 3.543 0.749 0.064 0.003 0.003 4.36
Southeast 2.113 0.182 0.028 0.012 0.000 2.33
South 3.144 0.084 0.019 0.009 0.001 3.26
Southwest 5.252 0.113 0.036 0.013 0.004 5.42
West 6.054 0.14 0.015 0.006 0.003 6.22
Northwest 3.841 0.233 0.036 0.004 0.003 4.12
Percentage of wind events 45.08
Percentage of calm 54.92
Total 100
The wind event in the port of Belawan is
45.08%, with the dominant wind coming from the
Northeast which is 15.31%, while the calm condition
(no wind) is 54.92%.
Wave data is obtained from wind data analysis,
hindcasting. The result of hindcasting is wave height
and wave period. The wave events in 1992-2001 at
Belawan Port showed in Table 2.
Table 2: Percentage of Wave Events 1992-2001.
Percentage of Wave Events
Direction
Wave Height (m)
<0.25
0.25-
0.5
0.5-
0.75
0.75-1 1-1.5 Total
North 2.65 0.53 0.08 0.01 0 3.27
Northeast 7.95 3.39 1.49 0.53 0.10 13.47
East 2.26 0.78 0.29 0.11 0.07 3.51
Southeast 1.32 0.27 0.10 0.03 0.00 1.72
Northwest 3.06 0.45 0.10 0.02 0.00 3.63
Percentage of wave events 25.60
Percentage of calm 74.40
Total 100
The wave event in Belawan port is 25.6% with
the dominant wave coming from the Northeast
which is 13.47%, while the calm condition (no
wave) is 74.4%.
4.2 Shoreline Change Prediction
Shoreline change prediction has been analysed by
GENESIS, in two conditions, without and with
breakwater, based on the development scenario that
proposed. The length of shoreline which analysed is
nearly 9900 m, with grid interval is 100 m. The
initial shoreline that simulated is based on shoreline
in 2008. The result of simulation without breakwater
will be compared to shoreline in 2018 to obtain the
best calibration coefficient (K1 and K2). The median
sediment diameter (d50) is 0.086 mm, which is
obtained from survey result. The wave parameters
that used in this simulation are the result of
hindcasting analysis from 10 years of wind data,
1992-2001. The beach slope is 0.005, and the
permeability of breakwater is assumed 0.8.
Figure 6: Belawan Shoreline Position in 2008.
ISOCEEN 2018 - 6th International Seminar on Ocean and Coastal Engineering, Environmental and Natural Disaster Management
58
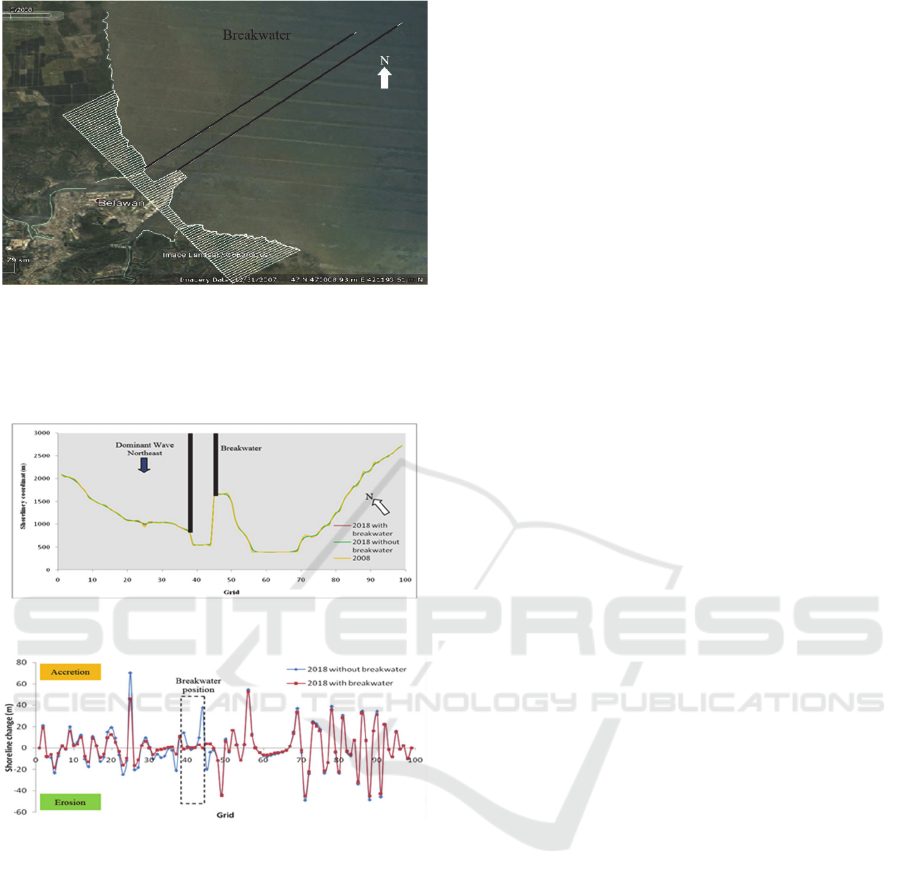
Figure 7: Simulation Grid.
Figure 8 show the prediction of shoreline position in
2018, and Figure 9 show the erosion and accretion
which occurred and caused shoreline change.
Figure 8: The Prediction of Shoreline Position in 2018.
Figure 9: The Prediction of Shoreline Change in 2018.
The first simulation (without breakwater) is
proposed to obtain the calibration coefficients with
comparing accretion and erosion from simulation
result with accretion and erosion that observed from
satellite images (Google Earth). The best calibration
coefficient K1 and K2 are 0.08 and 0.4. From the
simulation result, there is erosion and accretion in
some place which cause shoreline change. The
average erosion is -6.8 m and the average accretion
is 7 m.
From Figure 9, it showed the effect of
breakwater existence (breakwater position are in
grid 39 and 45). Inside navigation channel, the
existence of breakwater can decrease accretion. The
breakwater existence doesn’t change the pattern of
accretion and erosion that occurred, but it decreases
the amount of accretion and erosion. In the left side
of breakwater position, the decreasing of accretion
and erosion is bigger than the right side. Considering
the incoming wave direction and the layout of
breakwater, breakwater might protect the shore from
the East wave that effect in decreasing accretion and
erosion. The East wave is not the dominant event,
but it has medium amplitude.
5 CONCLUSION
Shoreline position can change due to sediment
transport, longshore and cross-shore. In this study,
shoreline change due to longshore sediment
transport has been simulated by GENESIS. The
existence of breakwater can change the natural
balance of sediment transport and effect the
shoreline change that occurred. In this study, the
breakwater has 9-10 km length, as a long structure, it
also protects the shore from incoming wave which
effect decreasing the amount of accretion and
erosion.
In this study, the analysis of longshore sediment
transport is caused by longshore current which is
wave-driven current, and not consider the effect of
another current (gravity-, wind-, tide- and density-
driven currents). For further study it is suggested to
analyse the longshore sediment transport which is
caused by mean-current, and also consider sediment
input from the river in order to have more accurate
result.
REFERENCES
A. M. Vaidya, S.K. Kori, M.D. Kudale, 2015. Shoreline
Response, Aquatic Procedia 4, 333 – 340
H. Hanson, N.C. Kraus, 1989. GENESIS, Report 1,
Technical Report CERC-89-19.
L. Balas, A. Inan, and E. Yılmaz, 2011. JCR, SI 64, 460-
463
Robinet, D. Idier, B. Castelle, V., 2018. Marieu, Shoreline
Change Model, Environmental Modelling & Software
Vol. 109, 1-16.
S. Pranoto, Perubahan Garis Pantai, 2007. Berkala Ilmiah
Teknik Keairan Vol. 13.
Van Rijn, L., C., 1993. Sand Transport Formula. URL
http://www.leovanrijn-sediment.com/
Shoreline Changes Due to Breakwater around Navigation Channel of Belawan Port
59
