
The Determinant of Willingness to Pay for Waste Management in
Slum Area
Debby Claudia Sellyanne, Didik Susetyo, Imelda, Fachrizal Bachri, Deassy Apriani
and Muhammad Subardin
Faculty of Economics, Universitas Sriwijaya, Palembang, Indonesia
Keywords: Contingent Valuation Method (CVM), Willingness to Pay (WTP), Waste Management, Slum Area
Abstract: This study aims to determine the willingness to pay for waste management and to analyze the factors that
influence it. This study uses primary data through questionnaires to 120 people as respondents in Seberang
Ulu I and Ilir Barat II districts. This study uses the Contingent Valuation Method (CVM) and Multiple Linear
Regression Analysis. The results of this study indicate that 110 respondents said that they were willing to pay
and 10 respondents said that they were not willing to pay for waste management. The average amount of
waste management costs that are willing to be paid is Rp. 5,645.45. Age and income variables have a positive
and significant effect while the type of work has a negative and significant effect on the willingness to pay
for waste management. The variable of level educations, family members, and characteristics of slums have
no significant effect.
1 INTRODUCTION
Cities are urban areas that have administrative status
as a city, both small municipalities and metropolitan
cities (Sjafrizal, 2012: 198). The city is very
important because urban areas have a function in
social life which is a place of population settlement
and various economic and social activities. In
addition, a city is called to develop if the provision of
facilities and infrastructures can offset the needs of
the population in the city (Samli, 2012: 74).
Palembang as the capital city of South Sumatra
experienced rapid development. An increase in the
number of migrants to the city of Palembang caused
an increase in the need for housing.
The need for housing should be in accordance
with population growth. However, efforts to fulfill
housing needs are partly hampered by the low
economic capacity of some communities and the high
cost of housing. For low-income earners, it is a big
problem, this is caused by their low economic and
educational capacity, so it is not possible to fulfill a
decent place to live (Pinem, 2010: 71).
The problems cause people to choose to live in
residential houses with minimum facilities and cause
the emergence of slums themselves. In general, the
emergence of slum areas can be seen from the pattern
of housing and settlements in the city of Palembang.
(Preparation or Database Updating of Housing and
Slum Area Conditions in Palembang City, 2009: 3).
The creation of slums is a negative impact of a
concept of development. This condition is further
aggravated by the decline in environmental quality
due to inadequate availability of city infrastructure
(Preparation or Database Database of Housing and
Slum Area Conditions in Palembang City, 2009: 2).
In addition, an increase in the population also causes
an increase in consumption of goods and services that
cause community life problems, one of which is the
problem of waste (Ruban, Angela et.al, 2014: 103).
The most dominant problem in the slums area in
Palembang City is garbage that is dumped carelessly
by the surrounding community so that it accumulates
around the settlements. The landfill can have negative
impacts on the environment and society such as the
source of the disease, blockage due to waste disposal
in the river or ditch, pollution and damage to the
beautiful environment, reduced quality of clean
water, odor around the environment, disturbing the
comfort of the community.
In some sub-districts of Palembang City, waste
management is carried out by janitors who collect
Claudia Sellyanne, D., Susetyo, D., Imelda, ., Bachri, F., Apriani, D. and Subardin, M.
The Determinant of Willingness to Pay for Waste Management in Slum Area.
DOI: 10.5220/0008441104390447
In Proceedings of the 4th Sriwijaya Economics, Accounting, and Business Conference (SEABC 2018), pages 439-447
ISBN: 978-989-758-387-2
Copyright
c
2019 by SCITEPRESS – Science and Technology Publications, Lda. All rights reserved
439

garbage that has been placed in the garbage can in
front of the house. However, it will be very different
if the area does not have access to waste management.
One of the slums with related problems in the lack of
waste management is in Seberang Ulu I and Ilir Barat
II Subdistricts.
The conditions of Slum Areas in Seberang Ulu I
(SU I) and Ilir Barat II (IB II) Subdistricts are already
very crowded with predominantly stilted houses and
most of the buildings are still made of wood. Clean
water supply is also inadequate so people still rely on
refill water or river water to fulfill their lives. In the
waste treatment system, this area has not been
managed by the relevant government or agencies due
to the limited access and equipment. Sanitation is still
so bad that local people still throw garbage directly
into the river or on their home page. This factor
causes the level of slums in Seberang Ulu I and Ilir
Barat II to be very high (Preparation or Database
Database of Housing and Slum Area Conditions in
Palembang City, 2014: 30).
If waste management in slum areas has not been
overcome then it will be a worse problem for the
community and the environment. In addition, the
burden of government costs in managing waste will
be even higher. To overcome these problems, the
need to apply environmental insights about waste
management for example by forming community
self-help in waste management such as forming a
waste bank so that people can manage the waste into
economic value.
In creating self-help groups, the community does
not need a small fee so that it requires collaboration
between the government and the community. This
collaboration can begin with the willingness of the
community to set aside a little income to help the
government in waste management. If people want to
return to a clean environment, then the community
will be willing to spend some money to pay for it.
This is the basis of research by looking for
willingness to pay the community in improving the
surrounding environment. Many factors can influence
the willingness to pay for waste management, namely
age, level of education, family members, income,
employment and characteristics of slums. According
to Suryani (2016), age influences the willingness to
pay individuals because of increasing age, the
mindset of public awareness will increase. In
addition, it is also supported by research conducted
by Vitor (2013) that the fact is that if they get older,
they will increasingly understand the importance of
maintaining a clean environment. In addition, they
know that paying for waste management will improve
the quality of the environment. Afifah, et, al (2013)
stated that high education affects someone to pay a
large amount. This was also supported by Ifabiyi in
Ladiyance and Yuliana (2014) that higher education
had a higher willingness to pay. In Brazil and India,
it is reported that households with higher education
tend to be willing to pay more. This variable is
considered influential because generally, people with
better levels of education tend to better understand the
importance of protecting the environment.
The family members is also considered to affect
the willingness to pay. According to Prasetyo and
Saptutyiningsih (2013), the number of family
dependents is related to the amount of expenditure
that will be incurred by the family. Widiastuti (2014)
explained that if a family with more members would
spend money on their daily needs, the allocation of
funds for the environment would be reduced. But if
the family is covered a little, it will give a greater
value. Income is one factor that influences the
willingness to pay. If a high determined price with
their income will slightly affect the value of the
payment. In a study conducted by Saptutyiningsih
(2007) that the income received affects the
willingness to pay for the community because the
higher the income, the higher the value issued to
improve the quality of the environment. Conversely,
if the income obtained is low then the value issued
will also be low.
In addition to income, the type of work done by
the community is also a factor. Formal and permanent
work with the high economic capacity gained, the
greater a person's ability to maintain and improve the
quality of the environment. Conversely, if you have
an informal job with the income that is not fixed, a
person's willingness to improve the environment is
low due to the many expenses they must prioritize
first. Widiastuti (2014) explains that people who have
formal jobs such as private or public employees have
a definite income every month so they tend to pay a
high value. As for informal, the income is uncertain
so it provides a lower value. Furthermore, the
influencing factors are the characteristics of slums.
Generally, for people who live in heavy slums, they
will be willing to pay more because they are disturbed
due to an unclean environment. In accordance with
research by Widiastuti (2014) who argued that people
who feel disturbed by the presence of waste will pay
more than the people who do not feel disturbed by the
presence of garbage around the home garden.
SEABC 2018 - 4th Sriwijaya Economics, Accounting, and Business Conference
440

2 LITERATURE REVIEW
Economic valuation is one of the ways used to
provide a quantitative value for goods and services
produced by natural and environmental resources on
market values and non-market values (Igunawati,
2010: 30). According to Fauzi (2004: 212), resource
valuation techniques that cannot be marketed (non-
market valuation) can be classified into two groups.
The first group is a group consisting of revealed
desire techniques or revealed WTPs. Some of the
techniques included in this group are the travel cost
method, hedonic pricing, and random utility models.
Whereas the second group is valuation techniques
based on surveys where the willingness to pay or
willingness to pay is obtained directly by asking
individuals or the community about their desire to pay
for goods and services produced by natural resources.
The technique often used is the Contingent Valuation
Method (CVM).
Formally, the willingness to pay or willingness to
pay (WTP) is someone against goods and services
produced by natural resources and the environment
(Fauzi, 2004: 209). In the WTP, it is calculated how
far the ability of each individual or community to pay
or spend money to improve the quality of the
environment or its surroundings to suit the desired
conditions. Rahmawati (2014: 42) explains that
individual preferences for the value of damage,
environment, discomfort, and increase or decrease in
the level of welfare of the users and management of
resources differ from one another. Therefore, various
PAPs arise for each person in relation to their views
on the WTP value.
The economic value of resources and the
environment can be obtained directly by asking
individuals or the community about the willingness to
pay for goods and services produced by natural
resources through the Contingent Valuation Method
(CVM). CVM aims to find out the willingness to pay
from the community, for example, to improve
environmental quality (water, air, etc.). Hanley and
Spash in Sontikasyah (2010: 35), stated that CVM is
a way of directly calculating the willingness to pay to
the public by the point of preference of individuals
assessing objects whose emphasis is on the standard
value of money. This method allows all commodities
not traded in the market to be estimated for economic
value. Thus, the economic value of a public object can
be measured by the concept of WTP.
According to Fauzi (2004:220), in the operational
phase, the application of the CVM approach consists of
five stages: 1) Making a market hypothesis, 2) Obtaining
auction value 3) Calculating the average WTP, 4)
Estimating the Auction Curve, 5) Aggregating data.
3 RESEARCH METHODS
This study discusses about the value of community
willingness to pay in waste management in Slum
Areas in Seberang Ulu I and Ilir Barat II as well as
analyzing the age factor, recent education,
employment, income, number of family members
covered and characteristics of slums affecting
willingness to pay communities in waste management
in slums areas Seberang Ulu I and Ilir Barat II. The
dependent variable in this study is the willingness to
pay and the independent variables in this study are
age, education, income, occupation, family members
and characteristics of slums.
The population of this study was residents who
lived in slums in the city of Palembang using cluster
sampling technique, so the most slum areas were
chosen, namely in Seberang Ulu I and Ilir Barat II.
Furthermore, from the two sub-districts will be in the
village based on the level of slums with the priority
scale of treatment that has been determined, namely
15 Ulu, 3-4 Ulu, 5 Ulu, 30 Ilir, 29 Ilir and 28 Ilir
Subdistricts. each RT in the village needs to estimate
the proportion of the sample that can be calculated by
the formula (Supranto, 2008: 55):
Based on the calculation of the formula, the
sampling used in this study is 100 respondents but so
that the data is not biased it will take 120 respondents.
Population research samples can be seen in Table 1
which shows the number of respondents to be taken
in each village.
The Determinant of Willingness to Pay for Waste Management in Slum Area
441

Table 1: Sample of Research in Seberang Ulu I District and
Ilir Barat II
District
Area
Number of
Location
Number of
Respondents
5 Ulu
RT
4,5,6,7,8,9,10,11,12,1
3,14,15,20,
21,33,34,54,55,56,57,
58
21
35
3-4 Ulu
15 Ulu
30 Ilir
29 Ilir
28 Ilir
RT
2,3,4,5,12,19,24,52
RT 21,2
RT
1,2,3,4,5,6,7,8,8A,9,9
A,10,11,12,13,14,15,1
6,17,18,19,20,20A,22,
22A
RT
1,2,5,13,21,33,35
RT 4,6,13
8
2
26
7
3
17
8
39
11
10
Total
120
The method used in this study is the Contingent
Valuation Method (CVM). To calculate the WTP, the
total willingness to pay (TWP) formula is used as
follows: (Kadir in Handayani, 2015: 7)
TWTP = Σ WTPi (ni/N)P
Multiple linear analysis methods are used to
measure the impact of age, level of education, the
number of family members covered, work and
income characteristics of slums that affect the
willingness to pay for waste management in slums in
Ulu I and Ilir Barat II Districts. Based on these
equations, the models in this study are as follows:
WTP = β +β
1
US
1
+β
2
PT+β
3
JT
3
+β
4
PEN
4
+β
5
DPEK
5
+ β
6
DKPK
6
+ e.
The model used to calculate dummy variables is
(Nachrowi and Usman, 2007):
α +
From this model, it can be seen that:
E(Yi | Di = 1 ) = α +
E(Yi | Di = 0 ) = α
3.1 Definition of Operational Variables
Table 2: Definition of Operational Variables
Variables
Definition
Unit
Willingness to Pay
Willingness to pay paid
by the community
Rupiah
Age
Age of worker
Year
Level of education
The number of years of
education has been
reached.
Year
Income
Type of Work
Total liabilities
Characteristics of
Slum Area
The amount of total
expenditure spent
Work in daily life
The number of people
who are dependent on
the head of the family
based on the surrounding
environment
Rupiah
1 = Informal
0 = Formal
Person
1=Slum Light
2 = Moderate Slum
3 = Heavy slums
4 RESULTS AND DISCUSSION.
4.1 Age Cross Tabulation on WTP
Age is a factor that can affect WTP. Age shows a
person's maturity, the older a person means to have a
wider awareness of a better environment.
Table 3: Cross Tabulations of Age and WTP
Willingness to
pay (Rp)
Age (Year)
Total
20-40
41-60
61-90
0
9
1
0
10
3000-5000
6000-10000
11000-12500
52
6
0
32
8
4
8
0
0
92
14
4
Total
18
45
8
120
Source: Primary Data, 2018
Table 3 shows that the 3000-5000 WTP score was
chosen by respondents aged 20-40 years, compared to
respondents who were more than 40 years of age.
This is because the majority of people under the age
of 40 have the desire to pay but there is still much they
have to spend on household matters
SEABC 2018 - 4th Sriwijaya Economics, Accounting, and Business Conference
442

4.2 Cross Tabulations of Level
Educations and WTP
The level of education is closely related to one's
knowledge of the surrounding environment. The
factor of education is important because it influences
the mindset of a person to take action to maintain the
quality of the environment and has the desire to make
goods an economic value.
Table 4: Cross Tabulations of level educations and WTP
Willingness
to pay (Rp)
Level of
educations
(year)
Total
0-6
7-12
13-
20
0
3
6
1
10
3000-5000
6000-10000
11000-12500
47
4
1
44
5
0
1
5
3
92
14
44
Total
18
45
8
120
Source: Primary data, 2018
Table 4 shows that respondents with education
range 0-6 years have the desire to pay for waste
management even though the smallest WTP value is
from the range of WTP value of Rp. 3,000 - Rp.
5,000. This is also supported by the results of their
interviews that they are willing to pay if the price is
not too expensive. In addition, although many
elementary school graduates, respondents know
about the benefits of waste management and they
agree if waste management activities are carried out
4.3 Cross Tabulations between Type of
Work and WTP
The job also influences the willingness to pay. If you
have an informal job, someone's willingness to
improve the environment will be low, and vice versa.
Table 5 shows the relationship between types of work
and WTP. Based on the table, many respondents who
work informally choose a value of IDR 3,000-IDR
5,000. This means that informal work affects the
value of the WTP they choose. Whereas for
respondents who choose not to pay because their non-
permanent work affects income so that they are not
necessarily able to pay the fee every month.
Table 5: Cross Tabulations between the level of education
and WTP
Willingness to
Pay (Rp)
Type of Work
Total
Informal
Formal
0
10
0
10
3000-5000
6000-10000
11000-12500
90
8
1
2
6
3
102
14
4
Total
109
11
120
Source: Primary data 2018
4.4 Cross-tabulation Income and WTP
Income also affects WTP, if the respondent has a
small income, it will influence the willingness to pay
because of the amount of expenditure they prioritize
first.
Table 6: Cross Tabulation between income and WTP
Willingness to
pay (Rp)
Income
(000/Rp)
Total
500-
1000
1010-
2000
>2000
0
80
21
0
10
3000-5000
6000-10000
11000-12500
72
10
04
19
4
0
1
0
3
92
14
4
Total
18
45
8
120
Source: Primary data, 2018
Table 6 shows the relationship between WTP and
income. With their small income, they have to adjust
their daily expenses and try to minimize finance for
the more important circumstances. There are even
respondents who choose not to shop and only eat if
they have no money. This situation made many
respondents choose to pay the WTP at a price of Rp.
3000 and Rp. 5,000 because they felt that the price
had not been too burdensome to the respondents.
Whereas, around 10 respondents were not willing to
pay on the grounds of little expenditure and income,
as well as other dependents they had to pay so they
chose not to spend money at all.
4.5 Cross Tabulations between
Numbers of Dependents and
Reservations Wage
The family members show how many people are
covered by the head of the family. If the respondent
has large family members does not rule out the
possibility that it will affect the amount of willingness
to pay.
Table 7: Cross Tabulations the numbers of dependents and
WTP
The Determinant of Willingness to Pay for Waste Management in Slum Area
443

Willingness
to pay (Rp)
The numbers of
dependents
(person)
Total
0-3
4-6
7-10
0
10
0
0
10
3000-5000
6000-10000
11000-12500
72
10
4
19
4
0
1
0
0
92
14
4
Total
96
23
1
120
Source: Primary Data 2018
Based on Table 7, people who choose the value of
the 3000-5000 WTP have dependents ranging from 0-
3 people. Respondents who chose the value of WTP
were small even though there were fewer than three
dependents because they saw their income and
expenses first. Many of these respondents have
children who are still in school who do not need a lot
of money so they prefer to choose the value of PAPs
under 10,000. Meanwhile, respondents who did not
want to pay for waste management due to the number
of dependents so they were afraid that they would not
be able to pay for the waste management so they
thought it would be better to free it.
4.6 Cross Tabulation between Slum
Area Characteristics and WTP
If the respondent resides in a slum with a heavier level
of slum, it should make the respondent aware of
paying to improve his environment
Table 8: Cross Tabulation between Slum Area
Characteristics and WTP
Willingness to
pay (Rp)
Slum Area
Characteristics
Total
Ringan
Sedang
Berat
0
0
0
10
10
3000-5000
6000-10000
11000-12500
8
0
0
21
5
1
63
9
3
92
14
4
Total
8
45
85
120
Source: Primary Data, 2018
Based on Table 8, people who live in low slums
to heavy slums choose more with 3000-5000 WTP
values. So this shows no difference regarding the
value of willingness to pay them for waste
management. This is based on the reason for their
uncertain income, so choosing a small WTP value of
Rp. 3,000 and Rp. 5,000. Even so, there are some
people who live both in medium slums and heavy
slums choose WTPs above IDR 5,000 with a WTP
value of IDR 12,500 with the reason that they are still
able to pay if the payment can reduce the existing
waste.
4.7 Willingness To Pay Analysis
The Contingent Valuation Method (CVM) approach
in this study was used to analyze the WTP values of
communities in Slum Areas in Seberang Ulu I and Ilir
II Districts for environmental conservation. In this
study, the bid value used to determine the
respondent's WTP value was obtained through the
dichotomous choice method by showing a certain
amount of money which was then asked whether the
respondent was willing to pay or not with this amount
of money in an effort to preserve the environment.
Table 9: WTP value based on Respondent Number in
Seberang Ulu I Subdistrict and Ilir Barat II
Willingness to pay (Rp/000)
Total
3
5
7.5
10
12.5
The number of
respondents
SU I
6
40
2
4
4
56
IB II
6
40
0
8
0
54
Total
110
Source: Primary data, 2018
WTP values that are willing to be paid by the
community in Seberang Ulu I and Ilir Barat II
Subdistricts can be seen in Table 2, which shows that
in the Seberang Ulu I and Ilir Barat II Sub-Districts,
the most option Rp. 5,000.
To find out how much willingness to pay
respondents can be seen in Table 10. The average
WTP of respondents is Rp. 5,645.45. The average
value of the respondent's WTP can be used as a
reference in pricing which can then be used as funds
to carry out waste management efforts in slums in
Seberang Ulu I and Ilir Barat II Subdistricts.
Table 10: Distribution WTP Value of Respondents in Slum
Areas in Seberang Ulu I and Ilir Barat II Subdistricts
Willingness
to pay (Rp)
Frequency
(The
Number of
respondent
s)
Relative
Frequency
(Pfi)
Average
Score
WTP
(Rp/Bln)
3000
12
0.109
327.27
5000
7500
10000
12500
80
2
12
4
0.727
0.018
0.109
0.036
3636.36
136.36
1090.91
454.55
110
8
5.645.45
Based on the respondents' WTP value on the
number of respondents who chose the WTP value,
obtained the WTP curve of each respondent. The
SEABC 2018 - 4th Sriwijaya Economics, Accounting, and Business Conference
444
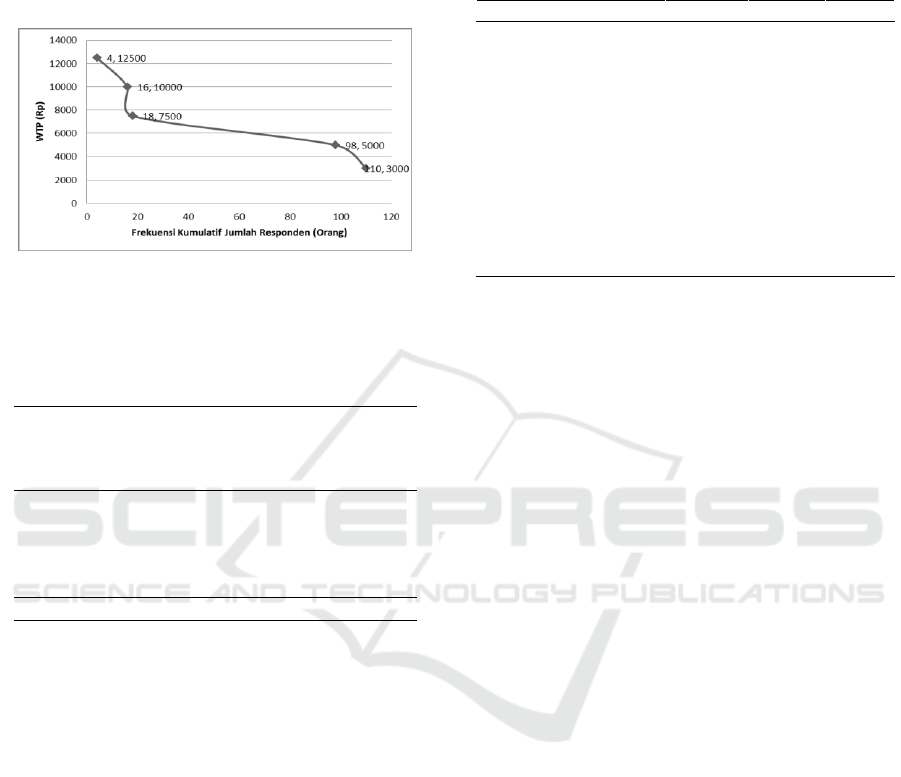
results of a survey conducted on the people living in
the Seberang Ulu I and Ilir West II slums for the WTP
values that were willing to be issued can be seen in
Figure 1. Respondents’ WTPs differed according to
the respondents' abilities.
Figure 1: Alleged Respondent's WTP Curve
Source: Primary Data, processed (2018)
Table 11: Total of WTP Respondent Slum Area
Community in Seberang Ulu I and Ilir Barat II
Willingne
ss to pay
(Rp)
Frequency
(The
Number of
respondents)
The
number of
Location
Total
(Rp)
3000
12
7
21.000
5000
7500
10000
12500
80
2
12
4
49
2
7
2
245.000
15.000
70.000
25.000
Total
110
8
376.000
Sumber: Primary Data, processed (2018)
The total WTP value (TWTP) of respondents was
calculated based on the distribution data of the
respondents' WTP. The results of TWTP calculation
can be seen in Table 11. Table 11 Total WTP of
Respondents in Slums in Seberang Ulu I and Ilir Barat
II District. Based on the results of the calculation, the
WTP value of community respondents in slums in
Seberang Ulu I and Ilir Barat II districts is Rp.
376,000.00.
4.8 Multiple Linear Regression
Analysis
The age level variable (US) has a sig value of 0.024,
which means that age is significant and has a
significant effect on the probability of the respondents
paying in the waste management efforts in the
Seberang Ulu I and Ilir West II slums at a significant
level of 5%. So, the older the respondent's age level,
the better awareness of the surrounding environment
and the tendency to be willing to pay.
Table 12: Multiple Regression Output
Variable
B
T
sig
Age (US)
42.596
2.287
0.024
Education (PT)
41.722
72.938
0.568
Member of
Dependents Family
(JT)
Income (PEN)
Job Dummy (DJPEK)
*DJPEK1
-164.912
0.001
-2569.501
-0.896
2.397
-2.513
0.372
0.018
0.013
Characteristics of Slums
Dummy (DKPK)
*DKPK2
860.517
0.977
0.331
*DPKP3
-558.687
-809.042
0.691
Source: Primary Data, 2018
The coefficient of age variables has a positive
influence, meaning that the more the age, the greater
the value of the WTP paid for improving waste
management in the Seberang Ulu I and Ilir West II
slums because age will make a person become more
mature in making judgments. If the age increases by
1 year, then the willingness to pay will increase by
42,596. The results of this study are in accordance
with that conducted by Prasetyo and Saptutyningsih
(2013) that age has a significant effect on the
willingness to pay individuals because of the
increasing age, the mindset in caring for the
importance of protecting and protecting the
surrounding environment and community
environment increases.
The level of education variable (PT) has a sig
value of 0.568 which indicates that this variable is not
significant to the probability of the respondent paying
waste management in the slums in Seberang Ulu I and
Ilir Barat II settlements. This means that not all highly
educated people are willing to pay. Although there are
some people with high education who have an
awareness of the importance of the environment so
that they pay a high amount too. This is consistent
with research conducted by Annisa, et.al (2015) that
the level of education is not a determinant of
community willingness because not all highly
educated people are willing to pay even a large
amount, because there are some societies with low
education willing to pay, because they have
awareness of the surrounding environment.
The family members (JT) does not have a
significant effect on the willingness to pay for waste
management in slums in Seberang Ulu I and Ilir Barat
II sub-districts because the probability value of JT is
0.372. This means that even though many or no
The Determinant of Willingness to Pay for Waste Management in Slum Area
445

family members are borne by the head of the family
still have the desire to pay because the family has an
environmental awareness because after all the dirty
environment affects their health. The results of this
study are in accordance with the research of Annisa,
et.al (2015), Afifah, et, al (2013), Amanda (2009) that
the family members do not affect the willingness to
pay the community.
The income variable (PEN) has a significance
value of 0.018 which indicates that income has a
significant effect on the willingness to pay for waste
management in slums in Seberang Ulu I and Ilir Barat
II settlements. The income variable coefficient is
positive, so income has a positive influence. If the
income increases by 1 rupiah, it will increase by
0.001. If the income of individuals living in slums in
Seberang Ulu I and Ilir Barat II sub-districts
increases, the willingness to pay the public will also
be higher with a high WTP value as well.
However, with income conditions that are still
practically low, it is not wrong if the WTP level of the
people living in slums in the Seberang Ulu I and Ilir
II sub-districts is small. This is in accordance with the
law of demand theory and one of the factors that
influence it is the income of the community which
states that the high and low income affects the number
of their requests. If the price incurred to improve the
environment is high and on the other hand the income
they receive is small, it will affect their expenses so
they will choose a lower price. The results of this
study are in accordance with Amanda (2009) which
shows that the higher one's income, the higher the
desire to improve the environment, and vice versa. If
the income received is low, then the value of their
willingness to pay will be low.
Work type variables are dummy variables with 1
= informal and 0 = formal. This variable has a sig
value of 0.013 which indicates that this type of work
has a significant influence on the willingness to pay
the community, which means that statistically there
are significant differences between types of formal
employment compared to informal types of work
Variables in the type of informal coefficient work
are smaller at 2565,496 so that informal work gives a
value of WTP contribution of 2565,496 less than
formal employment. The results also show that
formal work will make a large contribution to
payments for waste management compared to people
who have informal jobs.
The results of this study are consistent with the
research conducted by Widiastuti (2014) that formal
employment such as private or public employees have
a definite income every month so they tend to pay
high-value WTPs. As for informal, the income is
uncertain so it provides a lower WTP value.
Variable characteristics of slums (KPK) are
dummy values with 1 = low slums, 2 = moderate
slums and 3 = heavy slums. The DKPK2 and DKPK3
variables have a sig value of 0.331 and 0.491 which
indicates that the characteristics of slum areas do not
have a significant influence on the willingness to pay
the community, which means that there is no
statistically significant difference between the
characteristics of low, medium and heavy slums
towards the WTP value. This is consistent with the
results of the interview that the community, whether
from low, medium or high Slum Areas, chose almost
the same WTP value.
5 CONCLUSIONS
Factors that influence people's willingness to pay are
age and income variables which have a positive and
significant effect while the type of work has a
negative and significant effect on the willingness to
pay for waste management. The level of education
variable, family members, and the characteristics of
slums have no significant effect. As many as 110
respondents stated their willingness to pay in waste
management in Slum Areas in Seberang Ulu I and Ilir
Barat II sub-districts with an average willingness to
pay the community per month was Rp. 6 645.45 and
a total of Rp. 376,000.0.
REFERENCES
Afifah, Kurniasih Nur, et.al. 2013. Kesediaan Membayar
Jasa Lingkungan Air Untuk Konservasi di TWA
Kerandangan Kabupaten Lombok Barat. Jurnal
Ekosains Vol.V No.2
Annisa, et al. 2015. Analisis Willingness to Pay (WTP)
Sampah Rumah Tangga (Studi Kasus Perumna
Kelurahan Simpang Baru Panam Pekanbaru). Jurnal
Online Mahasiswa Fakultas Ekonomi Vol.2 No.1
Februari 2015
Amanda, Sylvia. 2009. Analisis Willingness to Pay
Pengunjung Obyek Wisata Danau Situgede dalam
Upaya Pelestarian Lingkungan (skripsi). Fakultas
Ekonomi dan Manajemen Institut Pertanian Bogor,
Tidak dipublikasikan.
Asriyanidewi. 2016. Analisis Nilai Ekonomi Objek Wisata
Pemandian Air Pnas Galunggung Kabupaten
Tasikmalaya dengan Pendekatan Travel Cost Method
(Skripsi). Fakultas Ekonomi Universitas Pasundan.
Tidak dipublikasikan.
Basriyanta. 2007. Memanen Sampah. Yogyakarta: Kanisius
SEABC 2018 - 4th Sriwijaya Economics, Accounting, and Business Conference
446

Danil, Mahyu. 2010. Pengaruh Pendapatan Terhadap
Tingkat Konsumsi pada Pegawai Negeri Sipil di Kantor
Bupati Kabupaten Bireuen. Jurnal Ekonomika
Universitas Almuslim Vol. 4 No. 7
Dinas PU Cipta Karya dan Perumahan Kota Palembang.
2009. Penyusunan atau Updating Data Base Kondisi
Perumahan dan Permukiman Kumuh di Kota
Palembang. Palembang: Dinas PU Cipta Karya dan
Perumahan Kota Palembang
Fauzi, Akhmad. 2004. Ekonomi Sumber Daya Alam dan
Lingkungan Teori dan Aplikasi. Jakarta: PT Gramedia
Pustaka
Handayani, Telly. 2015. Analisis Kesediaan Membayar
Iuran Kebershian Terhadap Kepuasan Masyarakat di
Lingkungan Kelurahan Labuhbaru Barat. JOM FEKON
Vol.2 No.1
Igunawati, Diana. 2010. Analisis Permintaan Objek Wisata
Tirta Waduk Ccaban Kabupaten Tegal. (Skripsi)
Fakultas Ekonomi Universitas Diponegoro, tidak
dipublikasikan.
Nachrowi, Djalal Nachrowi dan Hardius Usman. 2007.
Penggunaan Teknik Ekonometri. Jakarta: PT
Rajagrafindo Persada
Pinem, Mbina. 2010. Pengaruh Sosial Ekonomi Terhadap
Kualitas Permukiman di Kelurahan Sidorejo
Kecamatan Medan Tembung Kota Medan. Jurnal
Geografi Vol. 12 No.2
Prasetyo, Nugroho Joko and Endah Saptutyningsih. 2013.
Bagaimana Kesediaan Untuk Membayar Peningkatkan
Kualitas Lingkungan Desa Wisata. Jurnal Ekonomi dan
Studi Pembangunan Vol 14, No 2, 127-136
Subardin, M and M. Komri Yusuf. 2011. Valuasi Ekonomi
Menggunakan Metode Travel Cost pada Taman Wisata
Alam Punti Kayu Palembang. Jurnal Ekonomi
Pembangunan Vol , No 2 :81-89
Sukirno, Sadono. 2010. Mikroekonomi Teori Pengantar
Edisi Ketiga. Jakarta: PT Raja Grafindo Persada
Sontikasyah, Elyis. 2010. Analissi Kesediaan Membayar
Pengguna Jasa Bus Trans Pakuan Kota Bogor
(Willingness to Pay) Dengan Metode Valuasi
Kontingent. Tesis. Fakultas Ekonomi Universitas
Indonesia, Tidak dipublikasikan.
Soekartawi. 2012. Faktor-faktor Produksi. Jakarta:
Salemba Empat
Rahmawati, Cintami. 2014. Analisis Willingness to Pay
Wisata Air Sungai Pleret Kota Semarang (skripsi).
Fakultas Ekonomika dan Bisnis Universitas
Diponegoro Semarang, tidak dipublikasikan
Ruban, Angela et al. 2014. Willingness to Pay Masyarakat
Terhadap Pengolahan Sampah Ramah Lingkungan di
TPA Dusun Toisapu Kota Ambon. Jurnal Ekonomi
Pertanian, Sumberdaya dan Lingkungan 102-113
(2014)
Saptutyningsih, Endah. 2007. Faktor-faktor yang
Berpengaruh Terhadap Willingness to Pay untuk
perbaikan Kualitas Air Sungai Code di Kota
Yogyakarta. Jurnal Ekonomi dan Studi Pembangunan
Vol.8, No.2: 177-182
Samli, Asbi. 2012. Analisis Pengambangan Kota
Berdasarkan Kondisi Fisik Wilayah Kota Masohi
Ibukota Kabupaten Maluku Tengah. Jurnal Plano
Madani Vol.I Nomor 1
Sjafrizal. 2012. Ekonomi Wilayah dan Perkotaan. Jakarta:
Rajawali Pers
Subhadarsini, Simashree. 2015. Valuation of Environment:
A Study on Willingness to Pay for Improved Solid
Waste Management in Paradip Town, Odisha
Economic. International Journal of Humanities and
Social Science Invention Vol.4 Issue 1
Supranto, J. MA. 2008. Statistik Teori dan Aplikasi.
Jakarta: Erlangga
Suryani, Anih Sri Suryani. 2016. Persepsi Masyarakat dan
Analisis Willingness to Pay Kebijkan Kantong
Plastik Berbayar Studi di Jakarta dan Bandung.
Kajian Vol.21 No.4
Sontikasyah, Elyis. 2010. Analissi Kesediaan Membayar
Pengguna Jasa Bus Trans Pakuan Kota Bogor
(Willingness to Pay) Dengan Metode Valuasi
Kontingent. Tesis. Fakultas Ekonomi Universitas
Indonesia, Tidak dipublikasikan.
Vitor, Dadson Awunyo. 2013. Urban Households’s
Willingness to Pay for Improvement Disposal Services
in Kumasi Metropolis, Ghana. Hindawi Publishing
Corporation urban Studies Research Vol 2013, 8
pages.
Widiastuti, Maria Maghdalena Diana. 2014. Analisis
Kesediaan Membayar (WTP) dalam Pengelolaan
Sampah dan Pelestarian Waduk Cirata- Jawa
Barat.Jurnal Ilmiah Agribisnis dan Perikanan Vol.6
Edisi 3
Winarti, Puji and Azizah. 2016. Penyuluhan Pengelolaan
Sampah Plastik dengan Konsep Zero Waste bagi Ibu
Rumah Tangga di Kecamatan Bergas Kabupaten
Semarang. Jurnal Pengabdian Masyarakat Vol.7 No.1
The Determinant of Willingness to Pay for Waste Management in Slum Area
447
