
The Pattern Identification of Rice Pricing Determination in the Local
Farmer Level
Taufiq Marwa, Abdul Bashir, KMH. Thamrin
and Azwardi
Universitas Sriwijaya, South Sumatera, Indonesia
Keywords: Production Cost; Rice Prices; Rice Production; Rural Farmer.
Abstract: This study to pattern identification of rice pricing determination in the local farmer level of South Sumatera.
The data used are primary data as many as 400 respondents of farm households in South Sumatra. The method
used in this study is the qualitative descriptive analysis and the quantitative approach using the linear
regression model with the estimation of ordinary least square (OLS). The findings of this study indicated that
the pattern of rice price setting in the sub-district level of the relative is controlled by large traders, most of
whom have cooperated with milling owners in the rural level. The price formed at the sub-district level is the
sum of the purchase prices at the rural level plus the profit margins agreed upon by the wholesalers at the sub-
district level with the milling owners in the rural level. We found of this study that the defined profit margins
ranged from 16-36%. The model estimation result indicated that jointly the independent i.e. rice production,
input cost, labor cost, and dummy variable significantly affect the rice price at the rural level. Meanwhile,
partially the variables that significantly affect the rice price at the rural level are labor costs and districts
dummy variable (D1 and D2), while the rice production and input costs insignificant affect the rice price in
the local farm level (rural market).
1 INTRODUCTION
The implementation of food policy so far has only
focused on one side, namely on increasing rice
production to maintain rice self-sufficiency, while on
the other hand, food policy wants cheap rice prices.
These two policies are a source of problems that will
affect producers and consumers, from the producer
side will cause farmers to lack enthusiasm to produce,
while from the consumer side, rice is a staple food,
which will cause the population to depend on rice
(Marwa, 2001).
Meanwhile, in the central regions of rice
production will be fulfilled and the price level is low,
but in other places the availability of rice is
inadequate and the price level will be high. Therefore,
the distribution aspect that is closely related to the
availability of adequate transportation infrastructure
to ensure the mobilization of goods and people must
absolutely get the attention of all parties, especially
the government.
The consumption aspect, people will be able to
access rice, if they have purchasing power. The level
of people's purchasing power depends largely on the
income level and the rice price that applies in the local
market. The higher the level of rice prices prevailing,
the lower the community's ability to obtain sufficient
and quality rice. Price fluctuations in agricultural
products, especially rice must receive special
attention from the government, this is indicated by
policy interventions to maintain price stability.
Despite the special attention, the issue of price
fluctuations between time and place continues to
occur. Every harvest season, the price of rice at the
farmer level drops, even below the base price.
The price of rice in most rice-producing regions
in South Sumatra at the farm level often experiences
very large fluctuations. In Figure 1, shows the trend
of rice prices at the village level, retail prices, and
large base prices which continue to increase, but
when viewed from these data the basic of rice price
(the rice price of farmers level) has a large gap
compared to the rice price at rural level and retail
prices. Even though the price level has been regulated
by the government with the lowest price policy, the
price of rice at the farm level often experiences a
decline far below the lowest price of the government
regulation.
In addition, one of the causes of the asymmetric
transmission of prices between vertically connected
markets is the presence of uncompetitive behavior
510
Marwa, T., Bashir, A., Thamrin, K. and Azwardi, .
The Pattern Identification of Rice Pricing Determination in the Local Farmer Level.
DOI: 10.5220/0008441905100515
In Proceedings of the 4th Sriwijaya Economics, Accounting, and Business Conference (SEABC 2018), pages 510-515
ISBN: 978-989-758-387-2
Copyright
c
2019 by SCITEPRESS – Science and Technology Publications, Lda. All rights reserved
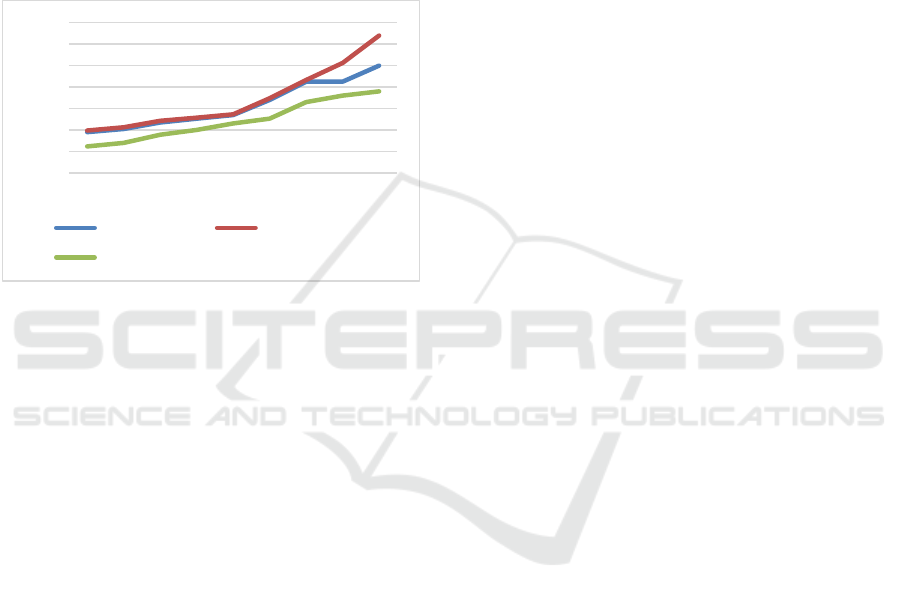
0
2000
4000
6000
8000
10000
12000
14000
2001 2003 2005 2007 2009 2011 2013 2015 2017
Rural Level Price Retail Price
Basic Price
between intermediary traders, especially if the
intermediary trader is in a concentrated market
(Vavra & Goodwin, 2005). Generally, the
intermediary trader will try to maintain the level of
profit and will not increase or decrease the price
according to the actual price signal. So that
intermediary traders will more quickly react to price
increases compared to price reductions, this condition
causes competition restraint on distribution channels
and imperfect price transmission between producer
and consumer levels. In the end, the farmers and
consumers markets are not integrated.
Figure 1: The trend of rice price in the level
(Source: BPS, South Sumatera in figure)
Meanwhile, the occurrence of price transmission
between two different market levels in one marketing
chain is caused by an uncompetitive market(Meyer &
Cramon-Taubadel, 2004and Palaskas & Harriss-
white, 1993). Even for agricultural commodities, it is
clearly stated that imperfect competition in the
marketing chain opens the space for the middleman
to abuse their market power. Therefore, there is a
possibility that there are two roles in the market; first,
the market facilitates trade and allows distribution
and allocation of resources in the community; second,
the market allows all traded goods and services to
evaluate in determine rice price (Azwardi, Bashir,
Adam, & Marwa, 2016; Chizari, Sani, & Kalashami,
2013).
Some previous studies have analyzed the factors
that influence rice prices with macroeconomic
assumptions such as study conducted by Azwardi,
Bashir, Adam, & Marwa (2016); Chizari, Sani, &
Kalashami (2013). Therefore, this study aims to
identify the rice prices determinants in the local
farmer level, and the factors that determine the rice
price such as rice production, input cost, labor cost,
and use dummy variable for the region of rice
production center in South Sumatra.. In the second
session, we will present a literature review. The third
session, we will present the analysis method used.
Next, in the fourth session, we present the findings
and discussion, and our last session presents
conclusions from the results of this study.
2 LITERATURE REVIEW
Food prices in each market are related to each other,
therefore, communication between producers and
consumers in each market will be intertwined through
price signals. So price is a form of communication
signals that serve many variations to coordinate
market decisions. The strength of market demand and
supply will shapes market prices. If the inter-market
has a link between the power of demand and supply,
so the inter-market price will integration (Cheung,
2008; Emokaro & Ayantoyinbo, 2014; Marwa, 2001)
Several studies show that the price of rice in the
region depends on market prices in other regions, as
the study the study conducted by Azwardi et al.
(2016) looking at the macro aspect, the impact of
government policies through subsidies on rice
production in Indonesia, the findings of this study
indicate that the subsidy policy determines the level
of rice consumption in Indonesia. Government policy
through subsidies is strongly influenced by the level
of rice prices. This condition shows that the
government is trying to maintain price stability
through subsidies and also efforts to build food
security in terms of demand and supply.
In addition, study conducted by Adam et al.
(2017) see more clearly how the marketing
distribution pattern of rice in South Sumatra, the
findings result of the distribution pattern of rice
commodity marketing in South Sumatra shows that
the marketing distribution channel of rice is still
going through a long stage, therefore is a need for the
role of government through BULOG as an absorbent
of farmers' production so that shortening the rice
distribution chain can also stabilize prices at the farm
level.
Nominally, the trading margin of rice traders' is
higher than the trading margin of farmers. However,
the rice trade margin ratio of farmers is higher than
trade margin ratio of traders. The result of this
findings indicates that farmers in South Sumatera
have the efficient categorized.
Furthermore, a study conducted by Timmer
(2004) the results of the study found that in the long
run, Indonesia has made improvements to food
security, these improvements have been driven by
successful economic growth and green revolution,
planted with superior types of rice, massive
infrastructure investment in the countryside,
including irrigation, and the availability of sufficient
The Pattern Identification of Rice Pricing Determination in the Local Farmer Level
511

fertilizer. In 1998, Indonesia experienced a financial
crisis which resulted in the destruction of domestic
rice prices which were far higher than the world price
of rice. Thus some productivity gains have favored
rice farmers. However, this will cause the loss of
consumers and also have a large impact on the
number of individuals living below the poverty line.
A study conducted by Marwa et al. (2017) the
findings result of the study indicated integration
between the price of rice at the producer level and the
price of rice at the consumer level. In addition, the
three sample regions have IMC value less than 1,
meaning that both markets have vertical integration in
the short run.
Another finding of this study is that the high price
difference at the local market level is due to the long
distribution of rice commodities in South Sumatera.
According to Marwa et al. (2017) efforts in form of
government intervention is particularly needed at the
local market-level on pricing policy by shortening the
distribution channels.
3 RESEARCH METHOD
The scope of this study is rice-producing regions in
South Sumatra such as East OKU, OKI, and
Banyuasin district. The sample in this study is farmer
households as many as 400 respondents. The
analytical method used is descriptive statistical
analysis, and the quantitative approach uses which is
the linear regression model to determine the factors
that effect on the rice price in the local farmer's level.
The variables used among another rice price (Pr),
total production (Qr), input costs (CI), and labor costs
(CL), and the category of central areas of production.
The results will be confirmed by the conditions that
occur in the field in this survey. The multiple linear
regression model with OLS estimation method is
presented in the equation as follows:
……………………….…….. (1)
Then, the equation (1) is presented in semi-natural
logarithm form in equation (2) as follows:
…………….……. (2)
where: Pr is the price of rice (dependent variable), and
the independent variable among other as Qr is rice
production; CI is the input cost (not including labor);
CL is labor costs; D1 is dummy variable with
category from East OKU district value = 1 and
another district with value = 0; and D2 is dummy
variable with category OKI district value = 1, while
another district is value = 0.
4 RESULT AND DISCUSSION
The type of agriculture in South Sumatra, especially
the small part of rice food crops, is technical
irrigation, especially in the East OKU area, while in
other areas it still applies rainfed systems such as
district OKI and Banyuasin. The district OKI has now
received attention by the regional government with
making irrigation, but still in certain areas as an
experiment. Based on information from the local
farmers that the district government of Banyuasin will
be making programmed to build irrigation for wetland
paddy.
Table 1: Description of agriculture system
District
Agriculture system
Total
Percentage
Irrigation
Rainfed
East OKU
131
15
146
36.50
OKI
77
117
194
48.50
Banyuasin
0
60
60
15.00
Total
208
192
400
100.00
Source: Authors calculation, 2017
Based on Table 1, the agricultural system in the
area that we observed, that East OKU district became
an area where most of the wetland paddy was the flow
of water sourced from rivers that entered the
irrigation that had been made so that during the rainy
season the water supply would be more.
Meanwhile, the OKI and Banyuasin districts still
apply the rainfed system as the water source which
flows to wetland paddy, meaning that the harvest
season for this region depends on the stored rainwater
supply. On the other side, the land area owned by
farm households in East OKU, OKI, and Banyuasin
regencies is quite diverse. Based on the survey
results, we found that most farm households had an
average of less than one hectare of wetland paddy.
This makes the farmers only benefit the harvest
for their daily needs. Meanwhile, we also get
information that most farm households still land rent
with the profit-sharing system with landowners.
SEABC 2018 - 4th Sriwijaya Economics, Accounting, and Business Conference
512

Table 2: Production, land area, and productivity
District
Total
Land
productivity
ton/ha
Production
(tons)
Land area
(ha)
East OKU
1.602
351
4,56
OKI
1.317
203
6,48
Banyuasin
640
122
5,27
Average
1.186
225
5,43
Source: Authors calculation, 2017
Meanwhile, based on the survey, we found that
most of the paddy harvested by farmers still ranged
from 0.6-19 tons per year, this indicated that most
farmers in South Sumatera still have the wetland
paddy small. From the survey results, we also get
information about 90.89% of farmers to produce less
than 20 tons per year with a range of land of only 0.5-
6 hectares, and with average harvest only two times
per year.
In terms of wetland productivity, the average
wetland productivity is 5.43 tons per hectare, the
results show that paddy production is still ideal. The
largest producer of wetland paddy is OKI District
with the value of 6.4 tons per hectare. Meanwhile,
Banyuasin district only reached 5.27 tons per hectare,
and the lowest was East OKU District which only
reached 4.56 tons per hectare. Based on the
information, yields in East OKU district experienced
a decline in yields, even this year the crop yields
failed due chemicals contained in excess soil and
more found of rat pest
Based on the survey results, we found that not all
paddy yields from farm households are all sold, some
are stored for consumption and some are used as
seeds for production in the next year. The proportion
of paddy harvested which sold from these three
districts averages around 80% of the total production.
We also found that each region had a different
proportion of the amount of rice sold. East OKU
district has the largest proportion of paddy harvested
which sold reaching 88% of total production. While
the OKI and Banyuasin district, the proportion of
paddy harvest that was sold only reached 77% and
73% of the total production.
Table 3 indicated that the production costs per
hectare in a year are quite diverse, but the highest
production costs are in the OKI district reaching 8.2
million per year per hectare. Meanwhile, East OKU
district only reached 4.2 million, while the lowest
production cost in Banyuasin district only reached 3.5
million per year per hectare. Thus, farmers still have
an advantage because the difference between total
revenue and total production costs shows a positive
value, this has provided evidence that most farmers in
these three regions are still benefiting from their sales.
Table 3: Components of production costs per ha
District
Total of production cost/year (Rp
000)
Production
cost
Landarea
(ha)
Cost per
(ha)
East OKU
1,486,029
351
4,231
OKI
1,679,927
203
8,265
Banyuasin
425,055
122
3,498
Average
1,197,003
225
5,331
Source: Authors calculation, 2017
Generally, we found that the average production
cost reached 41.3% of the total sales revenue of
farmers. While the average profit reaches 58.7% of
farmers' income because there is a portion of the
harvest that is still stored for consumption needs.
Table 4: Components of cost and Profit
District
Components of cost
(Rp. million)
Profit
per ha
TR
TC
Profit
East OKU
5,293
1,486
3,807
10,706
OKI
3,856
1,680
2,176
10,838
Banyuasin
1,869
425
1,444
11,883
Average
3,673
1,197
2,476
11,142
Source: Authors calculation, 2017
When viewed based on the benefits of farmers per
hectare per year presented in Table 4 shows that the
average profit of farmers per hectare per year reaches
11.1 million. The calculation results, the Banyuasin
district has the biggest profit reaching 11.8 million
per hectare per year.
Furthermore, OKUT district reached 10.8 million
per hectare per year, while OKI district amounted to
10.7 million per hectare per year. This result indicated
that farmers are still classified as efficient, but these
costs do not include other costs of this survey. The
pattern of determining rice prices at the farmer level
and sub-district level can be seen in the conditions of
paddy and rice price levels at the farmer level (rural
market) and at the sub-district level shown in Table 5
which are presented as follows
Table 5 indicates that the price of rice at the rural
level is relatively lower than the price of rice at the
sub-district level. The average price of rice at the rural
level is Rp.7,295 per kg, while the price of rice at the
sub-district level is Rp.9,242 per kg, we found that the
The Pattern Identification of Rice Pricing Determination in the Local Farmer Level
513

price level at the sub-district level was on average
27% higher than the price at the rural level.
Table 5: Price of dry paddy and rice at the rural and sub-
district Levels
District
Price of rural
level (Rp/Kg)
Price of sub-
district level
(Rp/Kg)
Dry
paddy
Rice
price
Rice price
East OKU
3,737
6,924
9,450
OKI
4,082
7,563
8,775
Banyuasin
3,993
7,399
9,500
Average
3,937
7,295
9,242
Source: Authors calculation, 2017
This condition indicates that traders take
relatively large profits in the process of distributing
rice from the producer level to the consumer level of
more than 20%. We also found that most farmers sell
paddy to the mill owners, so at the rural level farmers
sell in the form of paddy, not in the form of rice.
Farmers leave only a small portion of their crops for
seeds and supplies for consumption.
The pattern of pricing at the rural level is
relatively biased to buyers (milling owners), buyers
have greater power in determining prices than
farmers. Price agreements between buyers and sellers
at the rural level are dominated by buyers (milling
owners). The more dominant milling owners in
determining price levels are caused by (1) the high
dependence of farmers on milling plants to process
paddy into rice; (2) most farmers already have debts
to the mill owners; and (3) there is behaviour
monopsony nor oligopsony, which agreed among
buyers in the rural level.
The pattern of price setting of rice at the sub-
district level is relatively controlled by large traders,
most of whom have cooperated with milling owners
at the village level. The rice price formed at the sub-
district level is the sum of the purchase prices at the
rural level plus the profit margins agreed upon by the
wholesalers at the sub-district level and the milling
owners at the rural level. Based on the results of the
study it was found that the profit margins that were
set ranged from 16-36%.
The estimation results of the model to examine the
effect of rice production, input costs, labor costs, and
district dummy on rice prices at the local farmer level
are presented in Table 6. From Table 6 it can be seen
that jointly the variables of rice production, input
costs, labor costs, and the district dummy
significantly affects the price of rice in rural areas.
Table 6, indicated that partially, which
significantly affects the rice price (lnPr) at the rural
level is the labor cost (lnCL) and dummy variable of
the district (D1 and D2). Meanwhile, the rice
production and input costs insignificant affect the rice
price at rural level.
Table 6: The model estimation result
Variable
Coefficients
Tolerance
VIF
Constant)
8.039***
(0.086)
-
-
lnQr
0.007
(0.004)
0.306
3.263
lnCI
-0.007
(0.006)
0.301
3.325
lnCL
0.019***
(0.005)
0.523
1.911
D1
-0.076***
(0.007)
0.347
2.883
D2
0.020***
(0.006)
0.389
2.573
Obs
400
R
2
0.541
R-adjusted
0.535
F-test
94.244
DW-test
1.821
Source: Authors calculation, 2017
The variable of labor costs significantly affect the
rice price in the rural level and has the positive sign,
meaning that the higher the costs incurred to pay
labor, then the higher the rice price. This condition is
understandable because most of the activities in the
process of producing paddy or rice are depend on
labor, from preparing the planting to harvesting and
post-harvest. This component of labor costs includes
cleaning costs, planting costs, maintenance costs, and
harvest costs. Meanwhile, district dummy variables
can indicate whether there is a difference in the
average price level of rice in each district that is
sampled. Based on the results of the study, we found
that there were differences in average rice prices
between OKU Timur, OKI and Banyuasin district,
which one average on the rice price in East OKU
district is lower than average on the rice price in
Banyuasin district and OKI.
The variable of rice production (lnQr) and input
costs (lnCI) insignificant affect the rice price at the
farmer level (rural market). The insignificance of the
variable of rice production affect the rice price in the
rural level is caused by the price level that is formed
at the rural level is not determined by the market
mechanism but tends to be determined by the buyer,
SEABC 2018 - 4th Sriwijaya Economics, Accounting, and Business Conference
514

in this case the milling owner, where the price set
tends to be below the government decree price.
Although the prices in the rural market are below the
government decree, farmers are forced to sell their
crops to the milling owners in the rural level, this
condition gives a strong indication that the structure
of the rice market in rural level tends to be
monopsony and or oligopsony which agreed.
Meanwhile, the insignificance of the input cost
variable (InCI) in influencing the rice price in the
rural level is caused by the relatively fixed and
unvaried input costs in the rice farming process. As
the result of the relatively fixed and varying input
costs, the rice price elasticity on input costs is very in-
elastic, this is indicated by the coefficient of rice price
elasticity to the input cost is -0.007 (Table 6).
5 CONCLUSIONS
The pattern of price fixing at the rural level is
relatively biased to buyers (milling owners), buyers
have greater power in determining prices than
farmers. Price agreements between buyers and sellers
at the rural level are dominated by buyers (milling
owners). The more dominant milling owners in
determining the price level are due to: (1) the high
dependence of farmers on milling plants to process
paddy into rice, (2) most farmers already have debts
to the mill owners, (3) there is behaviour monopsony
and or oligopsony behaviour which agreed among
buyers at the rural level.
Meanwhile, the pattern of rice price setting in the
sub-district level of the relative is controlled by large
traders, most of whom have cooperated with milling
owners in the rural level. The price formed at the sub-
district level is the sum of the purchase prices at the
rural level plus the profit margins agreed upon by the
wholesalers at the sub-district level with the milling
owners in the rural level. We found of this study that
the defined profit margins ranged from 16-36%.
The conclusion from the model estimation result
indicated that jointly the independent i.e. rice
production, input cost, labor cost, and dummy
variable significantly affect the rice price at the rural
level. Meanwhile, partially the variables that
significantly affect the rice price at the rural level are
labor costs and districts dummy variable (D1 and D2),
while the rice production and input costs insignificant
affect the rice price in the local farm level (rural
market).
REFERENCES
Adam, M., Marwa, T., Azwardi, -, Thamrin, K. M. H., &
Bashir, A. (2017). Analysis of Rice Distribution in
South Sumatera, Indonesia. International Journal of
Economics and Financial Issues, 7(3), 166–171.
Azwardi, Bashir, A., Adam, M., & Marwa, T. (2016). The
effect of subsidy policy on food security of rice in
Indonesia. International Journal of Applied Business
and Economic Research, 14(13), 9009–9022.
Cheung, S. (2008). The Price of Rice: Market Integration
in Eighteenth-Century China. (S. Pearce, Ed.) (1st ed.,
Vol. 29). Washington D.C.: Center for East Asian
Studies, Western Washington University.
Chizari, A. H., Sani, M. F., & Kalashami, M. K. (2013).
Investigating Market Integration and Price
Transmission of Different Rice Qualities in Iran.
International Journal of Agricultural Management and
Development, 3(4), 219–225.
Emokaro, C. O., & Ayantoyinbo, A. A. (2014). Analysis of
Market Integration and Price Variation in Rice
Marketing in Osun State, Nigeria. American Journal of
Experimental Agriculture, 4(5), 601–618.
Marwa, T. (2001). Respon Pelaku Pasar Komoditi Beras
Terhadap Perubahan Variabel Harga dan Bukan
Harga di Provinsi Sumatera Selatan. Universitas
Padjadjaran.
Marwa, T., Bashir, A., Adam, M., Azwardi, & Thamrin, K.
M. . (2017). Market Integration of Agricultural
Products. International Journal of Economics and
Business Administration, 5(2), 69–82.
Meyer, J., & Cramon-Taubadel, S. (2004). Asymmetric
Price Transmission: A Survey. Journal of Agricultural
Economics, 55(3), 581–611.
Palaskas, T. B., & Harris-white, B. (1993). Testing Market
Integration - New Approaches With Case Material
From the West-Bengal Food Economy. Journal of
Development Studies, 30(1), 1–57.
Timmer, C. P. (2004). Food Security in Indonesia : Current
Challenges and the Lon-Run Outlook (No. 48).
Working Paper. Washington, D.C.
Vavra, P., & Goodwin, B. K. (2005). Analysis of Price
Transmission Along the Food Chain. OECD Food,
Agriculture and Fisheries Working Papers, (3), 1–58.
The Pattern Identification of Rice Pricing Determination in the Local Farmer Level
515
