
Batik Classification using Texture Analysis and Multiclass Support
Vector Machine
Wahyu Tri Puspitasari, Dian C. R. Novitasari and Wika Dianita Utami
Departement of Mathematics UIN Sunan Ample Surabaya, Ahmad Yani Street, Surabaya, Indonesia
Keywords: Batik Image, Analysis Texture, Feature Extraction, GLCM, DWT Multiclass SVM.
Abstract: Batik is one of the cultural heritage has become an Indonesian identity and recognized by the Organization of
Education, Science and Cultural Organization (UNESCO). Every region in Indonesia has very diverse batik
motifs. There are 38 batik motifs based on the area of origin. It will be difficult to recognize each of these
patterns while batik began to be liked by many local and foreign tourists. Therefore, a system is needed that
can recognize every pattern of batik to facilitate people in recognizing batik motifs. Support Vector Machine
(SVM) has excellent performance in classification and can also be used to recognize patterns of batik motif.
We use the Gray Level Co-occurrence Matrix (GLCM) for feature extraction and SVM for batik classification.
The result show that batik motif can be classified using SVM with 96% accuracy for two types of batik motifs,
88.89% for three types of batik motifs and 77.14% for four types of batik motifs.
1 INTRODUCTION
Batik is Indonesia’s cultural heritage that has been
worldwide. Batik is a fabric with patterns, motifs, or
certain themed images according to the philosophy
that exist in the regions of Indonesia (Wulandari,
2012). Batik motif in Indonesia is very diverse
because the Indonesian nation has a diversity of
ethnic and cultures. Motif consists of elements
proportion and composition. Indonesia has more than
181 batik motifs (Achjadi, 1999). The types of batik
can be classified by method of manufacture, area of
origin and motif.
(a) (b) (c)
Figure 1: (a) Lereng Madura batik image, (b) Ceplok
Indramayu batik image, (c) Sidomukti Yogyakarta batik
Image.
Some examples of batik motifs in Figure 1 are
batik motifs based on area of origin. Batik motifs in
Indonesia are difficult to differentiate because the
amount are very diverse. To recognize batik motifs, a
classification process is needed. Classification is used
to recognize the characteristics of the objects
contained in the database and classed into different
class (Moertini & Sitohang, 2005). The process of
batik classification is the division of the image of
batik into the classes in accordance with the pattern
of the motive, it makes more easily recognizable
based on the pattern.
Texture classification can be done using texture
analysis results. Texture analysis in the image is an
observation about a characteristic in the image. To get
the characteristics of the image be done by extracting
the image feature that serves to take the features of
each image. The feature extraction methods include
Cardinal Spline Curve Representation (Fanani,
Yuniarti, & Suciati, 2014), FPGA (Babasaheb et al.,
2012), Gray Level Co-occurrence Matrix (GLCM)
(Öztürk & Akdemir, 2018), Wavelet (Putra, Suciati,
& Wijaya, 2011).
GLCM is a feature extraction method used to
obtain features in the image by calculating the
Angular Second Moment (ASM), contrast, Inverse
Difference Moment (IDM), energy, correlation of co-
occurrence matrix(Mohanaiah, Sathyanarayana, &
GuruKumar, 2013). Based on previous research used
the GLCM method as feature extraction of brain
tumor images for brain tumor classification (Zulpe &
Pawar, 2012) and feature extraction of glaucoma
images for the diagnosis of glaucoma (Karthikeyan
Puspitasari, W., Novitasari, D. and Utami, W.
Batik Classification using Texture Analysis and Multiclass Support Vector Machine.
DOI: 10.5220/0008517300650071
In Proceedings of the International Conference on Mathematics and Islam (ICMIs 2018), pages 65-71
ISBN: 978-989-758-407-7
Copyright
c
2020 by SCITEPRESS – Science and Technology Publications, Lda. All rights reserved
65

&Rengarajan, 2013). Feature extraction using the
GLCM method has faster calculation and then GLCM
used to recognize the pattern (Mohanaiah,
Sathyanarayana, & Gurukumar, 2013).
Beside GLCM method, there is a Wavelet
Transform method to use features extraction. Chen et
al. (2002) have successfully classified breast tumors
using feature extraction of Wavelet Transformation
and ANN classification. In addition, Rangkuti (2014)
has done research on batik classification using
Discrete Wavelet Transform with duabechies 2 type,
where a type of duabechies 2 is better than other
types. Angelos Tzotos shows that the Support Vector
Machine (SVM) is excellent for object-based image
analysis (Tzotsos & Argialas, 2008). SVM can only
perform binary classification. However, currently,
there is a multiclass SVM approach to solve many
class classification problems. Multiclass SVM with
ECOC approach has been implemented to diagnose
the erythromotropic-squamous disease with high
accuracy results (Prasetyo, 2014). Based on previous
research, batik classification will be performed using
feature extraction with GLCM and feature extraction
results with DWT where classification using
multiclass SVM.
2 LITERATURE REVIEW
2.1 Batik
The batik is a fabric patterned / special motif made by
applying a Malam on the fabric and processed by a
particular process (Musman & Arini, 2011). The
types of batik can be classified based on the method
of manufacture, origin area, and motif (Wulandari,
2012). Batik motif is formed from point, line, and the
plane then becomes an abstract pattern, natural
(natural), geometric and another pattern. Each pattern
of batik has its own philosophical meaning. This
makes batik as a craft that has high artistic value.
Sometimes, some motifs are designed for important
events such as engagements, weddings party,
uniforms, etc.
2.2 Gray Level Co-occurrence Matrix
(GLCM)
Gray Level Co-occurrence Matrix (GLCM) is a
feature extraction method that uses second-order grey
level histogram (Embaugh, 2017). Capture features
based on two parameters, that is distance and angle.
Distance is the pixel difference used for second-order
statistics, an angle formed between pixel pairs. In the
GLCM method, angle orientation is expressed in
degrees. The angular orientation is divided into 4
different angle directions with the 45 ° interval, which
is 0°, 45°, 90°, 135° (Shi & Jeon, 2006). Co-
occurrence direction can be seen in Figure 2. Let
represent images of size and that have
pixels with L levels and r is the direction vector of
spatial offset.
defined by the number of
pixels occurring at offset r to pixel which can
be expressed as follows
(1)
where the offset r can be an angle or distance,
and . A co-occurrence matrix is
used to get the feature from the image. Harlick's
suggested features include both angle (ASM)
moments, contrast, inverse difference moment
(IDM), energy, correlation(Mohanaiah,
Sathyanarayana, & GuruKumar, 2013).
Figure 2: Co-occurrence Matrix direction for extracting
texture features.
2.2.1 Angular Second Moment (ASM)
ASM is also known as uniformity ASM is related to
energy, where energy is the sum of squares of second
moment GLCM(Suresh, 2012). The highest value is
achieved when the image has excellent homogeneity
when the GLCM elements are all the same
(Mohanaiah, Sathyanarayana, & Gurukumar, 2013).
ASM is calculated using the following formula (2).
Range energy value between [0,1].
(2)
where is matriks co-occurrence,
and .
2.2.2 Contrast
Contrast is a measure of the presence of variations in
the pixel grey level of the image. Contrast is
calculated using the following formula (3).
ICMIs 2018 - International Conference on Mathematics and Islam
66

.
(3)
2.2.3 Inverse Difference Moment (IDM)
IDM is a local homogeneity. IDM has a high value
when the same local gray level and the inverse of the
high GLCM. IDM is obtained from the following
formula (4).
(4)
2.2.4 Entropy
Entropy is a measure of the randomness of the grey in
the image. Entropy reaches the highest value when
GLCM elements have relatively equal amounts and
have a low cost when the GLCM elements are close
to 0 or 1. Entropy is calculated using the following
formula (5) (Thamaraichelvi & Yamuna, 2016).
(5)
2.2.5 Correlation
Correlation is used to calculate the gray linear
dependence of the neighboring pixel. To obtain
correlation values can use the following formula (6).
(6)
where :
(7)
(8)
,
(9)
(10)
2.3 Discrete Wavelet Transform
Wavelet Transform method is very influential in the
field of signal analysis, especially in analysis and
image compression. Wavelet is a dangerous method
of image and video compression because of
hasprofessive character in reconstruction. The
wavelet transform is divided into two versions, there
are Continuous Wavelet Transform (CWT) and
Discrete Wavelet Transform (DWT). From the
perspective of computing, the DWT method better
than the CWT method (Embaugh, 2017). DWT
method works multiraisonally and provides
information about the frequency and timing of the
signal. In DWT-2D image processing used wavelet
filter horizontally then vertically to produce four sub-
bands that contain wavelet coefficient value. The type
of wavelet filter is the Low Pass Filter (LPF) and
High Pass Filter (HPF) that evolved from the mother
wavelet. Wavelets develop into several types, there
are haar / db1, duabechies (db2,3,4 .., n), coiflets,
symlets, discrete major, and bioerthogonal)
(Jayaraman, Esakkirajan, & Veerakuma, 2011).
Here's the filtering scheme shown by Figure 3.
Figure 3: Decomposition level 2.
The LL, LH, HL, HH are the result of
decomposition level 1. Lowpasslowpass (LL)
contains the original image approximation
coefficient, lowpasshighpass (LH) contains the
horizontal subband edge coefficient, highpass-
lowpass (HL) contains the vertical subband edge
image coefficient, andhighpasshighpass(HH)
contains the vertical edge coefficient information.
When decomposition of two levels is done, then the
subband that can be decomposed only sub only,
because LL contains information about the image.
From the wavelet decomposition can be
calculated several statistical characteristics by using
the following formula
Batik Classification using Texture Analysis and Multiclass Support Vector Machine
67

,
(11)
(12)
(13)
.
(14)
2.4 Support Vector Machine
SVM is a binary classification method by dividing
two different classes using the best hyperplane (He,
Wang, Jin, Zheng, & Xue, 2012). But in the real
world problems are often classified into more than
two classes. To resolve these problems can use SVM
multiclass approach. There are two types of data sets
that can be classified using SVM, there are linear data
and non-linear data.
In linear SVM, two different classes are separated
by the best divisor function (hyperplane). Hyperplane
best obtained from the most optimal margin. While
the non-linear data used kernel trick that can map the
training data into a feature vector that has a higher
dimension. There are several kernels that can be used
such as linear kernels, polynomial kernels, and
Gaussian kernels (Shigeo, 2010). Below are some
kernel formulas:
a. Linear Kernel
��,�′=���′,
b. Polynomial Kernel
,
c. Gaussian Kernel
where
is a pair of two data from all parts of the
training data, parameter dan is a constant.
2.4.1 Binary Classification
Two-class classification is done by dividing the data
into two different classes using hyperplane best.
Hyperplane best obtained from the most optimal
margin. The margin is the distance between the
hyperplane with the closest data to the hyperplane of
each class. The data is called a support vector.
2.4.2 Multiclass Classification
Multiclass SVM is used to solve classification
problems of more than two classes. There are three
multiclass approaches, which is one-against-one,
one-against-one and ECOC approaches (Prasetyo,
2014). The one-against-all approach, making binary
classifiers as much as K is then trained to separate the
class vector from the others, for each
. Then
each data object is classified into the class where the
greatest decision value is determined (Chih-Wei Hsu,
2002). The second approach, which is one-against-
one with classification binary form as K (K-1) / 2. The
vectors are not the member of the class
or
are
ignored when the formation of a binary classifier
(
,
). The last approach, the ECOC approach works
by providing a string of bits called codewords of
length , where denotes the number of classes.
Then created a binary classification of to predict
every bit codeword. To calculate the predicted result,
look for the closest distance between the codeword
and the classifier by using the Hamming distance
(Prasetyo, 2014).
3 METHODS
Stages of batik classification using the result of
texture analysis with SVM multiclass classification
method shown in Figure 3.
Some stages of batik classification are, datasets,
preprocessing, feature extraction, and classifiers: the
first stage, data collection batik image. The data is
divided into two groups which is training data and
testing data. The information is stored in one file with
the format .jpg.
The second stage, which will be pre-processing
for all data by changing all the image of batik into
gray scales that when extracting features does not get
the effect of RGB / HSV colors. The third stage is
feature extraction. In this research, used two feature
extraction methods, there are Gray Level Co-
occurrence Matrix (GLCM) and Discrete Wavelet
Transform (DWT). For the GLCM method with a
default degree orientation or 0 degrees and a distance
of 1 pixel can be calculated the frequency of gray
pairs appears between pixels in the direction and
distance that has been determined. After kookuren
matrix formed can be calculated statistical
characteristics of the image that is energy, in contrast,
homogeneity, correlation using Equations (2), (3),
(4), (6). While the DWT method using Daubechies 2,
level 3 can be calculated several statistical
characteristics there are energy, entropy, standard
ICMIs 2018 - International Conference on Mathematics and Islam
68

deviation, and mean using Equation (11), (12), (13)
and (14). The feature will be used for classification
stages. In the classification process used the multi
mile SVM method with the ecoc approach. The stages
in the multiclass SVM classification determines the
characteristic parameter, select the kernel that fits the
data, training data, and the test data to obtain
classification results. In this research using Gaussian
Kernel, The Gaussian Kernel was obtained through
Equation (9). The data will be divided into two, three
and four classes.
Figure 4: Flowchart Batik Classification.
4 RESULTS AND DISCUSSION
In this research, batik will be classified into two
classes which is Parang and Nitik, three classes there
are Parang, Nitik, and Semen, four classes there are
Parang, Nitik, Semen and Buketan. The process of
batik classification uses the GLCM and DWT
methods for feature extraction and the SVM
Multiclass with the ECOC approach to the
classification process.
Before the feature extraction, pre-processing is
required. In pre-processing, color images (RGB) are
converted into grayscale images. This process is used
to simplify the image model so that when extracting
features does not get the effect of RGB / HSV colors.
Image changes to grayscale images shown in Figure
5.
After obtaining a grayscale image, the next step is
the feature extraction process. Feature extraction is
used to get statistical features in the picture. There are
two feature extraction methods used are GLCM and
DWT. In this study using the GLCM method with an
orientation of 0 degrees and a distance of 1 pixel.
(a) (b)
(c) (d)
(e) (f)
(g) (h)
Figure 5: (a) Parang batik image, (b) gray scale image of
Parang batik, (c) Nitik batik image, (d) grayscale image of
Nitik batik, (e) Semen batik image, (f) grayscale image of
Semen batik, (g) Buketan batik image, (h) gray scale image
of Buketan.
After determining the direction, then make the co-
occurrence matrix using Equation (1). From the
matrix can be calculated statistical characteristics,
there are energy, contrast, homogeneity and
correlation using Equation (2), (3), (4) and (6). The
samples from feature extraction using GLCM are
shown in Table 1.
While the DWT method using duabechies 2 level
3. From the wavelet decomposition only from the
approximation, coefficients can be calculated
statistical features which is mean, standard deviation,
energy and entropy using Equations (11), (12), (13),
(14). The samples from feature extraction using DWT
are shown in and Table 2.
Batik Classification using Texture Analysis and Multiclass Support Vector Machine
69
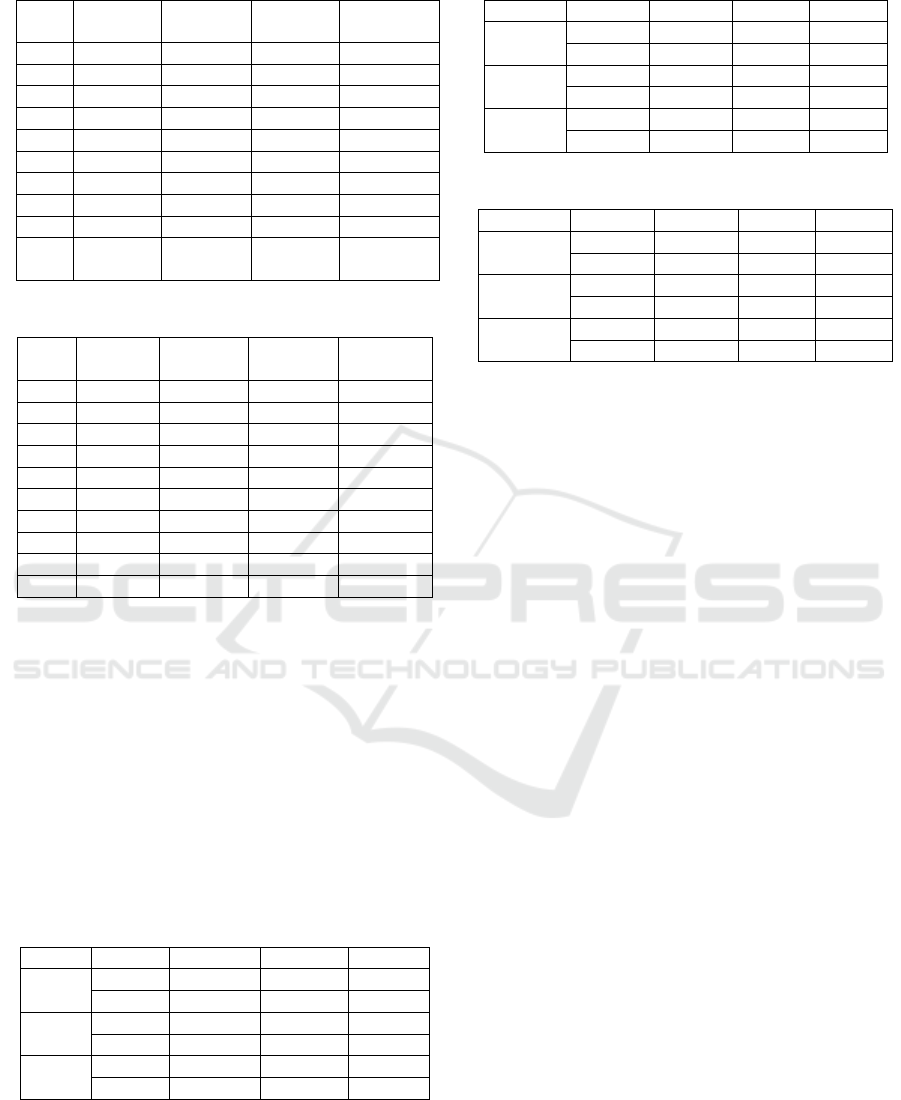
Table 1: Sample data feature extraction result using GLCM.
Data
Contrast
Corela-
tion
Energy
Homogeni
ty
1
2.32750
0.55703
0.07465
0.59638
2
1.78760
0.73334
0.06928
0.67667
3
1.83738
0.68679
0.11120
0.65869
4
2.07442
0.75875
0.08655
0.66997
5
2.34345
0.59124
0.05418
0.6244
6
0.28138
0.93332
0.10911
0.86300
7
1.56753
0.81615
0.11668
0.69613
8
1.42406
0.82779
0.11793
0.71025
9
5.17642
0.42063
0.02992
0.50094
10
0.66446
6
0.930196
0.08059
0.775365
Table 2: Sample data feature extraction result using DWT.
Data
Energy
Entropy
Mean
Standart
Deviation
1
0.6538
-1.6E+08
-0.11388
4.200617
2
2.67966
-7.4E+08
-0.0668
5.263958
3
1.06521
-2.2E+08
-0.26316
3.304104
4
0.7446
-1.2E+08
0.04548
5.188262
5
4.02238
-5.1E+08
0.252135
5.116634
6
4.22896
-4.5E+08
0.037634
4.344027
7
0.31044
-1.8E+07
0.003963
1.700911
8
2.6412
-1.7E+08
-0.12314
3.307191
9
0.61473
-1.9E+08
-0.0126
3.976344
10
2.85036
-8.9E+08
-0.26698
7.125455
These features are used as parameters in the
classification. There are two processes in the
classification, the training process, and the testing
process. The ratio of training data and testing data
used were 70%:30%, 75%:25%, and 80%:20%. The
classification process uses the ECOC Multiclass
SVM approach with the Gaussian Kernel. SVM
multiclass classificatory performance is measured
using three measure of performance is the accuracy,
precision, and recall. The result of an experiment with
four different types of data sharing between the two
methods stated in Table 3, Table 4 and Table 5.
Table 3: The results of the two-class classification.
Data
Method
Accuracy
Precision
Recall
70% :
30%
GLCM
92.3 %
91.87%
91.87%
DWT
73.05%
84.78%
65%
75% :
25%
GLCM
96 %
95%
96.88%
DWT
76 %
86.36%
66.67%
80% :
20%
GLCM
91.3%
88.89%
93.75%
DWT
78.26%
88.1%
64.29%
Table 4: The results of the three-class classification.
Data
Method
Akurasi
Presisi
Recall
70% :
30%
GLCM
86.67%
84.04%
82.92%
DWT
63.33%
46.33%
43.33%
75% :
25%
GLCM
88.89%
90.51%
82.64%
DWT
66.67%
43.81%
43.75%
80% :
20%
GLCM
88.46%
89.58%
82.04%
DWT
67.86%
43.13%
47.62%
Table 5: The results of the four-class classification.
Data
Method
Akurasi
Presisi
Recall
70% :
30%
GLCM
77.14%
82.50%
62.12%
DWT
42.85%
27.78%
30.97%
75% :
25%
GLCM
75.00%
75.00%
67.19%
DWT
53.13%
39.44%
34.90%
80% :
20%
GLCM
74.19%
77.03%
62.96%
DWT
58.06%
46.18%
38.91%
Based on Table 3, the classification of batik into
two-classes using GLCM based on the distribution of
data sets shows the best results in 75%:25% with 96%
accuracy, precision 95%, and 96.88% recall. From the
experiments show that the GLCM method is perfect
for recognizing each class. While the classification of
batik using DWT showed the best results on the
distribution of data sets 80%: 20% with an accuracy
of 78.26%, precision of 88.1% and recall of 64.29%.
From the experiment shows that the DWT method
can only recognize one class.
Based on Table 4, the classification of batik into
three-classes using GLCM based on the distribution
of data sets shows the best results in 75%: 25% with
an accuracy of 88.89%, precision of 90.51%, and
recall of 82.64%. The experiment shows that the
GLCM method is good for recognizing each class.
While the classification of batik using DWT showed
the best results on the distribution of data sets
80%:20% with an accuracy of 67.86%, precision of
43.13%, and recall 47.62%. The experiment shows
that the DWT method is good enough for recognizing
each class.
Based on Table 5, the classification of batik into
four-classes using GLCM based on the distribution of
data sets shows the best results in 70%: 30% with an
accuracy of 77.14%, precision of 82.50% and recall
of 62.12%. The experiment shows that the GLCM
method is good enough to recognize each class. While
the classification of batik using DWT showed the best
results on the distribution of data sets 80%: 20% with
an accuracy of 58.06%, precision of 46.18% and
recall of 38.91%.
ICMIs 2018 - International Conference on Mathematics and Islam
70

5 CONCLUSIONS
Based on, the experiment that has been performed,
batik classification into two classes and three classes
get the best results when using GLCM feature
extraction method with an accuracy of 96% for two
type of batik motifs, accuracy of 88.89% for three
kinds of batik motifs and accuracy of 77.14% for four
kinds of batik motifs. This indicates that the feature
extraction using GLCM method is better than the
DWT method to recognize batik pattern based on the
pattern.
ACKNOWLEDGMENTS
A big thank you to Allah SWT for giving blessings
and guidance in the life of the author, UINSA which
has provided an opportunity for the author to seek
knowledge.
REFERENCES
Achjadi, J., 1999. Batik Spirit of Indonesia. Jakarta: PT.
Buku Antar Bangsa.
Babasaheb G. P., Mane, N. N., and Subbaraman, S., 2012.
IRIS Feature Extraction and Classification using
FPGA. International Journal of Electrical and
Computer Engineering (IJECE), Vol 2, No 2, April
2012, 214–222.
Chen, D.-R., Chang, R.-F., Kuo, W.-J., Chen, M.-C., &
Huang, Y. .-L., 2002. Diagnosis of breast tumors with
sonographic texture analysis using wavelet transform
and neural networks. Ultrasound in Medicine &
Biology, 28(10), 1301–1310.
Chih-Wei Hsu, 2002. A comparison of methods for
multiclass support vector machines. IEEE Transactions
on Neural Networks, 12(2), 425–547.
Embaugh, S. E., 2017. Digital Image Processing and
Analysis Applications with MATLAB and CVIPtools
(Third Edition). Boca Raton: CRC Press.
Fanani, A., Yuniarti, A., & Suciati, N., 2014. Geometric
Feature Extraction of Batik Image Using Cardinal
Spline Curve Representation. TELKOMNIKA
(Telecommunication Computing Electronics and
Control), 12(2), 397.
He, X., Wang, Z., Jin, C., Zheng, Y., & Xue, X., 2012. A
simplified multi-class support vector machine with
reduced dual optimization. Pattern Recognition Letters,
33(1), 71–82.
Jayaraman, S., Esakkirajan, S., & Veerakuma, T., 2011.
Digital Image Processing. New Delhi: Tata McGraw
Hill Education Private Limited.
Karthikeyan, S., & Rengarajan, N., 2013. Performance
analysis of gray level cooccurrence matrix texture
features for glaucoma diagnosis. American Journal of
Applied Sciences, 11(2), 248–257.
Moertini, V. S. & Sitohang, B., 2005. Algorithms of
Clustering and Classifying Batik Images Based on
Color, Contrast and Motif. ITB Journal of Engineering
Science, 37(2), 141–160.
https://doi.org/10.5614/itbj.eng.sci.2005.37.2.5
Mohanaiah, P., Sathyanarayana, P., & Gurukumar, L.,
2013. Image Texture Feature Extraction Using GLCM
Approach. International Journal of Scientific &
Research Publication, 3(5), 1–5.
Musman, A., & Arini, A. B., 2011. Batik Warisan
Adhiluhung Nusantara. Yogyakarta: G Media.
Öztürk, Ş., & Akdemir, B., 2018. Application of Feature
Extraction and Classification Methods for
Histopathological Image using GLCM, LBP,
LBGLCM, GLRLM and SFTA. Procedia Computer
Science, 132 (ICCIDS), 40–46.
Prasetyo, E., 2014. Data Mining Mengolah Data Menjadi
Informasi Menggunakan MATLAB. Yogyakarta: Andi.
Putra, R. E., Suciati, N., & Wijaya, A. Y., 2011.
Implementing Content Based Image Retrieval for Batik
Using Rotated Wavelet Transform And Canberra
Distance. Bali International Seminar on Science and
Technology, 1–5.
Rangkuti, A. H., 2014. Content based batik image
classification using wavelet transform and fuzzy neural
network. Journal of Computer Science, 10(4), 604–613.
Shi, Y. Q., & Jeon, B., 2006. Digital Waternarking. Korea:
Springer.
Suresh, A., 2012. Image Texture Classification using Gray
Level Co-Occurrence Matrix Based Statistical
Features. European Journal of Scientific Research,
75(4), 591–597.
Tzotsos, A., and Ardialas, D., 2008. Support vector
machine classification for object-based image analysis.
Final Paper. Retrieved from http://datascienceassn.
org/sites/default/files/A%20Support%20Vector%20M
achine%20Approach%20for%20Object%20Based%20
Image%20Analysis.pdf, accessed on December 8,
2018.
Wulandari, A., 2012. Batik Nusantara - Makna Filosofis,
Cara Pembuatan & Industri Batik. Yogyakarta: Andi.
Zulpe, N., & Pawar, V., 2012. GLCM textural features for
Brain Tumor Classification. International Journal of
Computer Science, 9(3), 354–359.
Batik Classification using Texture Analysis and Multiclass Support Vector Machine
71
