
Function of Distractors in Mathematics Test Items on the
Achievement Tests based on the Rasch Model
Syahrial
1
and Haryanto
2
1
Graduate School of Yogyakarta State University, Jl. Colombo No 1. Yogyakarta, Indonesia
2
Faculty of Engineering Yogyakarta State University, Jl. Colombo No 1 Karaang Gayam. Yogyakarta, Indonesia
Keywords: Distractors, Mathematics Test Items, Rasch Model.
Abstract: This research aimed to reveal: (1) the items characteristics of mathematics test and the test information
function, (2) identify the function of distractors in mathematics test items based on Rasch models. This study
is an exploratory study with a quantitative approach. Data collection technique used in this research was
documentation of student answer response at the mathematics achievement test. Analysis of item
characteristics and distractors used item response theory of Rasch model. The analysis was performed by
using program WINSTEP 3.73. Result of analysis shows that the reliability index .82, from 40 items used
there are three items that do not fit, The mathematics test had a good information function and was suitable
for measuring students with moderate ability, with the maximum information function obtained at 7.589 logit
with a standard error of measurement of .363 on the ability (θ) .00.From 40 items of mathematics test that
were analyzed, 10 of it have dysfunction and 8 of it should be confirmed toward the key answer as they are
backlashing the theory. Overall the measurement results with the Rash model obtained that 45% of the
distractors did not function effectively. The distractors on the test items did not function effectively because
they were selected more by groups with high abilities than by groups with low abilities.
1 INTRODUCTION
Along with the development in education and
technology today that bring influence on the
development of science, it will have an impact on the
knowledge that becomes key component for us, thus
our life cannot be separated from IT, especially
concerning the development of education, either in
the learning process or in the assessment of learning
outcomes, and also must be noted that learning
process was intended to make changes (Mardianto,
2009). Whether we ready or not, students and
teachers should be involved and participate in the
development of science, therefore, to balance the
development in science then teachers must be precise
in defining and applying any knowledge in the
learning and assessment process.
Mathematics plays an important role in improving
the quality of human resources, it is because
mathematics can train students to think logically, take
responsibility and solve problems in their daily life.
Therefore, learning mathematics is very important, so
that we can apply to each level of formal education,
yet every student is expected to have the ability to
learn mathematics. Each person has different pattern
of thought and level of intelligence. This capability is
also likely to affect in completing the math test, we
also need to consider whether the items tested have
fulfilled the standard or not, thus it needs to be
examined and a separate analysis regarding writing
such items test, especially in math.
Sulistiawan on his research shows that quality of
examination in schools can be categorized as follow:
one school has very good quality of test items, two
schools have good quality, one school with fair
quality and one school with bad quality. Qualitatively
speaking, according to analysis based on Classical
Test Theory, we can categorize the result into: one
school has good quantity of test items, three with fair
quantity, and one with bad quantity. According to the
Response Items Theory, quantitatively speaking we
have three schools with good level, one with fair
level, and one is bad. Contribution of school test’s
score toward total score in National Examination is
good in average, one school reflects very big
influence; three school have big influence, and three
one school has good influence (Sulistiawan, 2016).
Another study discussed the characteristics of test
210
Syahrial, . and Haryanto, .
Function of Distractors in Mathematics Test Items on the Achievement Tests based on the Rasch Model.
DOI: 10.5220/0008519502100216
In Proceedings of the International Conference on Mathematics and Islam (ICMIs 2018), pages 210-216
ISBN: 978-989-758-407-7
Copyright
c
2020 by SCITEPRESS – Science and Technology Publications, Lda. All rights reser ved

items in school shows that there are 45% of the
sample that fulfil the analysis based on Classical Test
Theory, while there are 90% of the sample that meet
with Response Items Theory (Mulyana, 2007). Yet in
the same issue of other studies on the characteristics
of final exam items in Bengkulu city shows that the
question used for final exam are not all have good
characteristics, only 50% in average of each subjects
which has good quality of test items (Ariani, 2006).
Those three studies showed that the quality of test
items is still in good enough category, but the analysis
conducted was based on the quality of the overall
problem and did not look specifically especially in
MCQs that have detractors.
In multiple-choice tests, the quality of distractors
is more important than the number of distractors
itself, items that have well-function of distractors
produce more reliable test scores regardless of the
number of the options (Papenberg & musch, 2017).
Distractor can ‘regulate’ the difficulty level of the
items, doing check to the distractors provide useful
information for purposes of measurement since
people can identify groups that are prominent ability
is influenced by specific distractors (Tsaousis,
Sideridis, & Al-Saawi, 2017). Good items are not
only having appropriate level of difficulty and high
distinguishing but also has effective distractors. The
function of distractor is in opposite to the function of
distinguishing item, if distinguishing items shown by
a greater proportion of subjects in a high group which
can answer correctly compared to the proportion of
low subjects which cannot answer, while the
functions of the distractors are effectively
demonstrated by a greater proportion of group of low
subjects which trapped by the distractor than the
proportion of high-group subjects or which can
answer correctly (Anwar, 2016, p. 140). Ideally
distractor should be selected by the subjects who had
low ability, while subject with high ability should not
be voted, as well as on the answer key in which higher
subject was supposed to answer, but in fact there are
students choosing wrong answer, on that points the
distractions are functioned.
Each distractor should be chosen by at least 5% of
total examinees. If an item has five answer options so
that the distracted is expected 20% (Subali, 2016, p.
20). Meanwhile, according to Mardapi the distractors
can be received when each option is chosen by at least
5% of participants (Mardapi, 2017, p. 111). Whether
distractor can be functioned effectively or not
according to Rasch model can be managed through
WINSTEP program by looking at the Average
abilities. The theory of this model explains that
people who are responding to the higher category
should have higher average value of measurement,
this can be seen from average ability, so the average
ability of answer key should be higher in value than
the mean of average ability on the distractors
(Linacre, 2006, p. 254). Chance answer for the
answer keys and distractor works in opposite, the
higher the ability of test taker then chance of choosing
the answer key is getting higher and vice versa, as
well as the higher the ability of the test taker then the
chance of selecting the distractors more is low and
vice versa.
Rasch modelling is one of the main models in item
response theory that taking one parameter
measurement model and focuses on the difficulty
level parameter items (Rasch, 1980). The main
purpose of modelling is to make the Rasch
measurement scale with equal intervals. Rasch
explains that someone who has higher capacity than
other people then have greater probability to complete
every items on exam questions, and also the items
become more difficult than others means that the
possibility to complete the second item is more
difficult for every person (Bond & Fox, 2015, p. 8).
Rasch modelling to the data in the form of
dichotomous (which in the scoring process uses the
system: correct answer given a score of 1 and wrong
answer is given a score of 0) incorporates an
algorithm that states the expectation probability
outcomes from items i and respondent n, which
mathematically expressed as follows (Bond & Fox,
2015, p. 327).
(1)
Explanation:
The probability of person n on
item i scoring a correct
Person ability
Item difficulty.
Each measurement always produces information
regarding the measurement result, the measurement
information is subject of relationship between
individual measured test (Sumintono & Widhiarso,
2015, p. 86). By knowing the function of information
item, we will obtain which item information that is in
accordance with the model to assist in the selection of
test items. Mathematically speaking, function of item
information is defined as follows (Hambleton,
Swaminathan, & Rogers, 1991, p. 91).
(2)
Function of Distractors in Mathematics Test Items on the Achievement Tests based on the Rasch Model
211
Explanation:
= the information provided by item i at..
= the derivative of
with respect to .
= the probability of item i scoring a correct.
=
(the probability of item i scoring
an incorrect).
Number of the test item information function is a
function of test information, if the items in test have
high information function, so that the function
information of test tools will be high as well.
Mathematically function test information is defined
as follows (Hambleton, Swaminathan, & Rogers,
1991, p. 94).
(3)
The function information is always closely related
to the standard error of measurement, the greater
information function, the smaller the standard error of
measurement and vice versa, and the smaller the
information function, the greater the standard error of
measurement, mathematically standard error of
measurement defined as follows (Hambleton,
Swaminathan, & Rogers, 1991, p. 94).
(4)
This research aimed to reveal: (1) the items
characteristics of mathematics test and the test
information function in Senior High School
(Madrasah Aliyah Negeri 3 Yogyakarta) with tenth
grade, (2) identify the function of distractors in
mathematics test items based on Rasch models in
Senior High School (Madrasah Aliyah Negeri 3
Yogyakarta) with tenth grade.
2 METHOD
This study is an exploratory study with a quantitative
approach which is ex-post facto approach in order to
see the effects and causes of previous treatment, so
that untreated to the data used. This study was taken
place in Senior High School (Madrasah Aliyah
Negeri 3 Yogyakarta) with tenth grade students as the
participants. This research was conducted in May
until August 2017. The type of data used in this
research is secondary data. Data collection technique
used in this research was documentation of student
answer response at the Mathematics test of Senior
High School with tenth grade in the academic year of
2016/2017. Analysis of item characteristics and
distractors used item response theory (IRT) of Rasch
model. To conduct the sampling process, we used
total sampling technique that data in the whole
population. Analysis with the Rasch model of
acceptable values between - 2 to +2 with samples
used between 30 and 300 people (Bond & Fox, 2015,
p. 45).In this study the sample used was 227
respondents and the number of samples was sufficient
to the analysis using the items response theory with
Rasch model. The analysis of the distractor function
of mathematics test items based on the Rasch model
was performed by using program WINSTEP 3.73.
3 RESULTS AND DISCUSSIONS
From 40 items of math test, it turns out there are three
items that do not fit which is Item 6 (MNSQ = 1.68),
Item 30 (MNSQ = 1.63), and Item 3 (MNSQ = 1.62),
those three items not meet the criteria which is 0.5 <
Outfit Mean square (MNSQ) < 1.5 (Boone, Staver, &
Yale, 2014). Those three test items need to be
repaired or replaced. Reliability index received
should be a minimum of 0.7 (Mardapi, 2017). The
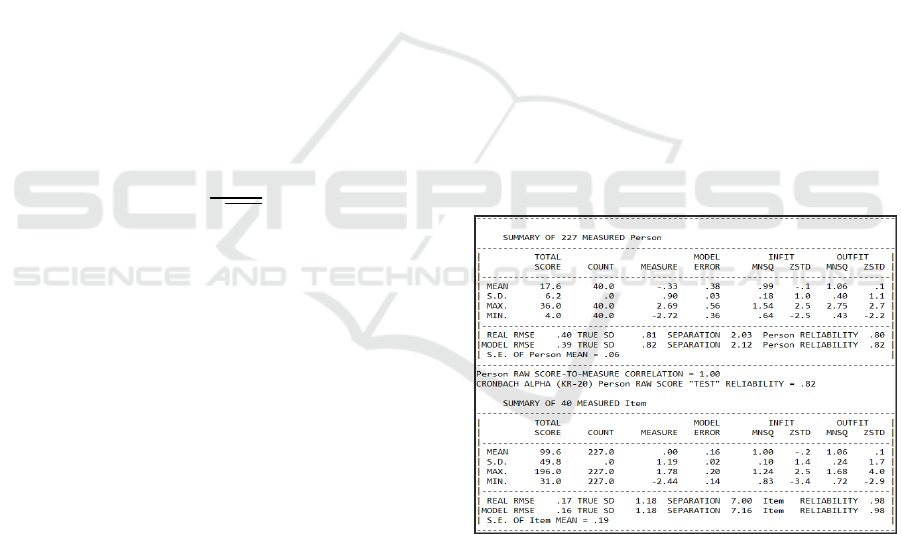
result of calculation can be seen at Table 1.
Table 1: Summary Statistics.
According to the table we can conclude that: 1)
value of person measure -.33 logit that shows the
average value of all respondents on the given
problem, and the value of the item measure logit .00.
Logit mean value if we compare the platform to item
is -.33 < .00, which means the ability of students is
smaller than the level of difficulty of the questions. 2)
The value of reliability with Cronbach Alpha = .82,
which means great value of reliability. 3) Person
Reliability value = .80 and Item Reliability = .98, it
can be concluded that the consistency of the answers
of the students are good, the quality of items within
ICMIs 2018 - International Conference on Mathematics and Islam
212
instruments is good. 4) In-fit and Out-fit MNSQ
average value for person table are .99 and 1.06, the
ideal value is 1.00 (closer to 1.00, the better); In-fit
value of ZSTD and Out-fit value of ZSTD for table
person are 0.1 and 0.1 in which the ideal value is 0.0
(closer to .0, the better quality). From the above
calculation, we know that both ZSTD and MNSQ are
approaching the ideal criteria to conclude that the
person value is very good, as well as on the item. 5)
Separation or grouping, the criteria for separation
value is > 3, the greater the value of separation, the
quality of the instrument in terms of overall grain
would be better; in this case the separation value for
the item is 7, showing a very good value.
Besides reliability, difficulty level should also be
recognized. The level of difficulty is the proportion of
participants who answered the item correctly (Allen
& Yen, 1979, p. 120). Acceptance criteria for level of
difficulty index on the Rasch model of item response
theory is from -2 to +2 (Hambleton, Swaminathan, &
Rogers, 1991, p. 13). The level of difficulty in Rasch
models can be seen on the variable map. Based on the
analysis we know that from 40 items that were
analyzed there are 7 items with high difficulty level
with a percentage of 17.5%, 26 items with medium
level with the percentages of 65% and 7 items that are
easy with the percentage of 17.5%. As for the details
we can see in Table 2 which is a summary of the
distribution of item difficulty.
Table 2: Which is a summary of the distribution of item
difficulty.
Criteria
Item
Percentage
Easy
32, 34, 14, 23, 33, 39, 25,
17,5
Moderate
17, 24, 26, 9, 15, 38, 16,
10, 37, 29, 5, 1, 7, 20, 35,
19, 36, 18, 8, 21, 27, 11,
3, 2, 22, 4
65
Hard
30, 40, 13, 28, 31, 6, 12
17,5
According to the table above we can see that the
item No. 12 is the most difficult items to be done No.
32 is easiest one. Measurement graphs between
chances to answer correctly with the level of
difficulty of the item can be shown by the ICC graph,
and the results of measurement can be seen in
Appendix A.
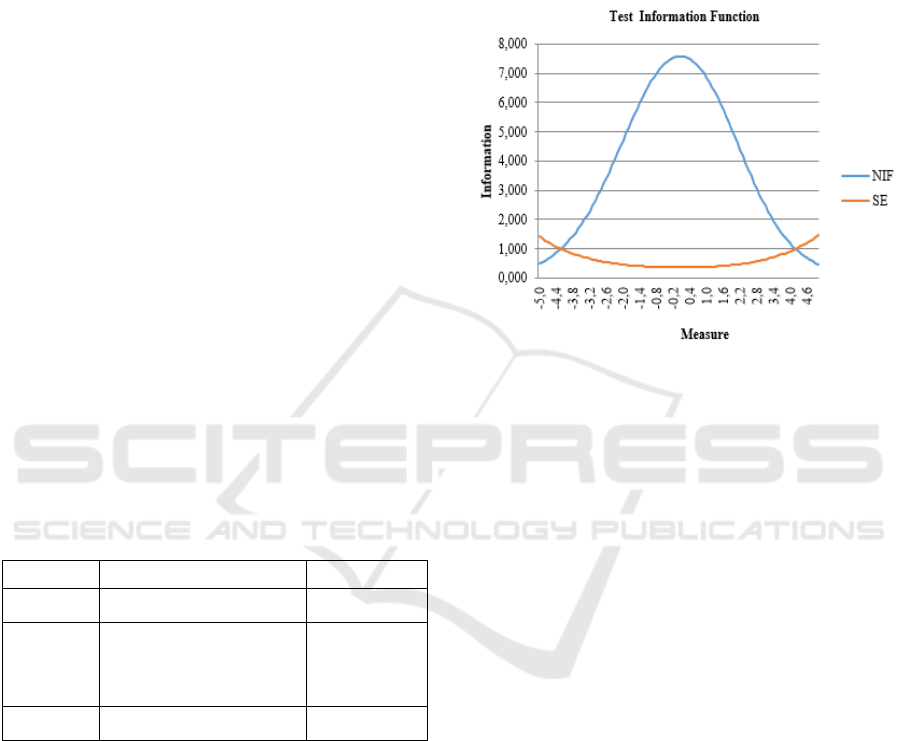
3.1 Test Information Function
Each measurement always produces information
regarding the measurement results, the measurement
information is subject of the relationship between the
individual measured test (Sumintono & Widhiarso,
2015, p. 86). Measurement information is affected by
variations in the results we get. Axis - X indicates the
level of students' ability to work on the problems.
Axis - Y explain the magnitude of the function
information. NIF= value of information function SE=
standard error of measurement.
Figure 1: Test information function.
According on the graph of the function test
information can be concluded that on low ability
level, the information obtained from the measurement
will also low. At the level of high capability, the
information obtained from the measurement is also
low. At the level of moderate ability, the information
obtained by the measurement is very high. This
indicates that the item is used to produce the optimal
information at the time given to individuals who have
moderate capability. Function test information
obtained at 7.589 in moderate skill level, with
standard error of measurement .363 on the ability ()
.00. Based on this information function can be seen
that the tested math exam is suitable for
measurements within range of ability from -4 to +4.
If we conduct the test beyond the measurement so
there will be greater error.
3.2 Item Characteristic Curves (ICC)
Identification of capability and level of difficulty can
be seen by looking at the Item Characteristic Curves
(ICC). ICC shows the simpler version of the difficulty
items as well as the proportion of respondents in
answering any of the test items. Chance to answer
correctly for each item is 50% or .5 if the capability
equal to the level of difficulty of these items, if the
ability is lower than the level of difficulty to answer
items correctly then the chances of that item is < 50%
Function of Distractors in Mathematics Test Items on the Achievement Tests based on the Rasch Model
213

(< .5), and if the ability is higher than the level of
difficulty to answer correctly then the chances of that
clause is > 50% ( > .5). The results of the analysis of
40 test ICC items can be seen on graph as shown in
Figure 2.
Figure 2: Item Characteristic Curves (ICC) to 40 Items.
3.3 Function of Distractors
In this case, the criteria use for distractors is when at
least chosen by 5% of all participants. The results of
the analysis to items which need to be checked into
answer key can be found in Appendix B. From the 40
items analyzed, it can be seen that there are 18 items
that some of its distractor is not effectively
functioned, namely item No. 5 on the distractor A,
item No. 7 on the distractor E, item No. 11 on the
distractor A, item No. 13 on the distractor E, item No.
14 on the distractor D, B and A, item No. 15 on the
distractor E, item No. 23 on the distractor A, item No.
No. 29 on the distractor D, item No. 30 on the
distractor E, from those 10 selected items only 4% of
all distractor that has been chosen by the participants.
Item No. 20 on the distractor E, item No. 38 on the
distractor C and item No. 39 on the distractor C, from
those three selected items only 3% of all distractor
that has been chosen by the participants. Item No. 31
on the distractor A and E chosen by 4% and distractor
B chosen by 3% of the entire test takers. Item No. 32
distractor C and D chosen by 1% and distractor E is
not selected at all by all participants. Item No. 33
distractor B been chosen by 1% and distractors A
chosen by 3% of all participants. Item No. 34
distractor E been chosen by 1% and distractor C was
not selected at all by all participants. Item No. 36
distractor C been chosen by 2% and distractor B
chosen by 4% of all test takers. Distractors that do not
work must be re-arranged, especially on item No. 32
and No. 34 that one of the distractors is not even been
chosen by the participants, it indicates that there is big
error on it.
Items which there are an empty choice or no
answer in it are item No. 2, 3, 6, 7, 8, 9, 11, 15, 18,
19, 24, 26, 35, 37, 40. From those 15 items which
contain empty or missing data, only two items that the
data loss being chosen by more than one student,
which are item No. 6 with three students who did not
chose the answers, and item No. 24 with two students
who did not give an answer. According to the analysis
of Rasch models there are 8 items which indicate that
the item was to check the suitability of the answer
key. Items that the key answer needs to be checked
are items No 2, 3, 6, 7, 11, 15, 18, 35. Those eight
items are need be checked toward its suitability to the
answer key as the results contradict with analysis
theory which showed that the average ability of the
answer key should be greater than the average in each
distractor, which identify the one who choose the
answer keys are students with high ability. While the
graph of chance to answer correctly and chance to
choose the distractor is shown in Figure 3.
Figure 3: The probability to answer correctly the answer
key and the probability to answer distractor.
According to the Figure 3, it shows that the chance
to choose the answer keys and distractor work in
opposite, the higher the ability of test taker then the
chance of choosing the answer key is getting higher
and when the lower the ability of test taker then the
chance of choosing an answer key is getting lower,
and vice versa, in which the higher the ability of test
taker then the chance of choosing the distractors are
getting lower and when the lower the ability of test
taker then the chance of selecting the distractors will
be higher as well. The point of intersection of the
graph is at mid which is and the ability and
chance to choose key answers and distractors are
equal which is 50% or .5.
ICMIs 2018 - International Conference on Mathematics and Islam
214

4 CONCLUSIONS
According to the analysis, it can be concluded that out
of 40 math test items on that were analyzed, there are
three items that do not fit with the model, the tests
used indicates that math test produces optimal
information at the time given to individuals with
moderate ability. Distractors will not function
effectively according to the Rasch model if we see
from proportion of participants who choose 10 items,
whereas if it is seen by Average ability there are 8
items that need to be checked and confirmed to the
answer key, so it can function properly. Overall the
measurement results with the Rash model obtained
that 45% of the distractors did not function
effectively. The distractors on the test items did not
function effectively because they were selected more
by groups with high abilities than by groups with low
abilities.
5 RECOMMENDATION
Looking at the results of this study, the authors
recommend: 1) for teachers, as an important input and
need to be considered especially those in the
manufacturing distractor on test items, so that the
distractor can function properly. 2) for researchers, as
enhancing knowledge and insight in making a good
test item and determine the effectiveness of the
distractor on the math test and as a comparison or
reference to other authors who will examine the
relevant issues. 3) for schools, that served as a policy
maker is to give information about the importance of
considering items writing, especially in the function
of tests distractors, especially for the math tests.
ACKNOWLEDGEMENTS
Thank God we pray to Allah SWT who has given
health and the opportunity for us to be able to write
this paper into completion. We are also thankful to the
principal of Madrasah Aliyah Negeri 3 Yogyakarta
and tenth grade math teachers who has helping us in
the process of collecting the data.
REFERENCES
Allen, M. J., & Yen, W. M., 1979. Introduction to
Measurement Theory. California: Brooks/Cole
Publishing Company.
Ariani, N. M., 2006. Karakteristik dan Nilai Fungsi
Informasi Butir Soal Ujian Akhir Sekolah Dasar di
Kota Bengkulu. Jurnal Penelitian dan Evaluasi
Pendidikan, 8(2), 213-230.
doi:http://dx.doi.org/10.21831/pep.v8i2.2004
Azwar, S., 2016. Konstruksi Tes Kemampuan Kognitif.
Yogyakarta: Pustaka Pelajar.
Bond, T. G., & Fox, C. M., 2015. Applying the Rasch
Model, Fundamentals Measurement in the Human
Science (3th ed). New York: Routledge.
Boone, W. J., Staver, J. R., & Yale, M. S., 2014. Rasch
Analysis in the Human Sciences. Dordrecht: Springer.
Hambleton, R. K., Swaminathan, H., & Rogers, H. J., 1991.
Fundamental of Item Response Theory. Newbury Park,
California: Sage Publication Inc.
Linacre, J. M., 2006. A User's Guide to Winsteps and
Ministeps (Rasch Model Computer Programs).
Chicago: Winsteps®.
Mardapi, D., 2017. Pengukuran Penilaian dan Evaluasi
Pendidikan (2 th ed). Yogyakarta: Parama Publishing.
Mardianto, 2009. Psikologi Pendidikan. Bandung:
Citapustaka Media Perintis.
Mulyana, K., 2007. Karakteristik Soal Tes Masuk SMP
Negeri di Kabupaten Bantul. Jurnal Penelitian dan
Evaluasi Pendidikan, 10(2), 235-248. doi:
http://dx.doi.org/10.21831/pep.v10i2.1985
Papenberg, M., & Musch, J., 2017. Of Small Beauties and
Large Beasts: The Quality of Distractors on Multiple-
Choice Tests Is More Important Than Their Quantity.
Applied Measurement in Education, 30(4), 1-32. doi:
10.1080/08957347.2017.1353987
Rasch, G., 1980. Probabilistic Models for some Intelligence
and Attainment Tests. Chicago: University of Chicago
Press.
Subali, B., 2016. Pengembangan Tes (Beserta Penyelidikan
Validitas & Reliabilitas Secara Empiris). Yogyakarta:
UNY Press.
Sulistiawan, C. H., 2016. Kualitas Soal Ujian Sekolah
Matematika Program IPA dan Kontribusinya Terhadap
Hasil Ujian Nasional. Jurnal Penelitian dan Evaluasi
Pendidikan, 20(1), 1-10.
doi:http://dx.doi.org/10.21831/pep.v20i1.7516
Sumintono, B., & Widhiarso, W., 2015. Aplikasi
Pemodelan Rasch pada Assessment Pendidikan.
Cimahi: Trim Komunikata.
Tsaousis, I., Sideridis, G., & Al-Saawi, F., 2017.
Differential Distractor Functioning as a Method for
Explaining DIF: The Case of a National Admissions
Test in Saudi Arabia. International Journal of Testing,
18(1), 1-26. doi: 10.1080/15305058.2017.1345914
Function of Distractors in Mathematics Test Items on the Achievement Tests based on the Rasch Model
215
APPENDIX A
Level of item difficulty
APPENDIX B
Items that need to be checked for distractors
and key answers.
ICMIs 2018 - International Conference on Mathematics and Islam
216
