
Analysis of Poverty Data in Bengkulu City by Small Area Estimation
using Penalized Splines Regression
Idhia Sriliana
1
, Etis Sunandi
1
and Ulfasari Rafflesia
2
1
Department of Statistics, the University of Bengkulu, Bengkulu, 38125, Indonesia
2
Department of Mathematics, the University of Bengkulu, Bengkulu, 38125, Indonesia
Keywords: Bengkulu City, Penalized Splines Regression, Poverty Data, Small Area Estimation.
Abstract: This study aims to analyze poverty data in Bengkulu City. The method of this study is Small Area Estimation
(SAE) with penalized splines regression approach. Then descriptive statistical analysis is carried out. The data
used is the Bureau of Statistics (BPS) Of Bengkulu with some poverty indicators as predictor variables. The
results showed the best spline model is a model that is considered linear spline with some node points.
Evaluation of model used optimal GCV. The results of descriptive statistical analysis of the average of per
capita outcome at the village level in the city of Bengkulu using the extensive estimation method with the p-
spline regression approach has an average value of Rp.1,009,817.20. About 75% of urban villages in the city
of Bengkulu have an average per capita yield of Rp 1,244,188.15 and the twenty-five percent of urban villages
in Kota Bengkulu have an average per capita outcome about Rp 753.527.25. The high average per capita
outcome is in the Kebun Dahri Village Rp. 3.115.614,20 and the lowest outcome from the Padang Nangka
Village that is Rp 439.830.40.
1 INTRODUCTION
In general, the level of poverty in Bengkulu Province
period 2009-2017 decreased both in terms of quantity
and percentage of exceptions, except in March 2012
and March 2013. Based on the Central Bureau of
Statistics (BPS), the number of poor people in
Bengkulu Province in September 2017 reached
302,620 people (15, 59 %). There was a decreasing
number of poor people by 14,360 people compared to
March 2017. Meanwhile in the last September, the
number of poor people decreased by 22,980 people.
Nevertheless, poverty problem is still be a challenge
for local governments of Bengkulu. The poverty
alleviation becomes the priority programs in
Bengkulu Province, including in Bengkulu City.
Bengkulu city is the capital of Bengkulu province
which the high rate of poverty equals to 20.72%
(BPS, 2018).
Besides policies and programs of poverty
alleviation, poverty data validation is also necessary.
Thus, the program launched is on target. The poverty
is a multi-dimensional problem. It is not easy to
measure and need appropriate measurement
approach. BPS uses the concept of basic needs
approach to measure the poverty data. Through this
approach, poverty is figured as an economic inability
to meet the basic needs of food and not food measured
by expenditure. As result, poor people are people who
the average per capita outcome is lower than the
poverty line (BPS, 2012).
The method that can be used to estimate the
average of per capita outcome as an indicator of
poverty measurement is the Small Area Estimation
(SAE). SAE is a statistical method for predicting
parameters at a subpopulation where the number of
samples is smaller or nonexistent. This estimation
technique uses data from large domains to predict
parameters at smaller domains that can be a village,
sub-district, district, ethnic group, or age group. SAE
methods have concept indirect estimation of
parameters in a relatively small area in survey
sampling, which the direct estimation does not
provide adequate accuracy if the sample size is in a
small area, thus the statistics result will have a large
variance, or the predictions cannot be made because
they are not represented in the survey (Prasad and
Rao, 1990)
Generally, the SAE uses parametric modeling to
link a small area statistic with supporting variables.
However, the SAE model can also be made using the
nonparametric approach. This modeling is more
Sriliana, I., Sunandi, E. and Rafflesia, U.
Analysis of Poverty Data in Bengkulu City by Small Area Estimation using Penalized Splines Regression.
DOI: 10.5220/0008520302530259
In Proceedings of the International Conference on Mathematics and Islam (ICMIs 2018), pages 253-259
ISBN: 978-989-758-407-7
Copyright
c
2020 by SCITEPRESS – Science and Technology Publications, Lda. All rights reserved
253

flexible in adjusting survey data patterns that may not
as similar as formal distribution at all. One of the
nonparametric approaches that can be used Penalized
spline regression. Penalized spline regression can
estimate data that do not have a specific pattern. This
method can control the smooth characteristic of the
regression curve, so it is avoided from over fitting
problems (Litawati and Budiantara, 2013)
Various researches are have been done using
small area estimation with nonparametric approach
such as: Sriliana et al. (2018) researched poverty
modeling in Bengkulu Province using SAE with
Semiparametric Penalized Spline approach, Sriliana
et al. (2016) mapped poverty in Mukomuko District
using SAE with Penalized Spline regression
approach, Baskara (2014) examined SAE with P-
spline approach to estimate per capita outcome in
Sumenep District, Salvati et al. (2008) used a
nonparametric based direct estimator model, and
Opsomer et al. (2008) develop SAE with penalized
spline regression approach .
In this research, the poverty data in Bengkulu City
is analyzed using method SAE with approach
Penalized spline regression. Next, the estimation of
model parameters by using penalized spline
regression is used to model the average per capita
outcome at village-level in Bengkulu City based on
several variables of poverty indicators. The
evaluation of prediction results is done by looking at
the GCV values in the model.
2 LITERATURE REVIEW
2.1 Small Area Estimation
Small Area Estimation (SAE) is a statistical technique
for estimating parameters of a subpopulation that the
sample size is small or even areas that are not
sampled. In SAE there are two basic model types
used, i.e. area-based model and unit-based model
(Rao, 2003). In the area-based SAE model,
supporting data are available only to the area level.
The area-level model connects the direct estimator of
a small area with supporting data from another
domain for each area.
Small area parameters to be observed are
.
Linear model that explains the relationship is:
(1)
With
is the regression coefficient of
measurement ,
= known positive constants,
= small area random effect, assumed
Where and
is the
supporting data of the to-i area .
In making the conclusions about the population, it
is assumed that the value of the estimate is immediate
known then can be expressed as follows:
i i i
ˆ
e
(2)
Where
is sampling error, assumed
and . .
The SAE model for the area level consists of two
levels of the model component i.e. the indirect
estimation model component corresponding to
equation (1) and the component of the direct
estimation model according to equation (2). The
models of equations (1) and (2) if combined form the
following equation:
(3)
Where .
2.2 Penalized Splines Regression
Penalized Spline Regression is a very interesting
smoothing method because it has a simple nature. Let
Y be the response variable and X
i
is the predictor
variable form observation, then according to Eubank
(1999) the general model of nonparametric regression
can be defined as:
(4)
Function
(.)m
is an unknown function of
regression and form assumed smooth. Function
(.)m
can be approximated by penalized spline [12]
01
1
...β
K
p
p
p p k k
k
m x x x x
(5)
Where
1p
is an integer which is the order of the
spline function,
1
...
K
is the set of K knots
(fixed) and
01
,..., , ,...,β
T
p p p K
is the
vector coefficient of the unknown parameter. Vector
12
, ,...,
T
p p p K
is a spline coefficient vector.
Function
.m
large when K is so large that the
smoothing function has a high degree of accuracy
Spline function on using a truncated
Polynomial splines base
1
1, ,..., , ,...,
pp
p
K
x x x x
to predict the
ICMIs 2018 - International Conference on Mathematics and Islam
254

function
.m
. Other base also possible, particularly
when x is a multivariate case. Given the selection of
base functions, the spline function can be expressed
as a linear combination of the base function. In
addition, the spline model can be expressed as a
parametric model. So, from the Equation (5) identical
with:
,ββm x x
(6)
Where
x
=
1
1, ,..., , ,...,
pp
p
K
x x x x
β
=
0,
...,
T
pk
Let's
is a collection of data.
Using the least squares method and set a parameter
common
, Equation (6) can be solved by defining
the regression parameter estimator as the minimum
value of
on:
2
2
11
min ;
nK
i p k
ik
Y m x β
(7)
Where
is a finishing or penalty parameter (fixed).
If given a function
(.)m
for variables
12
, ,...,
T
j
x x xx
, the additive model for the
nonparametric regression model of (3) is an additive
function defined as
1
1, 2, ...,
J
jj
j
m m x j J
x
(8)
According to Ruppert, Wand, and Carrol (2003),
the parameter coefficients of the functional base
additive model can be estimated using the penalized
least square, the additive function in (8) can be
estimated by
11
ˆ
ˆˆ
K
p
kj j kj
p
l
j j lj j
l k
xx xm
Where
ˆ
lj
is the parameter estimate for
l
j
x
.
2.3 Selection of Optimal Knot Points
Smoothing parameters is the balance controller
between regression curve graduation and suitability
of function against data. If then the estimated
function will be smoother, while if small then the
estimated function obtained will be greater or the
functions become more volatile. One of the methods
used to get optimal is Generalized Cross Validation
(GCV) defined as follows (Ruppert, 2002):
2
2
1
2
-1
-1
ˆ
- ; ( )
- ( )
1- (
β
S
S
n
ii
i
Y m X
n tr I
MSE
GCV
n n tr
(9)
is a fining matrix where
with
is a
spline slice function matrix,
ˆ
; ( )β
i
mX
is a
function estimate.
2.4 Small Area Estimation using
Penalized Spline Regression
Approach
The regression model of p-spline on equation (5) can
be written in the form of:
01
1
...
K
p
p
i p j i j i
j
y x x x k e
(10)
Or can be written in the form
Y = Xβ + Zγ +e
(11)
Where
1
=( ... )
T
n
yyY
Opsomer et al. (2008) is using the
Penalized spline to estimate a small area by adding a
small area random effect to equation (11), thus
obtaining:
eYXβ + Zγ + Du
(12)
Where nonparametric function
Xβ + Zγ
is a
function spline which contains nonlinear
components,
Du
is the effect of random small areas,
1
,...,
T
n
ddD
is a covariance matrix, and u is a
small area effect vector, each random component is
assumed to be independent of each other, and
2
2
2
,
,
,
K
u u u T
n
I
I
I
γγ
0,
0,
0,
(12)
If the variety component is known, the influence
estimate remains
β
can be done with the Maximum
Likelihood Estimation (MLE) method by assuming
and
u
as a random influence. Equation (12) can be
written as [7] :
YXβ + ε
Where
e
ε Zγ + Du
(13)
Analysis of Poverty Data in Bengkulu City by Small Area Estimation using Penalized Splines Regression
255

Parameter estimator
β
can be obtained by
maximizing the likelihood function so obtained:
ˆ
-1
T -1 T -1
β = X V X X V Y
(14)
Where
TT
γ u e
V = Z Z +D D
is the
variance covariance matrix of Y.
Best predictor for parameters
and
u
obtained by
minimizing MSE from
and
u
. Thus, the GREG
(Generalized Regression) estimator is obtained
dan
u
as follows:
1
ˆ
ˆ
T
Z V Y Xβ
(15)
1
ˆ
ˆ
T
u
u
Z V Y Xβ
(16)
3 METHODS
This study uses secondary data from the results of the
National Socio-Economic Survey (Susenas) and
Potential Villages (Podes) BPS Bengkulu Province in
2014. The object of this research is 59 villages. The
variables used in the study include: average per capita
outcome as the response variable (Y), whereas the
auxiliary variables are total of families without
electric (X
1
)
,
total of education facilities (X
2
)
,
total of
healthy facilities (X
3
)
,
total of public health insurance
receiver (Jamkesmas) (X
4
)
,
and total of the incapable
certificate (SKTM) receiver (X
5
)
.
The steps taken in this research are:
1. Exploration of relationship patterns between
response variables (Y) with each predictor
variable (X)
2. Modeling the average of per capita outcome at
the village level in Bengkulu City using the
small area estimation with Penalized spline
regression approach with steps are as follows:
a. Determine the order of polinomial, the
number of optimal knots, and optimal
smoothing parameter based on the GCV
criteria for each predictor variable.
b. Declare the pattern of a small area ( small
area ) with a penalized spline approach
c. Estimate the variance of parameters by
using REML
d. Estimate parameter model by using
Penalized spline SAE approach
e. Evaluate the model by calculating the AIC
and BIC values of the model
3. Estimating the average per capita outcome for
each village in Bengkulu City based on the
model obtained.
4 RESULTS AND DISCUSSION
The process of poverty data analysis in Bengkulu City
using small area estimation with penalized spline
regression approach is done in three stages: exploring
the correlation patterns between the response variable
and each predictor variable, modeling average per
capita outcome at the level of the village in Bengkulu
City use method small area estimation approach
penalized splines regression, and predicting the
average per capita outcome in all village non samples
in Bengkulu City based on the model obtained.
Exploration of the correlation pattern between
averages per capita outcome as a response variable
and each predictor variable is performed through a
linearity test to determine whether the predictor
variable is the linear or non-linear. Linearity test
results can be seen in Table 1.
Table 1: Test of Predictors Variable Linearity.
Variables
Significance
Conclusion
Y vs. X
1
0. 487
Not Linear
Y vs X
2
0. 750
Not Linear
Y vs X
3
0. 118
Not Linear
Y vs X
4
0. 771
Not Linear
Y vs X
5
0. 964
Not Linear
Based on Table 1, the five predictor variables
which are assumed affecting the poverty in Kota
Bengkulu have unknown form, random and irregular
regression curves, and all predictor variables have
nonlinear relationship patterns to response variable.
Consequently, the five predictor variables can be used
for formatting the model of average per capita
outcome in Bengkulu City using small area
estimation with Penalized spline regression approach.
Formation of small area estimation model with
Penalized spline regression approach is done by
determining the number of knots optimal and optimal
smoothing parameters based on minimum GCV value
at the Equation (9). Then, they are used to estimate
the model parameters SAE Penalized spline
regression approach. Based on the results obtained by
the number of knots and smooth Parameter optimum
for all 5 predictors as follows:
ICMIs 2018 - International Conference on Mathematics and Islam
256

Table 2: Number of Knots and Optimal Smoothing Parameters based on GCV Criteria.
Predictor
Variable
Order
Number of
Knots
Knot Point
Smoothing
Parameters
GCV
X
1
1
1
16.5
10000
228189135159
X
2
1
5
2.83; 5.6 7; 8.5; 11.3 3;
17.17
7
214527637977
X
3
1
1
9.5
88
214467526054
X
4
1
2
217.33; 603.33
10000
229155102983
X
5
1
1
170.5
10000
224994696041
Based on Table 2, the optimum finishing
parameter with minimum GCV is found in the 1st
order spline function or referred to as the linear
penalized spline model. It can be concluded that the
model of the small area estimation with Penalized
spline regression approach used to model poverty
based on average per capita outcome in Bengkulu
City is obtained from a linear spline penalized model
with a maximum of five knots .
After determined the location of the knot point
and penalized spline model with optimum finishing
parameters, the next step is to estimate the model
parameters consisting of fixed impact parameters and
random effects. Estimate of fixed influence
by
maximizing the likelihood function or its log
likelihood, and searching
ˆ
and
ˆ
u
which is the
GREG (Generalized Regression) of γ and u as a
random influence. The predicted value
for SAE
model with linear spline penalized with maximum
five knot point can be seen on Table 3.
Table 3: Fixed influence estimator.
Parameter
Estimator
0
1159578,6
1
-644,5
2
2012,5
3
6589,4
4
-121.9
5
-1694,1
So, obtained model to estimate the average per
capita outcome in Bengkulu City at the village level
as follows:
1 2 3 4 5
1 1 1 1
11 1 21 2 22 2 23 5
1 1 1 1
24 2 25 2 31 3 41 4
11
42 4 51 5
1159578,6 664,5 2012,5 6589,5 121,9 1694,1
16,5 2,83 5,67 8,5
11,33 17,17 9,5 217,33
603,33 170,5 u
X X X X X
X X X X
X
Y
X X X
XX
(17)
Which
ij
and
u
is a random effect factor with value
estimator
ˆ
ij
depending on the knot point and
ˆ
u
depending on each area. The model of Equation (17)
is a linear spline penalized model with a maximum of
five knot points in the predictor variable
2
X
. The
model of equation (17) shows that there are
differences in outcomes for each village in Bengkulu
City. This is because the value of per capita outcome
depends on the predictor variables for each village.
After making estimation model parameters with
penalized spline regression approach, the next step is
descriptive statistical analysis. The statistical result of
estimation of average per capita outcome in Bengkulu
City can be seen in Table 4.
Table 4: Comparison of Estimation of average of Outcome
per kapita Statistics in Bengkulu City.
Statistics
Outcome per
kapita (Rp)
Estimation of
Per Capita
Outcome (Rp)
Median
1.009.777,60
1.009.817,20
1st quartile
753.526,10
753.527,25
The3rd
quartile
1.244.054,30
1.244.188,15
Minimum
439.827,49
439.830,40
Maximum
3.115.622,06
3.115.614,20
Based on Table 4, the estimation of average per
capita outcome at the village level in Bengkulu City
2014 using small area estimation method with
penalized spline regression approach has a mean
value of Rp.1.009.817,20. Approximately 75% of
urban villages in Kota Bengkulu have an average per
capita outcome of Rp 1.244.188.15 and 25% of Rp
753 .527,25. The average per capita outcome high is
located in the Dahri Gardens Village Rp. 3.
115.614,20 and the lowest outcome from the Padang
Nangka Village that is Rp 439.830,40 .
Comparison of observed data and the results of an
estimator penalized spline against average per capita
outcome in each village in Bengkulu City can be seen
Analysis of Poverty Data in Bengkulu City by Small Area Estimation using Penalized Splines Regression
257
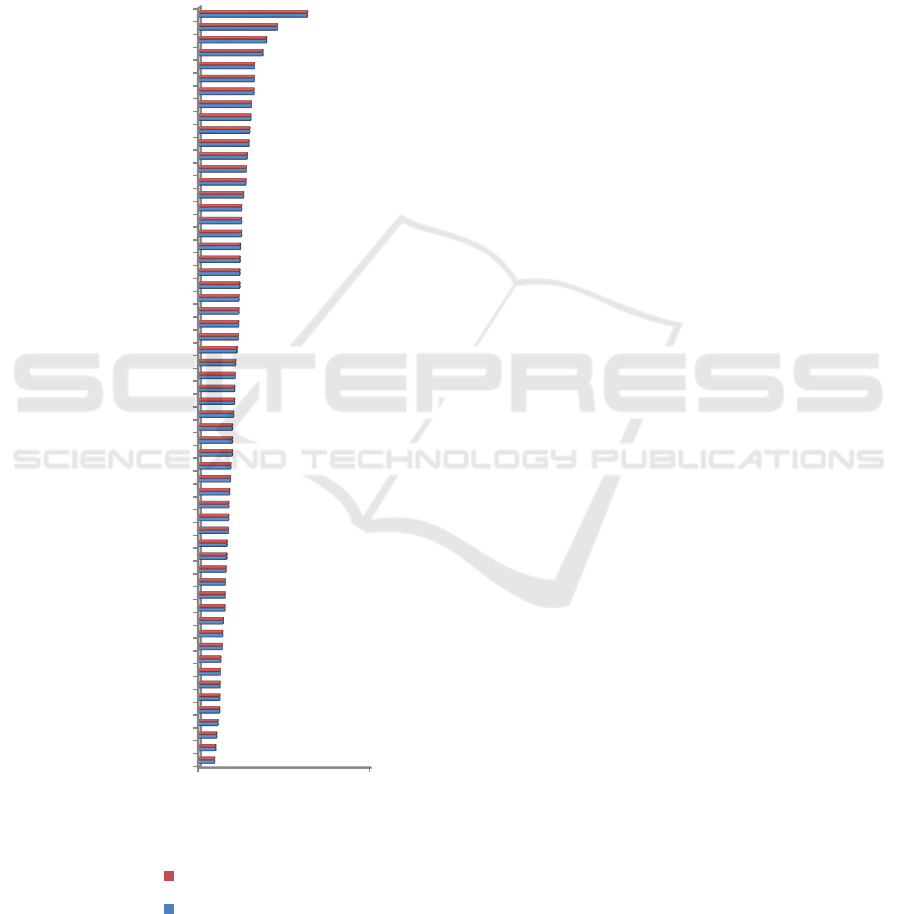
in Figure 1. From Fig 1, the results of the estimation
using a model of the small area estimation Penalized
spline regression approach has trend equal to the
observed data. The result model has a good
flexibility, can be seen from the plot of the alleged
results that can follow the distribution pattern of
observation data.
Figure 1: Comparison of Observation Data with Penalized
Spline Approach.
5 CONCLUSIONS
Small area estimation with penalized spline approach
can be used to analyze poverty data based on the
average estimate of per capita expenditure at the
village level in Bengkulu City. The estimation result
using small area estimation model with penalized
spline regression approach has trend which equals to
the observed data. The result model has a good
flexibility, can be seen from the plot of the alleged
results that can follow the distribution pattern of
observation data.
The results of the estimation of the average per
capita outcome at the level of village in Bengkulu
city year 2014 using the method Small Area
Estimation with Regal Penalized spline approach has
a mean value of Rp.1. 009.817,20. Approximately
75% of urban villages in Kota Bengkulu have an
average per capita outcome about Rp 1.244.188.15
and the twenty-five percent of urban villages in Kota
Bengkulu have an average per capita outcome about
Rp 753.527.25. The high average per capita outcome
is in the Kebun Dahri Village Rp. 3.115.614,20 and
the lowest outcome from the Padang Nangka Village
that is Rp 439.830.40 .
ACKNOWLEDGMENT
Thanks to the Directorate of Research and
Community Service, the Directorate General for
Research and Development of Kemenristekdikti who
has funded this research and the Institute for Research
and Community Service of Bengkulu University as a
research organizing institution.
REFERENCES
Badan Pusat Statistika Provinsi Bengkulu, 2018, Berita
Resmi Statistik - Profil Kemiskinan di Provinsi
Bengkulu September 2017, No. 06/01/17/Th. XII, 2
Januari 2018.
Badan Pusat Statistika, 2012, Data Strategis BPS, Katalog
BPS 1103003: No. 03220.1202, ISSN. 2087-2011.
Baskara, Z. W., 2014, Pendugaan Area Kecil Menggunakan
Pendekatan Penalized Spline. (Thesis), Institut
Teknologi Sepuluh Nopember, Surabaya.
Eubank, R. L., 1999, Nonparametric Regression and Spline
Smoothing, 2nd edition, Marcel Dekker, New York.
Litawati E. K., Budiantara I. N., 2013, Pendekatan Regresi
Nonparametrik Spline untuk Pemodelan Laju
Pertumbuhan Ekonomi (LPE) di Jawa Timur, Jurnal
Sains dan Seni Pomits, Vol.2, pp. 123-128.
0 5000000
PADANG NANGKA
KEBUN ROS
JALAN GEDANG
SUMUR DEWA
SUMUR MELELEH
PADANG JATI
SAWAH LEBAR…
KAMPUNG KELAWI
MUARA DUA
PEKAN SABTU
SUMBER JAYA
KAMPUNG BALI
KANDANG
MALABERO
KANDANG MAS
PONDOK BESI
LINGKAR TIMUR
LINGKAR BARAT
PENGANTUNGAN
KEBUN TEBENG
TANAH PATAH
PADANG HARAPAN
BENTIRING
KEBUN KELING
PANORAMA
SIDO MULYO
KEBUN BELER
DUSUN BESAR
ANGGUT ATAS
KEBUN DAHRI
Y Estimate
Y Observation
ICMIs 2018 - International Conference on Mathematics and Islam
258

Opsomer, D. J., Claeskens, G., Ranalli, M. G., Kauermann,
G., Breidt, F. J., 2008, Non-Parametric Small Area
Estimation using Penalized Spline Regression, Royal
Statistical Society Journal, Vol.70, No.1, 265–286.
Prasad, N. G. N., Rao, J. N. K., 1990, The Estimation of
The Mean Squared Error of The Small Area Estimators,
Journal of American Statistical Association, 85, pp.
163-171.
Rao, J. N. K., 2003, Small Area Estimation, London: Wiley.
Ruppert, D., 2002, Selecting the Number of Knots for
Penalized Spline, Journal of Computational and
Graphical Statistics, Vol. 11, pp. 735-757
Ruppert, D., Wand, M. P., Carrol, R. J., 2003,
Semiparametric Regression, Cambride University
Press, New York.
Salvati, N., Chandra, H., Ranalli, M. G., Chambers, R.,
2008, Small Area Estimation Using a Nonparametric
Model Based Direct Estimator, Centre for Statistical
and Survey Methodology, University of Wollongong,
Wollongong NSW.
Sriliana, I., Agustina, D., Sunandi, E., 2016, Pemetaan
Kemiskinan di Kabupaten Mukomuko Menggunakan
Small Area Estimation dengan Pendekatan Regresi
Penalized Spline, Jurnal Matematika Integratif, Vol.12,
No.2, pp. 125-133.
Sriliana, I., Sunandi, E., Rafflesia, U., 2018, The Poverty
Modeling Using Small Area Estimation with
Semiparametric P-Spline (A case study: Poverty in
Bengkulu Province). Asian Journal of Applied
Sciences, Vol. 6, Issue 4, pp. 166-174.
Analysis of Poverty Data in Bengkulu City by Small Area Estimation using Penalized Splines Regression
259
