
Brain Disease Classification using Different Wavelet Analysis for
Support Vector Machine (SVM)
Muhammad Fahrur Rozi, Dian Candra Rini Novitasari, and Putroue Keumala Intan
Department of Mathematics, State Islamic University of Sunan Ampel Surabaya
Keywords: Brain Disease, Wavelet Decomposition, Wavelet Texture Analysis, Support Vector Machine (SVM)
Abstract: The brain is one of the vital organs, some diseases attack the brains aregliomas and brain cancer. Glioma is
a type of tumor in the human brain, while brain cancer is a condition of abnormal cell growth in the brain.
The danger of these two diseases often causes death. Both diseases have different treatment methods.
Therefore, it is necessary to classify MRI images accurately. Extraction of features in images can affect the
classification process. In this study, we compare the best feature extraction methods that can be used in
brain MRI, wavelet decomposition and wavelet texture analysis. In this study, to test the accuracy of the two
methods is using an SV Mas classification method. The results show the wavelet texture analysis had better
results than using wavelet decomposition. This statement is indicated by the results of accuracy using
wavelet texture analysis of 82.14% compared to the accuracy of using wavelet decomposition of 75%.
1 INTRODUCTION
The brain is the center of the human nerves,
therefore the brain becomes one of the most
important organs for humans. If the brain has a
disease, then it will be very dangerous and often lead
to death. Some diseases that often attack the brain
such as glioma and brain cancer. Cancer appears
from the growth of abnormal cells in a part of the
body. If abnormal cell growth is not treated
immediately, cancer cells will attack the surrounding
tissues (Jong 2005). Whereas glioma is one type of
brain tumor that most often attack humans.
Approximately 13,000 cases of death each year are
due to glioma in the brain (de Rooij et al. 2016).
Most people with new brain disease realize it after
entering an advanced stage. Treatment of brain
cancer and glioma is very different; therefore, the
right classification is needed to take the most correct
action.
Using an increasingly advanced technological
development, classification and diagnosis of brain
diseases can be performed using numerical
calculations. Numerical calculations are performed
by taking an existing MRI image value. Previous
research has performed accuracy testing in the use of
MRI images taken from prostate cancer photography
(Pokorny et al. 2014). Through an existing MRI
image, you can take the feature to be detected.
Feature extraction of MRI images can be performed
using several different methods. in previous
research, feature extraction using wavelets for iris
image matching(Birgale and Kokare 2009).
Wavelets are often used to perform feature
extraction because wavelets are a process that can
feature extraction without removing the essential
elements present in an image.
Previous research of wavelet results was used to
perform feature extraction on mammogram
data(Ferreira and Borges 2003). The two studies
took the wavelet results in the wavelet
decomposition image as a feature extraction process.
In another research, the wavelet is used as a texture
analysis of an image to perform a breast tumor
diagnosis(Chen et al. 2002). Texture analysis using
wavelets is also used to perform knee osteoarthritis
detection(Riad et al. 2018). From some of these
studies, identification of images using wavelet
decomposition or texture analysis using wavelets.
Both uses of the wavelet have results for
classification of the tested image.
Previous studies of classification were performed
using the Support Vector Machine (SVM) as a
method of identifying the type of cancer(Wang and
Cai 2018). Classification using the Support Vector
460
Rozi, M., Novitasari, D. and Intan, P.
Brain Disease Classification using Different Wavelet Analysis for Support Vector Machine (SVM).
DOI: 10.5220/0008523704600465
In Proceedings of the International Conference on Mathematics and Islam (ICMIs 2018), pages 460-465
ISBN: 978-989-758-407-7
Copyright
c
2020 by SCITEPRESS – Science and Technology Publications, Lda. All rights reserved

Machine (SVM) is also used to classify breast
cancer(Lo and Wang 2012). From several previous
studies, classification of images of brain disease can
use Support Vector Machine (SVM).
Looking at some of the existing research and
problems, this study aims to determine the best
feature extraction method for brain disease
classification using the Support Vector Machine
(SVM) as a method of classifying. In this research,
the feature extraction method to be compared is the
decomposition of the wavelet transform with
wavelet analysis transformation. The results of this
study are expected to determine the best feature
extraction method.
2 LITERATURE REVIEW
2.1 Brain Disease
Brain disease is a disorder or abnormality that
occurs in the brain. Abnormalities that occur can be
an increase in the volume of brain that is not
accompanied by skull bone growth, an unfair the
growth of cells in the brain, etc. People affected by
brain disease, generally experiencing sleep
disorders. in previous research states that people
aged about 65 years take a risk for brain diseases
than people under age(Nadesul 2011). Some
diseases that attack the brain include brain cancer,
glioma, or Alzheimer's.
2.2 Magnetic Resonance Imaging
(MRI)
Magnetic resonance imaging (MRI) is one of the
shooting techniques that uses magnetic resonance of
a hydrogen atom. The magnetic field used for
shooting magnitude between 0.064 to 1.5
Tesla(Marinus T. Vlaardingerbroek 2013).
2.3 Median Filter
The Median Filter is a method used to remove pixels
that remove noise in the image. Noise is a pixel in
the image that can interfere in the process of
identifying images. Using the median filter, the
resulting image will leave the image actually
detected, uninterrupted by the noise in the
image(Shih 2010).
2.4 Adaptive Histogram Equalization
(AHE)
Adaptive histogram equalization is one method used
to make improvements pixels by correcting the point
on the image. Improvements made by leveling the
spread of intensity values in an image(S Jayaraman,
S Esakkirajan 2009). Through the AHE process, it
can improve contrast and clarify an image. to
calculate and do AHE is used Equation 1, and
Equation 2.
Gray level in the picture
Number of pixels in
Normalization of the image histogram
Renewal of pixel values
2.5 Structuring Element (SE)
Structuring Element (SE) is a pixel arrangement in
the drawing, with the center setting being in the
center of the structure of the created element. The
arrangement of elements is usually performed to
perform morphological operations on the image. the
arrangement of elements in the image can be used in
dilation or erosion processes. Dilation process is a
process of adding pixels to an already formed area
with elemental structures, whereas erosion is the
opposite of a dilation process(Shih 2010). The
dilation and erosion process can be performed using
Equation 3 and Equation 4 respectively.
(3)
(4)
The morphological operation process can combine
the erosion process then continued with the dilation
process which can be called by opening process. The
opening process can be expressed by using the
functional composition of Equation 3 and Equation
4, so obtained as in the following Equation 5.
(5)
(1)
(2)
Brain Disease Classification using Different Wavelet Analysis for Support Vector Machine (SVM)
461
2.6 Discrete Wavelet Transform(DWT)
Discrete Wavelet Transform (DWT) is a method
often used to reduce a picture. The level of reduction
performed depends on the energy contained and the
transformation performed. Through the wavelet, the
image transformation will be identified between the
intense or not. The results of the identification will
get the reduced image without losing the visual
quality of the image (Breckon 2011).
DWT process, the image will be divided into
two: High-pass initialized with g [n], and low-pass is
initialized with h [n]. In image data, DWT will
reduce twice, DWT to row, and will be continued
with DWT to the column. Since the DWT process
happens twice, the image will be generated from one
DWT level of 4 sub-bands. The four sub-bands
include Low-Low (LL) which has lower resolution,
Low-High (Vertical), High-Low (Horizontal), High-
High (Diagonal)(Seymour 1999). The process of
forming four sub-bands will be illustrated in Figure
1.
Decomposition of Discrete Wavelet Transform
(DWT) is written in Equation 6.
(6)
With
is the mother wavelet formulated by
Equation 7.
(7)
Figure 1: Wavelet decomposition process
Each sub-band produced from the DWT process
yields a detailed coefficient (LH, HL, HH),
approximation coefficient (LL), which is formulated
by Equation 8.
(8)
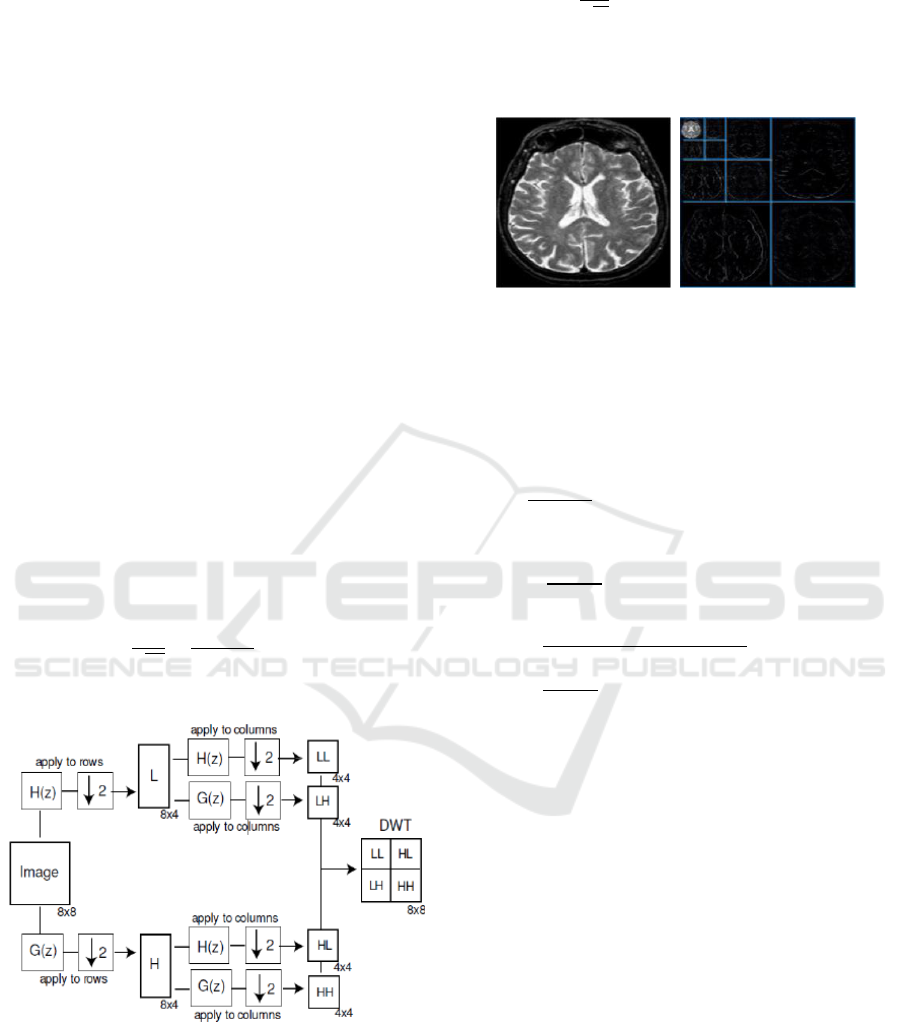
With the resulting wavelet results as in Figure 2.(El-
dahshan et al. 2014)
Figure 2 : (a) wavelet level 1, (b) wavelet level 3
From the results obtained, feature retrieval uses
wavelet texture analysis by taking energy, average
and standard deviation of the wavelet image. To take
these three values we can use Equations 9, 10, 11.
(9)
(10)
(11)
2.7 Support Vector Machine (SVM)
Support Vector Machine is one of the methods used
to perform data classification. Classification
performed by SVM, and by dividing the regional
area from a set of existing data. Sharing and
grouping data using the Support Vector Machine
(SVM) by forming a hyperplane. In order to
facilitate the establishment of a hyperplane, a kernel
is required. Using kernel function the data will be
brought to a higher dimension. In this research
kernel function used is the Gaussian function. The
result using a kernel will make it easier to form a
hyperplane(Jiawei Han and Micheline Kamber
2006).
(a)
(b)
ICMIs 2018 - International Conference on Mathematics and Islam
462
2.8 Recognition Rate
Recognition Rate is one method that can be used to
calculate the accuracy value or truth value of the
calculation of the classification results(Jiawei Han
and Micheline Kamber 2006). In the recognition rate
method, the accuracy value can be calculated
through Equation 12.P is the total predicted correctly
and N is the total of data.
.
(12)
3 METHODS
This study, to test the accuracy of the two
wavelet methods, was carried out in several stages.
The first stage is preprocessing, followed by feature
extraction using the wavelet analysis method, and
the Support Vector Machine (SVM) method is used
to classify it. then to test the level of accuracy of
different wavelet analyzes using the Recognition
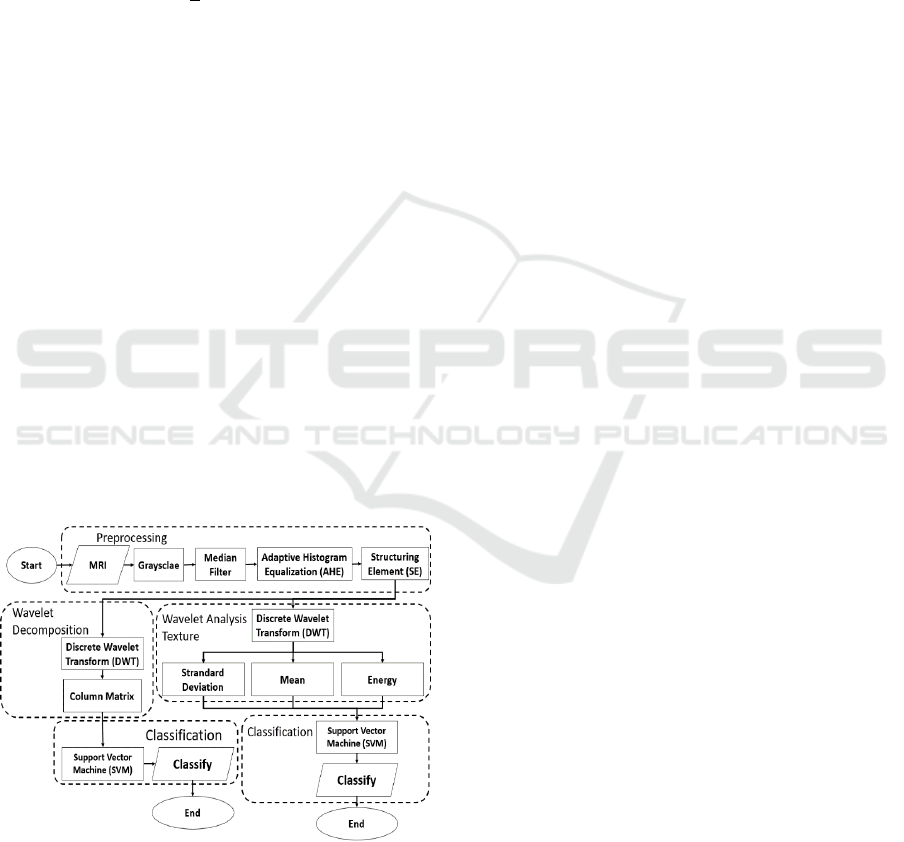
Rate method. to describe the net of the process in
this study will be illustrated in Figure 3.This
Research uses data in the form of MRI images of the
brain. MRI images of the brain used amounted to
seventy images with 42 images classified
Alzheimer's, 8 glioma clarified images, 8 classified
images of cancer, and twelve pictures classified
normal brain images. From some of the available
data, classification testing can use various kinds of
data sharing tests with training data.
Figure 3: Brain Disease Classification Design
System
Before the processing of existing MRI images,
the data repaired using preprocessing. The first step
in preprocessing is to convert an MRI image into a
grayscale image. This process is used to determine
the difference of pixel intensity in the picture.
knowing the difference in intensity they have, it is
hoped that it can be easy to find and distinguish
between brain features and brain disease.
After getting a grayscale image, the values on the
image clarified and leveled using Adaptive
Histogram Equalization (AHE). The processed
image will be clarified using Equation(1). The result
of this process the image used will produce a clearer
image, no more the difference in intensity value
which is very far from the average pixel value.
The next image will be performed by the
morphological opening operation. The opening
process used the erosion process followed by the
dilation process.in this process, the image is
processed using Equation (5). Through the opening
process, unimportant features are automatically
deleted.
The resulting image of preprocessing, then
performed feature extraction using wavelet
decomposition. The result of the opening process
will be feature extraction using Equation six as the
mother wavelet performed and using Equation six as
the wavelet decomposition process. Next, the image
is broken down into four different sub-bands using
eight. In addition to using wavelet decomposition,
feature extraction is performed using wavelet texture
analysis. Energy, average, and standard deviation
used for feature extraction in wavelet texture
analysis
From the decomposition process and texture,
analysis can be continued with the classification
process. Classification of brain disease images
performed using one of the Support Vector Machine
(SVM) methods. Using the Support Vector Machine
(SVM) the image will be classified into 3 classes,
i.e. normal brain images, brain images affected by
cancer, and images of the brain affected by glioma.
In the classification process using Support Vector
Machine (SVM) data will be divided into training
data and test data. Data sharing for training and
testing conducted three times, with 60% training,
40% testing; 75% training, 25% testing; 70%
training, 30% testing. The result of the three
experiments will be known for optimal feature
extraction for classification testing.
4 RESULTS AND DISCUSSION
The classification of disease images was
performed using wavelet feature extraction and
classification using the SVM method. Before feature
extraction, the image is repaired using
preprocessing.in the preprocessing phase the image
is repaired using several methods. improvements
made at the preprocessing stage include the
conversion of MRI images to grayscale, removal of
Brain Disease Classification using Different Wavelet Analysis for Support Vector Machine (SVM)
463

pixel noise in the image, improved contrast, and the
formation of elements using structural elements. The
results of preprocessing are shown in Figure 4.
Figure 4:(a) Cancer Brain Image, (b) Preprocessing Result
Cancer Brain Image
After the preprocessing stage, images are
processed using two different feature extractions.
The first method is wavelet decomposition. In
wavelet decomposition. in the wavelet
decomposition process, the mother wavelet used is
'Haar'the results of the wavelet decomposition
process are divided into 4 sub-bands namely vertical
decomposition, horizontal decomposition, diagonal
decomposition, and approximation. but in this study,
the Sub-band used was Low-Low or Approximation.
The results of wavelet decomposition are shown in
Figure 5
Figure 5: (a) Wavelet Decomposition Level 3, (b)
Approximation Wavelet Level 3
The second method is to use wavelet analysis
texture. Analysis texture used by taking some values
from the wavelet image. The values taken are mean,
standard deviation, and energy. These three values
represent for each image generated on the wavelet
process. The results of wavelet analysis texture
using level 3 are presented in Table 1.
The results of wavelet decomposition and
analysis texture will then be classified using SVM.
Each wavelet decomposition and wavelet analysis
texture are processed separately. After the
classification of the two different feature extractions,
resulting in accuracy presented in Table 2.
Table 1: Results of Texture Analysis in Approximation
Level 3.
Feature
Sub-band
Level
Data
1
2
.
41
42
Mean
HL
1
18,57
11,472
13,257
21,363
LH
18,57
11,472
13,257
21,363
HH
18,57
11,472
13,257
21,363
HL
2
37,139
22,945
26,515
42,727
LH
37,139
22,945
26,515
42,727
HH
37,139
22,945
26,515
42,727
HL
3
74,279
45,89
53,03
85,454
LH
74,279
45,89
53,03
85,454
HH
74,279
45,89
53,03
85,454
LL
74,279
45,89
53,03
85,454
Standart Deviation
HL
1
42,673
27,921
46,538
49,971
LH
42,673
27,921
46,538
49,971
HH
42,673
27,921
46,538
49,971
HL
2
79,488
51,411
90,395
94,088
LH
79,488
51,411
90,395
94,088
HH
79,488
51,411
90,395
94,088
HL
3
133,65
82,114
170,79
166,20
LH
133,65
82,114
170,79
166,20
HH
133,65
82,114
170,79
166,20
LL
133,65
82,114
170,79
166,20
Energy
HL
1
12,166
12,807
11,147
11,779
LH
12,166
12,807
11,15
11,779
HH
12,166
12,807
11,15
11,779
HL
2
10,63
10,827
10,3
10,473
LH
10,63
10,827
10,3
10,473
HH
10,63
10,827
10,3
10,473
HL
3
7,903
7,275
8,91
8,311
LH
7,903
7,275
8,91
8,311
HH
7,903
7,275
8,91
8,311
LL
7,903
7,275
8,914
8,311
Table 2: Results of Accuracy from Wavelet
Decomposition and Wavelet Analysis of Texture.
Data distribution
Level
Accuracy
Training
Testing
Decomp
Analysis
(b)
(a)
(a)
(b)
ICMIs 2018 - International Conference on Mathematics and Islam
464

osition
Texture
60%
40%
2
75%
78.57%
3
75%
82.14%
4
75%
75%
70%
30%
2
66.67%
71.43%
3
66.67%
66.67%
4
66.67%
66.67%
75%
25%
2
61.11%
72.22%
3
61.11%
72.22%
4
61.11%
61.11%
The results in Table 2 show the wavelet analysis
texture has the highest accuracy of 82.14%, while
wavelet decomposition has the highest accuracy
with 75% value. From the results show that the
analysis texture has better accuracy when compared
with the accuracy value generated by wavelet
decomposition. The highest accuracy of Analysis
Texture is shown when using wavelet level 3, with
60% data distribution as training data, and 40% data
testing.
5 CONCLUSIONS
The results show that wavelet texture analysis is
better than wavelet decomposition as feature
extraction method. The statement was supported by
the best accuracy results obtained wavelet texture
analysis of 82.14%, while the best accuracy
possessed by the wavelet decomposition method was
75%. Seeing some of these statements, it can be
concluded that the best feature extraction method
using the brain image is wavelet analysis texture
method.
REFERENCES
Birgale, L V, and M Kokare. 2009. “Iris Recognition
Using Discrete Wavelet Transform.” Digital Image
Processing, 2009 International Conference on
(April): 147–51.
Breckon, C. Solomon; T. 2011. “Fundamentals of Digital
Image Processing : A Practical Approach with
Examples in Matlab. John Wiley & Sons, Inc.,
2011.” John Wiley & Sons Inc.
Chen, Dar-Ren et al. 2002. “Diagnosis of Breast Tumors
with Sonographic Texture Analysis Using Wavelet
Transform and Neural Networks.” Ultrasound in
Medicine & Biology 28(10): 1301–10.
http://www.sciencedirect.com/science/article/pii/S0
301562902006208.
El-dahshan, El-sayed A, Heba M Mohsen, Kenneth
Revett, and Abdel-badeeh M Salem. 2014.
“Computer-Aided Diagnosis of Human Brain
Tumor through MRI : A Survey and a New
Algorithm.” Expert Systems with Applications
41(11): 5526–45.
http://dx.doi.org/10.1016/j.eswa.2014.01.021.
Ferreira, Cristiane Bastos Rocha, and Díbio Leandro
Borges. 2003. “Analysis of Mammogram
Classification Using a Wavelet Transform
Decomposition.” Pattern Recognition Letters 24(7):
973–82.
Jiawei Han and Micheline Kamber. 2006. Data Mining.
Second. San Francisco: Morgan Kaufmann
Publisher.
Jong, Wim de. 2005. “Kanker, Apakah Itu? Pengobatan,
Harpaan Hidup, Dan Dukungan Keluarga.”
Lo, Chien Shun, and Chuin Mu Wang. 2012. “Support
Vector Machine for Breast MR Image
Classification.” Computers and Mathematics with
Applications 64(5): 1153–62.
http://dx.doi.org/10.1016/j.camwa.2012.03.033.
Marinus T. Vlaardingerbroek, Jasques A. Boer. 2013.
Magnetic Resonance Imaging Theory and
Practice.Pdf. New York: Springer Science &
Business Media.
Nadesul, Handrawan. 2011. Menyayangi Otak.Pdf.
Jakarta: Buku Kompas.
Pokorny, Morgan R. et al. 2014. “Prospective Study of
Diagnostic Accuracy Comparing Prostate Cancer
Detection by Transrectal Ultrasound-Guided Biopsy
versus Magnetic Resonance (MR) Imaging with
Subsequent Mr-Guided Biopsy in Men without
Previous Prostate Biopsies.” European Urology
66(1): 22–29.
Riad, Rabia et al. 2018. “Texture Analysis Using Complex
Wavelet Decomposition for Knee Osteoarthritis
Detection: Data from the Osteoarthritis Initiative.”
Computers and Electrical Engineering 68(October
2017): 181–91.
de Rooij, Maarten et al. 2016. “Accuracy of Magnetic
Resonance Imaging for Local Staging of Prostate
Cancer: A Diagnostic Meta-Analysis.” European
Urology 70(2): 233–45.
http://dx.doi.org/10.1016/j.eururo.2015.07.029.
S Jayaraman, S Esakkirajan, T Veerakumar. 2009. Digital
Image Processing.Pdf. New Delhi: Tata McGraw
Hill Education Private Limited.
Seymour, Lynne. 1999. “Image Processing and Data
Analysis, The Multiscale Approach.” 94(448):
1389.
Shih, Fy. 2010. “Image Processing and Mathematical
Morphology: Fundamentals and Applications.”
Wang, Shao Peng, and Yu Dong Cai. 2018. “Identification
of the Functional Alteration Signatures across
Different Cancer Types with Support Vector
Machine and Feature Analysis.” Biochimica et
Biophysica Acta - Molecular Basis of Disease
1864(6): 2218–27.
http://dx.doi.org/10.1016/j.bbadis.2017.12.026.
Brain Disease Classification using Different Wavelet Analysis for Support Vector Machine (SVM)
465
