
Study of Shear and Pressure Flow on the Variation of Ship Hull
Shapes as One of the Biofouling Growth Factors
Muhammad Auliya Alamsyah
1
, Muhammad Luqman Hakim
1
and I Ketut Aria Pria Utama
1
1
Department of Naval Architecture, Faculty of Marine Technology, Institut Teknologi Sepuluh Nopember (ITS), Jl. Arief
Rahman Hakim, Surabaya, Indonesia
Keywords: Ship Hydrodynamics, Biofouling, Marine Growth, Pressure and Shear Force Distribution.
Abstract: In this paper, the pattern of shear force distribution and pressure on two hull models are explained using the
Computational Fluid Dynamics (CFD) numerical method. The two hull models are general cargo and barge
hulls, where they are chosen because they have a significant hull shape difference, therefore the pattern of
shear distribution and pressure force can be different. The difference in shear distribution and pressure force
is one of the growth factors of biofouling, where biofouling is a problem on ships. Biofouling causes the hull
of the ship to become rough and increase the resistance of the ship, resulting in a waste of energy and increase
the number of emissions. From the results of this study it was found that the distribution of both is almost the
same, namely the area that has the potential to be easily grown with biofouling (minimal shear force and
maximum pressure), i.e. at the end of the bow and stern end, with only slight differences in pattern and.
1 INTRODUCTION
Biofouling is the accumulation of aquatic organisms
such as microorganisms, plants, and animals that
attached to surfaces and structures that wetted into the
sea like ship hull and cause various problems (IMO,
2011). Problems arising from biofouling include:
first, ecosystem damage through the spread of
invasive species which then results in a decrease in
fishery products and the emergence of a new
epidemic of a disease; second, increasing ship
resistance which lead to increased emissions which
then have an impact on climate change and global
warming as well as economic value that is lost in
energy dissipation (Schultz, 2007; Turan, et al., 2016;
Monty, et al., 2016; Utama, et al., 2017; Hakim, et al.,
2017; Nugroho, et al., 2017; Hakim, et al., 2018).
Biofouling that attaches and grows at the hull of
the ship causes the surface of the hull to become
rough and consequently, it can increase the friction
resistance (Schultz, et al., 2011). When there is an
increase in resistance, the power requirements will
increase, from this it can be said that energy
dissipation occurs and leads to more emissions. IMO
notes that emissions generated by ships around the
world are 2.2% of total man-made emissions
worldwide in 2012 (IMO, 2015), and are predicted to
increase by 50-250 percent by 2050 (IMO, 2009).
Keeping the ship's hull clean from biofouling can
reduce emissions by up to 10% (ICCT, 2013;
Molland, et al., 2014) where this is suggested by IMO
through the Energy Efficiency Design Index (EEDI)
(IMO, 2012). For this reason, it is necessary to use an
anti-fouling system, such as the one that already
exists, with anti-fouling coating and routine cleaning
when dry docking. Unfortunately, the mechanisms of
the anti-fouling coating are to release biocide
compounds into the water, which according to
Rompay (2012), it will eventually become a new
problem for the marine environment in the future.
According to the results of an investigation and
test from Hunsucker (2014) that the growth of
biofouling on each part of the hull is not the same.
Hunsucker (2016) also conducted an experiment to
determine the effect of the hydrodynamic effect of
shear stress on biofouling growth. The effects of static
and dynamic conditions have also been observed on
water conditions (Zargiel & Swain, 2014). The effect
of ship speed on biofouling growth has also been
observed by Coutts (2010). From their explanation
that the hydrodynamic effect such as speed, shear
stress, and pressure can affect the growth of
biofouling in the hull of the ship.
Alamsyah, M., Hakim, M. and Utama, I.
Study of Shear and Pressure Flow on the Variation of Ship Hull Shapes as One of the Biofouling Growth Factors.
DOI: 10.5220/0008542900970105
In Proceedings of the 3rd International Conference on Marine Technology (SENTA 2018), pages 97-105
ISBN: 978-989-758-436-7
Copyright
c
2020 by SCITEPRESS – Science and Technology Publications, Lda. All rights reser ved
97
Based on the results of the Hunsucker (2014) and
Hunsucker (2016) research, this paper will discuss the
pattern of shear stress and pressure distribution on the
hull using numerical CFD method. As hull models,
two different types of hulls are used, namely general
cargo hull and barge hull. Both models were chosen
because they have a significantly different of hull
shape where the cargo hull has a more streamlined
form than the barge.
2 PHYSICAL COMPONENTS OF
MAIN HULL RESISTANCE
When the ship sails, it will get a drag from the fluid.
The drag component can be divided into friction
resistance, pressure resistance and residual resistance
(wave). Friction resistance is strongly influenced by
the hull roughness of the ship. While the pressure
resistance and wave resistance are influenced by the
shape of the hull of the ship. In general, the equation
is written as follows:
WVPFT
R+R+R=R
(1)
WVT
R+R=R
(2)
where R
T
, R
F
, R
VP
, R
W
, and R
V
are total resistance,
frictional resistance, viscous pressure resistance,
wave resistance, and viscous resistance, respectively,
(Molland, et al., 2011).
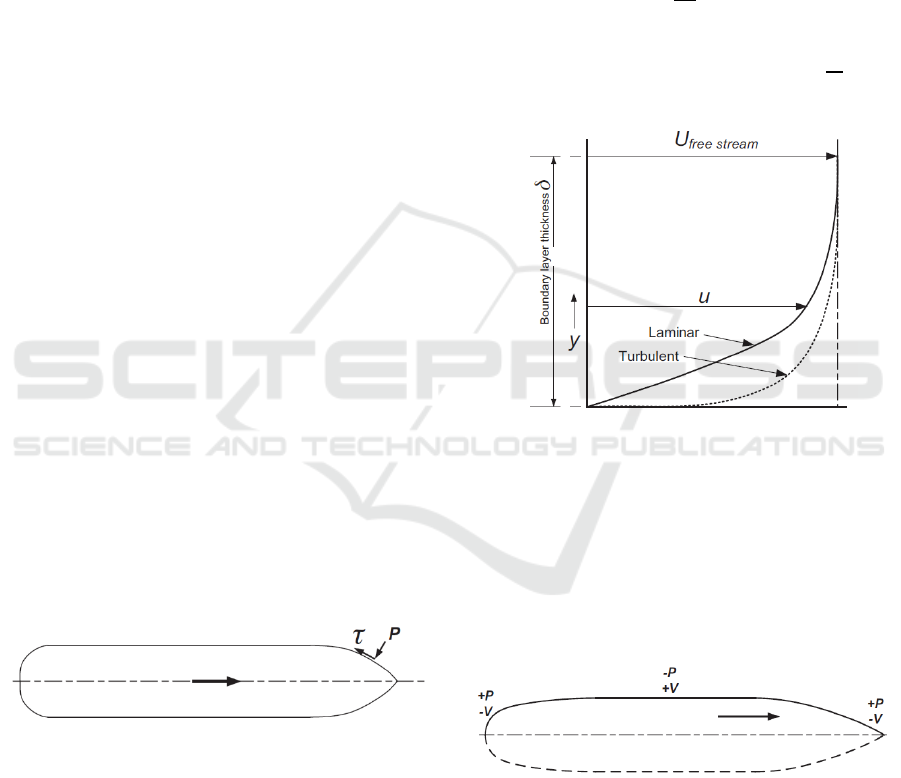
The difference for shear force and pressure can be
seen in Figure 1, where the shear force (τ) is a force
that is parallel to the wall or surface of the hull which
is affected by fluid viscosity. meanwhile the pressure
(P) is a force perpendicular to the surface of the shape
from a ship hull.
Figure 1: Frictional and pressure forces [22].
2.1 Shear Force
Friction drag is a part of the shear stress on the object
wall and above that is affected in the area of the inner
boundary layer. If the shape of the object is
dominated by line form that is parallel to the upstream
velocity, then the component of the shear force is
dominant than the force of pressure. If the direction
of the resultant of the shear force arises in the opposite
direction of the upstream velocity axis, then it
contributes to the drag force, but if it is perpendicular
then it contributes to the lift force.
Shear stress is obtained from the boundary layer
velocity profile whether it is laminar or turbulent or
transition as shown in Figure 2. From the graph of the
velocity profile, the surface shear stress can be known
by the following formula:
μ
∂u
∂
y
(3)
where μ is the fluid dynamic viscosity and
is the
velocity gradient at the surface.
Figure 2: Boundary layer velocity profiles.
2.2 Pressure Force
Pressure force is the force generated due to the
presence of fluid which is blocked by the wall of the
object in the normal direction of the area (Molland, et
al., 2011), as shown in Figure 1. While the pressure
distribution on the vessel as shown in Figure 3.
Figure 3: Pressure variations around a body of ship
(Molland, et al., 2011).
SENTA 2018 - The 3rd International Conference on Marine Technology
98

3 THE PROCESS OF ATTACHING
BIOFOULING
Biofouling is the accumulation of aquatic organisms
such as microorganisms, plants, and animals on
immersed surfaces and structures, including
microfouling and macrofouling. Microfouling is the
bacteria and diatoms and slimy substances produced,
usually referred to as slime layers. Macrofouling is a
large multicellular organism that can be seen by the
human eye such as barnacles, tapeworms, or algae
leaves (IMO, 2011). More than 4000 species of
animals and plants are recorded as biofouling
worldwide (Nair, 2013).
The process of attaching biofouling to the
substrate immersed in the aquatic environment is
explained by Nair (2013). After the structure is
immersed, a first layer is formed consisting of
bacteria, diatoms, algal spores, and detritus. The first
layer is important because it affects macrofouling
thereafter, as shown in Figure 4 (Nybakken, 1982).
Then, the bacteria develop very quickly and form an
important constituent in the first layer. The bacteria
become firmly attached, and in just one hour the cells
grow an average of 1-2 microns and continue to
divide. This causes the population to increase twice
every four hours. The bacterial colonies secrete
polysaccharides, which make the surface of the film
slimy and sticky and afterward make the algae stick.
They also ensnare larvae, change the color of the
surface, so as a place for food for macrofouling that
comes afterward.
Figure 4: The process of attaching biofouling on metals.
In the process of attaching biofouling to a surface
is influenced by many factors, so it is very difficult to
determine the exact rules that can be used to
determine where it will stick. Based on this
uncertainty, the scientists tried to use the theory of
opportunities for the biofouling attachment phase on
the surface by considering the values of pressure,
shear, and turbulence (Mullineaux & Garland, 1993).
In the attachment phase, there are two main
requirements that must be fulfilled so that the
biofouling attachment instincts can function properly.
First, environmental disturbances (shear stress and
turbulence) are low. Second, biofouling organisms
must have good mobility. The first requirement will
guide biofouling organism's instincts to select
attachment areas with minimum disturbances, and the
second requirement serves to serve the instincts to
move attached (Mullineaux & Garland, 1993).
Based on information obtained by biofouling
organism instincts, the priority will be placed on the
relatively quiet attachment area. From the explanation
above, it can be predicted that the intensity of
attachment in areas that have low hydrodynamic
intensity will have a greater chance of attachment
compared to areas that have high hydrodynamic
intensity.
In the biofouling growth phase, there are three
main factors that influence the growth process. The
three processes include the supply of food
ingredients, food filtration mechanisms and food
digestion. If the hydrodynamic conditions support the
above three processes, then the growth will take place
optimally. Distribution of food ingredients along with
other living substances will be difficult to take place
due to turbulent flow. The next factor that affects the
growth process is filtering food ingredients. If the
screening process takes place effectively, more food
will be obtained. Most biofouling organisms that live
(statically) use a filtering method to get their food.
This filter is in the form of antennas which are
equipped with fine hairs to filter the food ingredients
dissolved in the water and enter into the mouth
(Pascual, 1992).
The explanation above explains that the
hydrodynamic characteristics affect the biofouling
growth process. The hydrodynamic factors include:
patterns of the tendency to speed, pressure and
surface shear stress and turbulence.
4 MODELS
The hull models of the cargo ship and barge used for
this study were made to have the same size as
described in Table 1. From the table, it can be seen
that the value of WL Length, Breadth (B) and
Draught (T) have the same value, whereas the
different are Displacement, WSA, and Cb, where the
barge has a higher value.
Study of Shear and Pressure Flow on the Variation of Ship Hull Shapes as One of the Biofouling Growth Factors
99

Table 1: This caption has one line so it is centered.
Item Barge Cargo Units
Displacement 2569 2364 ton
WL Length 60 60 m
B 15 15 m
T 3.2 3.2 m
WSA 1187 1092 m
2
Cb 0.87 0.8 -
LCB % 48.97 51.05 %
Figure 7: Body plan of General Cargo.
Figure 8: Body plan of General Cargo.
To find out how different the hull shape of the
general cargo and barge model used in this study can
be seen in Figure 7 for the general cargo body plan
and in Figure 8 for the barge. Then the shape of the
sheer plan and half breadth plan can be seen in Figure
5 and Figure 6 respectively.
In this analysis, the roughness model of biofouling
is not carried out. The surface of the two models is
made smooth. Because the purpose of this analysis is
to compare the effects of different hull forms on shear
stress distribution and pressure force as one of the
biofouling growth factors on a ship.
5 NUMERICAL METHODS
In this analysis, the results needed are only viscous
and pressure value, so the domain and boundary
condition set applied are one fluid computation, or
without taking into account the effects of wave
resistance.
The size of the domain and boundary condition in
the numerical model of this study can be seen in
Figure 9. In the Figure 9, it can also be seen the
quality of the mesh generation used. the number of
elements in this calculation is around 6 million
elements and has met the convergence criteria. Then
the turbulence model used is k-ω-SST, with the
second order computation method and residual
targets up to 10-4.
Figure 5: Sheer plan of (A) General Cargo and (B) Barge.
Figure 6: Half breadth plan (A) General Cargo and (B) Barge.
SENTA 2018 - The 3rd International Conference on Marine Technology
100

In this numerical modeling, velocity variations
have been carried out just for 5 knots and 10 knots.
Because the author believes that the pattern of shear
stress distribution and surface pressure due to
differences in speed does not change, but what
changes is only the value. Therefore, in this
simulation, the velocity of 5 knots and 10 knots are
chosen.
6 RESULT AND DISCUSSION
6.1 Grid Sensitivity Test
To get the optimal mesh size so that the calculation
results from the model are close to the true value and
are still within computer capabilities, a grid
sensitivity test is performed. The result of the test can
be seen in Figure 10, where from the result the
number of elements that can be used in computing is
around 6 million elements because the calculation
results for the number of elements 6 million and 13
million only have a difference under 2%.
Figure 10: Result of grid sensitivity test.
6.2 Validation Study
Validation of this analysis is comparing the result
from numerical method with empirical method. The
CFD results of the two models is compared with
Holtrop [27] as empirical calculation method. Based
on the calculation of the resistance in formula 1 and
formula 2, if it is changed in the form of a coefficient
it will become:
WVT
C+C=C
(4)
Where C
T
, C
V
, and C
W
are total drag coefficients,
viscous resistance coefficients, and wave resistance
coefficients, respectively.
Table 2: Comparison of computed RV values between
numeric and empiric.
Speed 5 knots
ΔR
V
(%)
Metho
d
CFD Holtrop
R
V
R
T
C
V
C
W
R
V
Barge
13,46
6
16,65
7
3,20
0
0,51
3
14,35
6
-6%
Cargo
10,10
9
13,00
5
2,86
3
0,10
8
12,53
2
-
19%
Speed 10 knots
ΔR
V
(%)
Metho
d
CFD Holtrop
R
V
R
T
C
V
C
W
R
V
Barge
50,05
1
68,10
0
2,93
7
0,73
8
54,42
4
-8%
Cargo
37,21
6
54,47
4
2,60
1
0,54
0
45,10
9
-
17%
Figure 9: Domain computation and mesh generation.
Study of Shear and Pressure Flow on the Variation of Ship Hull Shapes as One of the Biofouling Growth Factors
101
By using numerical CFD modeling with the
method in this case, the viscous resistance (R
V
) values
for each model will be obtained for speeds of 5 knots
and 10 knots. Then the value is compared with the
results of the Holtrop empirical calculation for both
models and at the same speed. The results of the
comparison can be seen in Table 2, where the results
can be said to be quite valid.
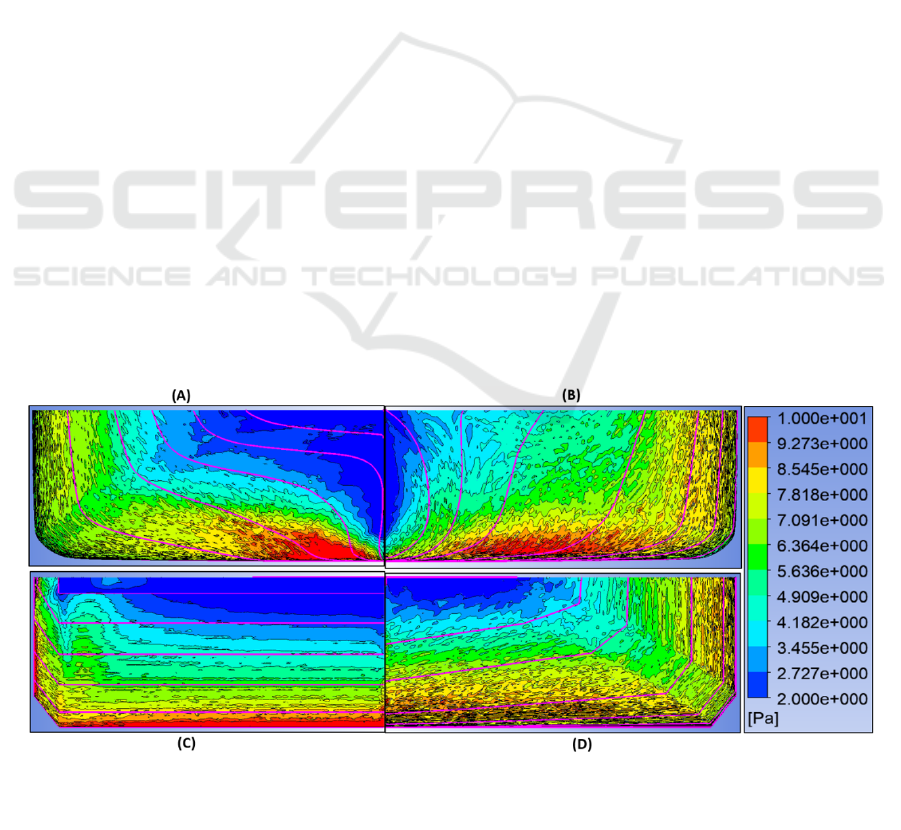
6.3 Shear Stress Distribution
In all the results plots illustrated in this paper are the
simulation results with a speed of 5 knots. The speed
of 10 knots is not displayed because the result of the
distribution pattern is the same as the result of the
speed of 5 knots, which is different only the value.
The results of the shear force distribution pattern
are shown in Figure 11 and Figure 12. The results
show that the distribution pattern on the two hull
models is different.
For the results of the general cargo, hull model
plotted on the rear and front view in Figure 11A and
B (body plan), the smallest shear force is at the front
and rear with a value of less than 2 Pa. For the front
(see Figure 11 B) it is around the bulbous bow area
slightly up with a small area. While on the afterward
(see Figure 11 A), it occurs in the stern bow area
upwards with extended area until the end. In this area,
it can be said that disruption due to shear force to
biofouling growth is minimal.
Still, with the general cargo model, the highest
shear force value occurs in the hull curve which will
lead to the propeller area and the curve after the
bulbous bow. In that area, the shear force is 5 times
higher, 10 Pa. Therefore, in this area biofouling gets
the biggest disturbance from the influence of the
shear force. For more details about the distribution of
the shear force pattern can be seen in Figure 12 A and
B as the appearance of the side and bottom view to
get a longitudinal view.
In Figures 11 C D and 12 C D, they are the shear
force distribution pattern for barge model. The
highest shear force value is at the back, which is the
meeting area between the parallel middle body and
the stern. Then at the front, there is shear force value
that is not as high as general cargo model, only with
a value of around 8 - 9 Pa but with a wider area. In
this area, biofouling growth has a higher disturbance.
Then the lowest shear force value on the barge
occurs at the end of the bow and the stern end is
almost similar to general cargo but with a slightly
wider area. In this area, biofouling receives the least
interference from the shear force effect.
6.4 Pressure Distribution
The computational results for the distribution of
pressure forces on both models can be seen in Figures
13 and 14. From the results of calculations on both
models also obtained a different pressure distribution
pattern. If shear force interferes with the biofouling
growth process, it is different from the pressure force.
The force of pressure can help biofouling stick to the
hull more easily.
The two models have almost the same distribution
pattern, which is at the fore and after ends as
described in Figure 3 above. At general cargo, the
Figure 11: Shear stress distribution: (A) back view of General Cargo, (B) front view of General Cargo, (C) back view
of Barge, and (D) front view of Barge
SENTA 2018 - The 3rd International Conference on Marine Technology
102
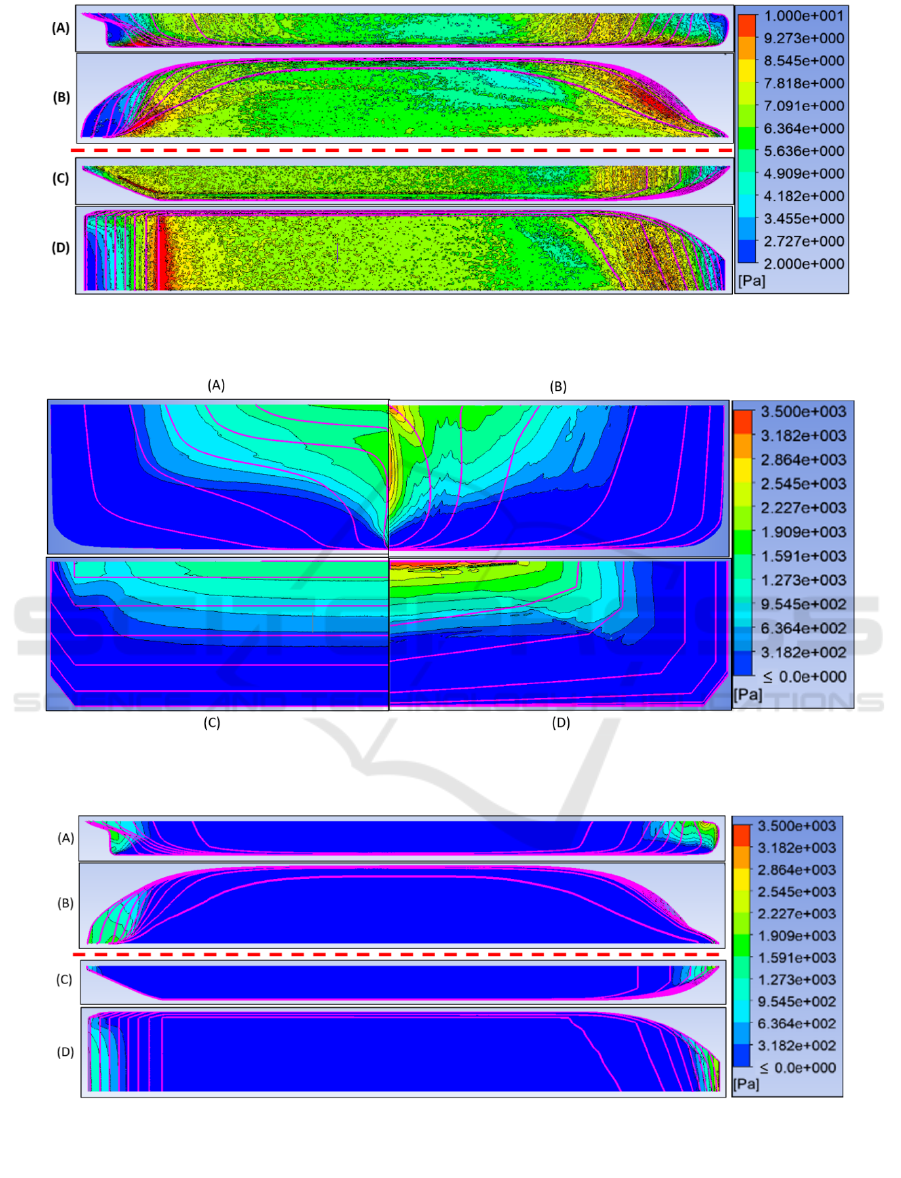
highest pressure is at the end of the bulbous bow and
stern after the propeller, while the barge also occurs
at the end of the bow and the stern area. These areas
are areas where the shear force value is weak, so
biofouling can be found more often in this area.
Figure 12: Shear stress distribution: (A) side view of General Cargo, (B) bottom view of General Cargo, (C)
side view of Barge, and (D) bottom view of Barge.
Figure 13: Pressure force distribution: (A) back view of General Cargo, (B) front view of General Cargo, (C) bac
k
view of Barge, and (D) front view of Barge
Figure 14: Pressure force distribution: (A) side view of General Cargo, (B) bottom view of General Cargo, (C)
side view of Barge, and (D) bottom view of Barge.
Study of Shear and Pressure Flow on the Variation of Ship Hull Shapes as One of the Biofouling Growth Factors
103

Then for at the middle hull, both have pressure
with very small to negative values as shown in Figure
14 in color of blue. In this area, biofouling is more
difficult to stick to than the front and rear areas of the
stomach.
7 CONCLUSIONS
One way to reduce emissions on ships is to maintain
the hull clean of biofouling by using an anti-fouling
system or cleaning when docking. Biofouling can
grow in the hull of the ship with various factors, one
of which is the hydrodynamic characteristics of water
flow such as shear and pressure force. On ships, the
distribution of shear and pressure forces are
influenced by the hull shape of the ship itself.
From the results of this study, the distribution of
shear and pressure forces was obtained for general
cargo and barge hulls. The distribution of both is
almost the same, namely an area that has the potential
to be easily grown with biofouling (minimal shear
force and maximum pressure), ie at the end of the arc
and the tip of the stern, with only slight differences in
patterns, values, and extent. Subsequent suggestions
need to be taken into account other influential factors
such as speed, type, and quality of anti-fouling,
operating patterns, and other hull forms.
REFERENCES
Coutts, A. D. et al., 2010. Effect of Vessel Voyage Speed
on Survival of Biofouling Organisms: Implications for
Translocation of Non-indigenous Marine Species.
Biofouling, Volume 26 No. 1, pp. 1-13.
Hakim, M. L. et al., 2018. Assessment of Drag Penalty
Resulting from the Roughness of Freshly Cleaned and
Painted Ship-Hull Using Computational Fluid
Dynamics. 11th International Conference on Marine
Technology (UTM). Kuala Lumpur.
Hakim, M. L. et al., 2018. Investigation of Fuel
Consumption on an Operating Ship Due to Biofouling
Growth and Quality of Anti-Fouling Coating. The First
Maluku International Conference on Marine Science
and Technology (Unpatti). Ambon.
Hakim, M. L. et al., 2017.. Review of Correlation between
Marine Fouling and Fuel Consumption on A Ship.
SENTA: 17th Conference on Marine Technology
(ITS). Surabaya.
Holtrop, J. & Mennen, G., 1978. A Statistical Power
Prediction Method. International Shipbuilding
Progress, Volume 25.
Hunsucker, J. T., Hunsucker, K. Z., Gardner, H. & Swain,
G., 2016. Influence of Hydrodynamic Stress on the
Frictional Drag of Biofouling. Biofouling, Volume 32
No. 10, pp. 1209-1221.
Hunsucker, K. Z., Kokaa, A., Lundb, G. & Swain, G., 2014.
Diatom Community Structure on In-service Sruise Ship
Hulls. Biofouling, Volume 30 No. 9, p. 1133–1140.
ICCT, 2013. Long-Term Potential for Increased Shipping
Efficiency Through the Adoption of Industry-Leading
Practices. International Council on Clean
Transportation. Washington.
IMO, 2009. Second IMO GHG Study 2009. International
Maritime Organization. London.
IMO, 2011. Guidelines for The Control and Management
of Ships Biofouling, Resolution MEPC.207 (62).
s.l.:Marine Environment Protection Committee.
London.
IMO, 2012. Guidelines on Survey and Certification of the
Energy Efficiency Design Index (EEDI) MEPC 214
(63),. s.l.:Marine Environment Protection Committee.
London.
IMO, 2012. Guidelines on the Method of Calculation of the
Attained Energy Efficiency Design Index (EEDI) for
new ships MEPC.212 (63). s.l.:Marine Environment
Protection Committee. London.
IMO, 2015. Third IMO GHG Study 2014. International
Maritime Organization. London.
Molland, A., Turnock, S. & Hudson, D., 2011. Ship
Resistance and Propulsion. Cambridge University
Press. Cambridge.
Molland, A., Turnock, S., Hudson, D. & Utama, I., 2014.
Reducing Ship Emissions: A Review of Potential
Practical Improvements in The Propulsive Efficiency of
Future. International Journal of Maritime Engineering,
Volume 156 A2, pp. 175-188.
Monty, J. P. et al., 2016. An Assessment of the Ship Drag
Penalty Arising from Light Calcareous Tubeworm
Fouling. Biofouling, Volume 32 (4), pp. 451-464.
Mullineaux, S. Y. & Garland, E. D., 1993. Larva
Recruitment in Response to Manipulated Filed Flows.
Marine Biology, Volume 116.
Nair, N. U., 2013. Marine Fouling and Control Measures
Cochin: Former Scientist Emeritus (ICAR). s.l.:Central
Institute of Fisheries Technology. Kochi, India.
Nugroho, B. et al., 2017. In-situ Turbulent Boundary Layer
Measurements over Freshly Cleaned Ship-Hull under
Steady Cruising. International Conference on Ship and
Offshore Technology (RINA). Jakarta.
Nybakken, J., 1982. Biologi Laut : Suatu Pendekatan
Ekologis. Gramedia. Jakarta.
Pascual, C., 1992. Small Scale Turbulance on Zooplankton
Metabolism Affect Torbulence on Heartbeat Rates
Planktonic Crustaccean. Marine Biology, Volume 124.
Rompay, B. V., 2012. Surface Treated Composites White
Book. Tahoka Press. Clearwater, FL.
Schultz, M. P., 2007. Effects of Coating Roughness and
Biofouling on Ship Resistance and Powering.
Biofouling, Volume 23 (5), pp. 331-341.
Schultz, M. P., Bendick, J. A., Holm, E. R. & Hertel, W.
M., 2011. Economic Impact of Biofouling on A Naval
Surface Ship. Biofouling, Volume 27, pp. 87-89.
SENTA 2018 - The 3rd International Conference on Marine Technology
104

Turan, O., Demirel, Y. K., Day, S. & Tezdogan, T., 2016.
Experimental Determination of Added Hydrodynamic
Resistance Caused by Marine Biofouling on Ships.
Transportation Research Procedia, Volume 14, pp.
1649-1658.
Utama, I. K. A. P. et al., 2017. A Study of Skin Friction-
Drag from Realistic Roughness of a Freshly Cleaned
and Painted Ship Hull. International Symposium on
Marine Engineering (ISME). Tokyo.
Zargiel, K. A. & Swain, G. W., 2014. Static vs Dynamic
Settlement and Adhesion of Diatoms to Ship Hull
Coatings. Biofouling, Volume 30 No. 1, pp. 115-129.
Study of Shear and Pressure Flow on the Variation of Ship Hull Shapes as One of the Biofouling Growth Factors
105
