
Dredging Volume Analysis using Multi Beam Echo Sounder Data
Khomsin
1
, Eko Yuli Handoko
1
, Danar Guruh Pratomo
1
and Irfan Maulana Yusuf
1
1
Geomatics Engineering Department, Institut Teknologi Sepuluh Nopember, Surabaya, Indonesia
Keywords: SWAC, MBES, cross section, volume, dredging
Abstract: The Tanjung Perak port passed through by Surabaya West Access Channel (SWAC) has an important role
as driving of economic growth in the field of sea transport. The rivers that flow to SWAC has bringing large
of sediments that caused of shallow on that area, so that influence the effectiveness of SWAC. Hence
maintenance dredging port water is needed to maintain the ideal depth. This research will conduct the
calculation of dredging volume with data derived from Multi Beam Echo Sounder (MBES) survey in
SWAC using Hypack and AutoCAD Civil 3D software. The results of each software will be analysed to see
which software will be used in doing dredging in the sea correctly. The volume calculation method used is
cross section method (average end area). The MBES data processing produces bathymetry map that
indicates the study location with depth less than -13 meter with along channel 17.6 km. Total value volume
obtained from calculation AutoCAD Civil 3D is 5,921,745 m³ and Hypack is 5,952,881.83 m³. These values
compared to the composite method, the volume difference of Autodesk Civil 3D is only 0.67% and Hypack
is 1.2%. Because of the small difference (0.5%), it means that the Autodesk Civil 3D and Hypack software
have the same volume dredging at SWAC.
1 INTRODUCTION
Referring to United Nations Convention on the Law
of the Sea (UNCLOS) 1983, Indonesia is one of the
biggest archipelagic country in the world (Windari,
2009). This is because Indonesia has 17,504 islands
and 15,056 islands that have been registered in the
United Nations and the ratio between its land and
ocean in Indonesia is 1:2 (UN, 2017). Therefore sea
plays an important role in Indonesian economic
activities. The sea has a role as communication lane
means that the use of the sea for the traffic interest
of inter-island, inter-country and inter-continental
shipping traffic, both for passengers and goods
transportation.
Surabaya is the second largest city after Jakarta
in Indonesia. Therefore, the economic activities in
East Java and Eastern Indonesia through the
Surabaya port, namely Tanjung Perak Port. Tanjung
Perak Port is the second largest port after Tanjung
Priok in Jakarta. Tanjung Perak Port has a strategic
role to support the traffic activities of sea
transportation and as a driver of economic growth in
East Java and the Eastern Indonesia.
Determination of shipping channels in terms of
navigational security aspects is intended to prevent
channel from sinking during low elevation tides,
growing shallows or corals, and unsafe depth of
seabed to draft ships. Other than that the straits are
too narrow, waters that have currents or waves that
make it difficult for boat movements and other
navigation barriers (Parwata, 2011). Because of the
large port, many large ships with drafts of more than
10 m enter the Tanjung Perak port. For example, the
North Jamrud port is one of the busiest of quay in
the Tanjung Perak port. Recorded in 2011 there were
14,117 ships anchored in North Jamrud, while in
2012 it increased to 14,773 ships (Buana, 2014). It
had to go through the Surabaya West Access
Channel (SWAC) before entering to port.
Rivers that lead to the SWAC carry a large
amount of sediment which results in siltation, which
can affect the effectiveness of the SWAC (Wahyuni,
et al., 2013). To solve the sedimentation problem
and maintain service quality, it is necessary to pay
attention to the condition of the shipping channel as
the ship's entrance to the port area and the direction
of the ship entering the port waters.
The depth of the shipping path that is not in
accordance with the draft of the ship can cause the
ship to run aground and endanger the safety of
shipping. Therefore, it is necessary to carry out port
Khomsin, ., Handoko, E., Pratomo, D. and Yusuf, I.
Dredging Volume Analysis using Multi Beam Echo Sounder Data.
DOI: 10.5220/0008550500270031
In Proceedings of the 3rd International Conference on Marine Technology (SENTA 2018), pages 27-31
ISBN: 978-989-758-436-7
Copyright
c
2020 by SCITEPRESS – Science and Technology Publications, Lda. All rights reserved
27
dredging maintenance to maintain the ideal depth
according to the dimensions and size of the vessel.
This study will calculate the volume of dredging
with data from the multibeam echosounder survey in
the SWAC using Hypack and AutoCAD Civil 3D
software. Then their volume compared each other
and where is suitable for use in the dredging work at
sea.
2 METHOD
2.1 Data and Research Area
The research location area is in the Surabaya West
Access Channel – Tanjung Perak Port, Surabaya,
which is geographically located between 6˚50'00 " S
- 7˚00'00" S and 112˚40'00 " E - 112˚45'00" E. This
location can be seen in the Figure 1 below.
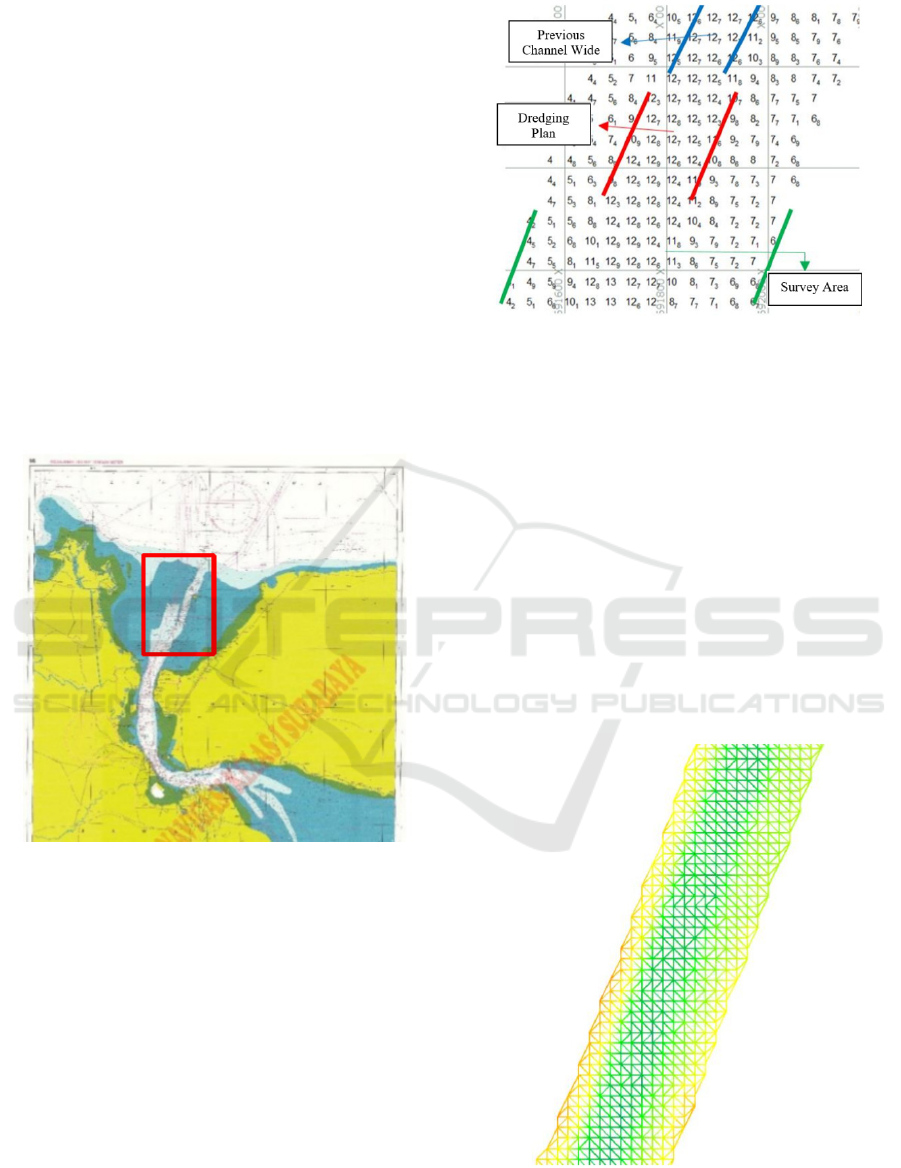
Figure 1: Research location (Disnav, 2016).
The data used in this research is the ASCII Multi
Beam Echo Sounder (MBES) (Figure 2) data in
Surabaya West Access Channel (SWAC) in June
2017 obtained from the Dinas Navigation Surabaya,
East Java, Indonesia.
Figure 2: Spot depth of MBES data.
2.2 Method
The first step is to determine the boundary area to be
calculated by dredging volume provided the depth is
less than -13 meters. After that volume calculation
manually used the cross section and composite
method which will be used as a reference volume
(true volume) as a comparison of the volume
calculation results from the AutoCAD Civil 3D and
Hypack software. Then the ASCII Multi Beam Echo
Sounder data are plotted to the layout drawing. The
next step is to form 3-Dimensional model using the
principle of Triangular Irregular Network (TIN) to
obtain a Digital Terrain Model (DTM) surface
(Figure 3 and Figure 4).
Figure 3: Triangular Irregular Network in SWAC
(Autodesk, 21014).
SENTA 2018 - The 3rd International Conference on Marine Technology
28
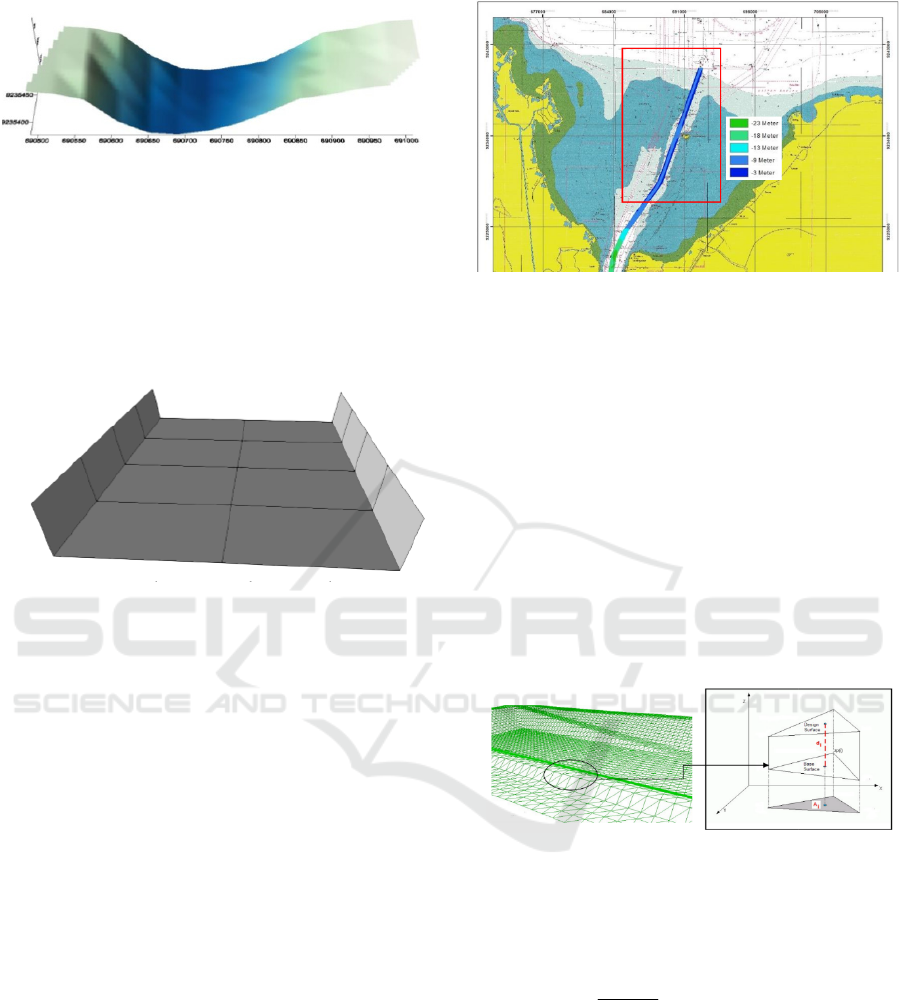
Figure 4: An example of 3-D Model at one cross station.
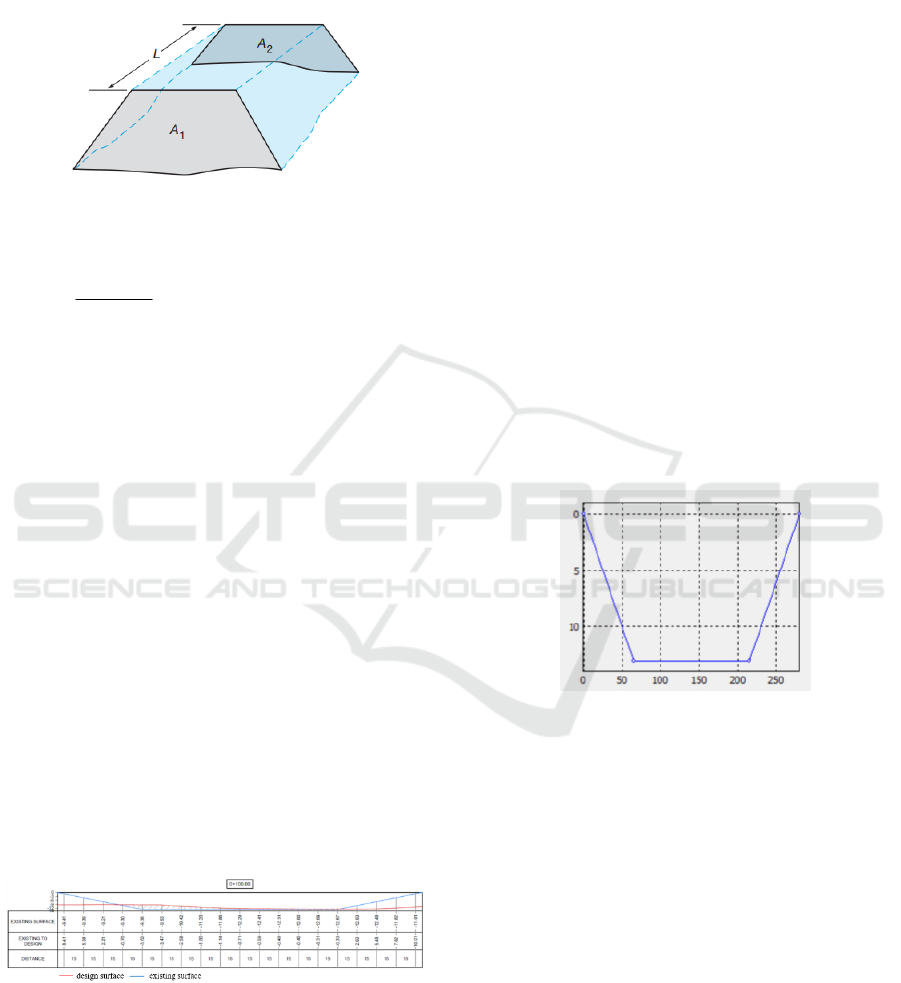
This surface will be used as a reference in
calculating the dredging volume. The design of
dredging is formed in each software with the same
design specifications which has a slope of 1:5
(Figure 5).
Figure 5: Template section as depth referenced (design
surface of dredging) (Hypack, 2016).
Then, a cross section should be formed in each
50 m and calculate volume between one section and
another section using Average End Area. Finally,
analysed the volume obtained from AutoCad Civil
3D and Hypack software.
3 RESULT AND DISCUSSION
3.1 SWAC Bathymetric Map
The SWAC bathymetric map formed from MBES
data shows that the shallowest depth is -4 m and the
deepest depth is -13 m. This map (Figure 6) shows
that the waters around this SWAC are quite shallow.
Therefore, to avoid ships entering the Tanjung Perak
port through SWAC, routine maintenance of the
SWAC is required by dredging the sedimentation
that occurs.
Figure 6: Disnav SWAC Bathymetric Map modification.
3.2 Volume Calculation as Referenced
by Composite and Cross Section
Manually Method
In this case, the volumes are used as references to
compare the volume between the Autodesk Civil 3D
and Hypack software are composite method and
cross section method manually. Composite method
is based on surface 3D models which derived from
Triangulated Irregular Network (TIN) with two
surfaces namely base surface (design surface) and
existing surface (Labant, et al., 2013). The
composite method can be seen in Fugure 7 and the
formula can be seen in equation 1.
Figure 7. Illustration of Triangular Irregular Network
(Labant, 2013).
3
3
1
i
i
i
H
PV (1)
where V is volume, Hi is elevation and P is area of
triangle prism.
While cross section method manually it means
that calculate volume between a station and another
station consequentially (Figure 7). Figure 8
illustrates the concept of computing volumes by the
average-end area method (cross section method). In
the figure, A1 and A2 are end areas at two stations
Dredging Volume Analysis using Multi Beam Echo Sounder Data
29
separated by a horizontal distance L. The volume
between the two stations is equal to the average of
the end areas multiplied by the horizontal distance L
between them (see Equation 2) (Ghilani & Wolf,
2012).
Figure 8: Cross section of volume illustrating (Ghilani,
2012).
)(
2
3
21
mL
AA
V
e
(2)
where V
e
is volume, A
1
and A
2
are end area, L is
distance between A
1
and A
2.
The result of the volume calculation with the
composite method is 5,881,819.17 m
3
and the cross
section is 5,370,694.656 m
3
. The dredging volume
difference between cross section manually and
composite method is -511,124.514 m
3
(-8.7%).
3.3 Volume Calculation by Cross
Section Method using Autodesk
Civil 3D Software
In calculating the dredging volume in the AutoCAD
Civil 3D software, two surfaces are needed, namely
existing and design surface. The first surface is an
existing surface containing the x, y, z coordinates of
the dredging bathymetry at the SWAC. Based on the
Indonesian Minister of Transportation regulation
No. 455 year 2016, the minimum depth of SWAC is
-13 m and the wide of SWAC is 150 m.
Figure 9: Cross section STA 0+100 in AutoCad Civil 3D.
The method used to calculate volume using
AutoCad Civil 3D is a cross section with interval 50
m. There are 353 cross sections in this case. Figure 9
is one example of cross section at the station STA 0
+ 100.00. The smallest volume value is 35.1 m³
which located in section between STA 17 + 550.00
and STA 17 + 626.77. This is because the depth in
this section approach -13 meters. Conversely the
largest volume is 34,802.02 m
3
which located in
section between STA 12 + 100 and STA 12 + 150.
This section is quite shallow, so that the existing
surface above the dredge design should be cut quite
a lot. The total volume from 353 cross section in this
case is 5,921,745 m
3
.
The volume difference between the Autodesk
Civil 3D cross section method and the composite
method is 39,925.83 m
3
(0.67%), whereas the
volume difference between the Autodesk Civil 3D
cross section method and the cross section manually
method is 551,050.344 m
3
(10.26%).
3.4 Volume Calculation by Cross
Section Method using Hypack
Software
The existing surface modelled by TIN will be
overlaid with a dredge template (Figure 10) to
calculate its volume. The size of the dredge template
refers to Minister Transportation regulation No. 455
in 2016.
Figure 10: Template section as depth referenced.
The following Figure 11 is a side view of one
section. Information on the value of the volume of
each section displayed is divided into three, namely
VL (Volume Left), V1 (Channel), and VR (Volume
Right). Volume Left is the volume that is in the left
slope area, as well as Volume Right is the volume
that is in the right slope area, while V1 is the volume
a channel besides the slope area in the first layer.
SENTA 2018 - The 3rd International Conference on Marine Technology
30
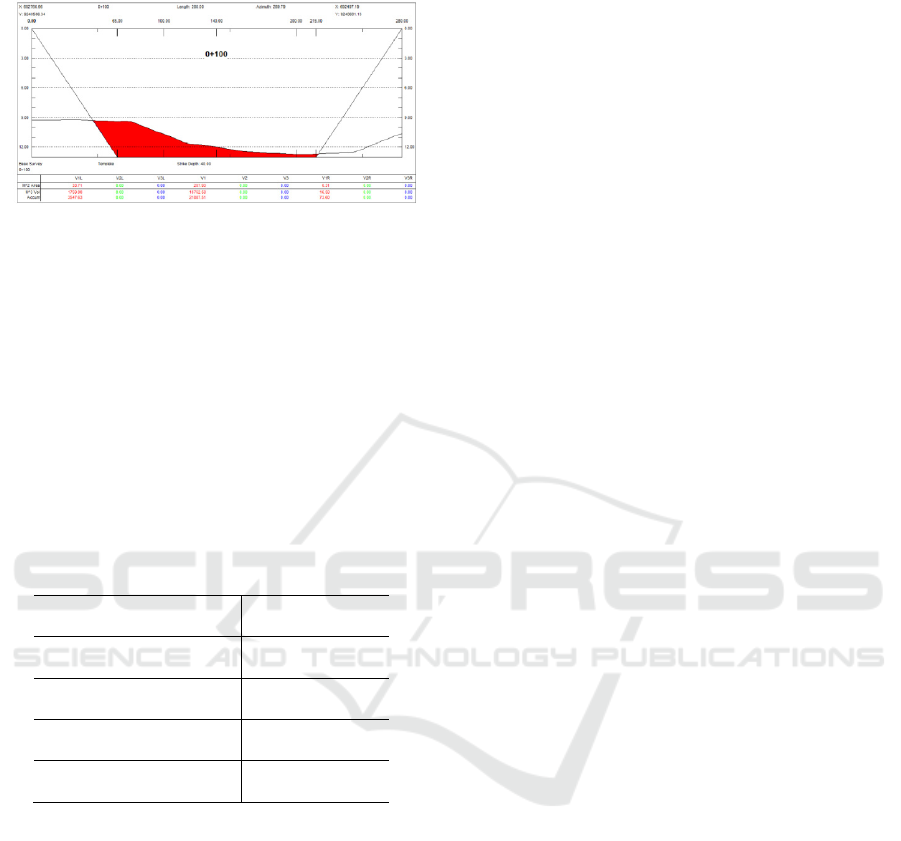
Figure 11: Cross section STA 0 + 100 in HyPack
Software.
From the calculation of volume using Hypack
sofware, the smallest volume value of 127.23 m³ is
located in section between STA 17 + 550 + STA 17
+ 626.77. The small value is due to the depth of the
section approaching -13 meters, the existing surface
above the dredge design is small. Conversely the
largest volume value is 32.002,69 m³ which located
in section between STA 12 + 100 and STA 12 +
150. This is because the shallow depth in the section,
the existing surface above the dredge design is quite
a lot to be cut.
Table 1: Volume of SWAC using Hypack.
Design Volume (m
3
)
VL (Volume Left) 839,934.84
V1 (Channel) 4,525,591.71
VR (Volume Right) 46,184.21
Total 5,952,881.83
In calculating the volume of cross section with
Hypack software the results of the calculation
information displayed are divided into three parts,
namely the volume value in VL, V1, and VR. The
total volume of SWAC with the cross section
method using Hypack is 5,952,881.83 m
3
.
The volume difference between the Hypack cross
section method and the composite method is
71,062.66 m
3
(1.2%), whereas the volume difference
between the Hypack cross section method and the
manual cross section method is 582,187.174m
3
(9.77%).
4. CONCLUSION
Conclusions that can be drawn from this study are as
follows :
1. The volume difference between the
composite method and the manual cross
section method used as a reference to
the comparison calculation is very
significant at 8.7% (511,124.514 m
3
)
2. Difference between volume calculation
using Autodesk Civil 3D and Hypack
software is equal to 31,136.83 (0.52%)
The volume of Autodesk Civil 3D and Hypack
results have almost the same value as the composite
method with the difference 0.67% and 1.2%
consecutively and compared with manual cross
section are 10.26% for Autodesk Civil 3D and
9.77% for Hypack software.
REFERENCES
Autodesk, K., 2014. Sectional Volume Methods.
s.l.:Autodesk.
Buana, P. A., 2014. Studi Penentuan Draft dan Lebar
Ideal Kapal Terhadap Alur Pelayaran. Tugas Akhir,
Jurusan Teknik Geomatika ITS, Surabaya.
Disnav, 2016. Peta Laut Indonesia Alur Pelayaran Barat
Surabaya. Kementerian Perhubungan Direktorat
Jenderal Perhubungan Laut Distrik Navigasi Kelas I
Surabaya, Surabaya.
Ghilani, C. D. & Wolf, P. R., 2012. Elementary Surveying.
An introduction to Geomatics. 13th edition.
s.l.:Prentice Hall.
Hypack, S., 2016. Volumes Calculation Method
Comparison in Cross Sections and Volumes. s.l.:s.n.
Labant, S., Stankova, H. & Weiss, R., 2013. Geodetic
Determining of Stockpile Volume of Mineral
Excavated in Open Pit Mine. GeoScience Engineering,
Volume LIX, pp. No.1 p. 30-40.
Nation, U., 2017. Identification of Islands and
Standardization of Their Names. 11th United Nations
Conference on the Standardization of Geographical
Names. s.n., New York.
Parwata, G., 2011. Peran Distrik Navigasi Dalam
Keselamatan Pelayaran. Kementrian Perhubungan,
Bali.
Wahyudi, N., Armono, H. D. & Sujantoko, 2013. Analisa
Laju Volume Sedimentasi di Alur Pelayaran Barat
Surabaya (APBS). Jurusan Teknik Kelautan ITS,
Surabaya.
Windari, R., 2009. Hukum Laut, Zona-Zona Maritim
Sesuai UNCLOS 1982 dan Konvensi – Konvensi
Bidang Maritim. Bakorkamla, Jakarta.
Dredging Volume Analysis using Multi Beam Echo Sounder Data
31
