
Demographic Factors and Life Satisfaction of Indonesian Christian
Private Universities Lecturers: A Descriptive Preliminary Study
Yusak Novanto
12
, Seger Handoyo
1
and Jenny Lukito Setiawan
3
1
Faculty of Psychology, Universitas Airlangga
2
Faculty of Psychology, Pelita Harapan University Surabaya
3
Faculty of Psychology, Ciputra Universit Surabaya
Keywords: life satisfaction, Indonesian Christian private universities lecturers, demographic factors
Abstract: Life satisfaction plays an important role in improving the quality of an individual’s work performance in
any profession, including lecturers in higher education institutions. As educators, lecturers are obliged to
implement “Tri Dharma Perguruan Tinggi” properly and responsibly. This research is a descriptive
preliminary study to analyse the relation between demographic factors and a lecturer’s life satisfaction in
Christian private universities in Indonesia. Using the SWLS (Satisfaction with Life Scale), this research
used 60 respondents from several Christian private universities. The research found that most lecturers
(43.3%) were satisfied with their life condition right now. Furthermore, based on cross tabulation analysis, it
is known that the difference of demographic factors among the respondents has a unique pattern on the
lecturer's life satisfaction. Further findings with Kendall’s tau and Crammer’s V coefficient show that
demographic factors, namely age, income, number of co-workers, marital status, spouse’s status, and health
conditions have a significant correlation and association with the lecturer’s life satisfaction. In particular,
with logistic ordinal regression, we found that age, income and spouse’s status have a significant effect on
life satisfaction. Suggestions were addressed to University Leaders to improve life satisfaction and
subjective wellbeing of their lecturers through psychological interventions and an employee development
program.
1 INTRODUCTION
Life satisfaction of a person will affect their attitudes
and daily behaviors. Purnomo (2009) states that a
person who is satisfied with their life will have more
energy to go through a period of their life. Life
satisfaction also enables human beings to make any
change to themself and to adjust to their surrounding
environment. Life satisfaction is an intrinsic
element, which is very important for human beings,
as it will determine the quality of life and
performance of an individual in an organizational
setting.
Life satisfaction is an important aspect for
everybody in any field of work, including for
lecturers. A lecturer is a professional educator and
scientist with primary task roles of transforming,
developing and disseminating science, technology,
and arts through education, research and community
services in higher education institutions, in order to
improve the standard and quality of national
education.
This research was conducted at eight Christian
private universities in Indonesia. What is meant by
private Christian universities in this research is
private higher education institutions that conduct
regular study programs (not Theological Schools or
Seminary) and which are established by individuals,
synods of church, or educational foundations that
have a specific vision and mission which is
characterized by the Christian faith, values, symbols
and practices. In Indonesia, there are 80 Christian
private higher education institutions with 667 study
programs, 5,812 lecturers and 129,601 students. In
Christian teaching, working as a professional in
education or Christian ministry, including as a
lecturer or to be ordained as a pastor is not simply a
choice of life, but it can be understood as a special
life calling from God. However, in reality, many
Christian lecturers in these private universities are
struggling in the profession, and try to find a better
Novanto, Y., Handoyo, S. and Setiawan, J.
Demographic Factors and Life Satisfaction of Indonesian Christian Private Universities Lecturers: A Descriptive Preliminary Study.
DOI: 10.5220/0008587101870198
In Proceedings of the 3rd International Conference on Psychology in Health, Educational, Social, and Organizational Settings (ICP-HESOS 2018) - Improving Mental Health and Harmony in
Global Community, pages 187-198
ISBN: 978-989-758-435-0
Copyright
c
2020 by SCITEPRESS – Science and Technology Publications, Lda. All rights reserved
187

job and income. In this situation they will experience
a low level of satisfaction in their life. As result,
they will not do well their responsibilities at the
university. Based on several interviews with at least
five lecturers and leaders from five Christian private
universities located around Indonesia, we found
problems in lecturers’ life satisfaction, quality of
work performance and organization of academic
performance. On the other hand, Christian private
universities are unique because they have strong
roots in the doctrines and values of the Christian
religion, especially regarding the concept of working
for God, Christian Education, and willingness to
serve others. These beliefs require lecturers to work
not only to fulfil financial needs, but also to glorify
God and become blessings for others through the
educational field. Thus, research on life satisfaction
for lecturers at Christian private universities is
important exploration since there was no study about
this community until now.
This study focuses on examining the influence of
demographic factors on the life satisfaction of
Christian private university lecturers in Indonesia.
Demographic factors are one of the important
elements that influence life satisfaction. The
previous research by Sousa and Lybormirsky (2001)
found that the influence of demographic factors,
such as culture, gender, age, social relationships,
income, occupation and education will affect the
satisfaction of one's life.
2 LITERATURE REVIEW
2.1 Definitions of Life Satisfaction
Life satisfaction is defined as a person's cognitive
perception of the comparison between his actual
living conditions and his or her current standard of
living (Diener, et al., 2005). Based on this definition,
it can be concluded that the satisfaction of one
individual's life can be achieved if the actual living
conditions meet or are higher than the standard of
life set by the individual. Therefore, a human being
constantly strives to improve his or her actual living
conditions in various ways.
Some researchers have suggested that life
satisfaction is defined as a cognitive evaluation of
the lives of individuals (Borg, et al., 2006, and Saric,
et al., 2008). They also stated that life satisfaction is
the total number of individual perceptions of various
aspects of life in the family, community and
neighborhood. This includes a composite measure
consisting of physical, mental and social well-being
factors as per individual or group of individuals. In
general, life satisfaction can be summed up as a
sense of satisfaction that a person feels about what
he or her has gained at this time. Its aspects can be
measured cognitively by the individual’s evaluation
of themself. The perception of life satisfaction will
vary from one person to another. This is due to the
difference in everyone's ideal standard. In this case,
life satisfaction is considered based on the belief or
attitude of the individual in assessing his or her life
(Eid and Larsen, 2008).
Based on a literature review conducted by
Qudsyi et al. (2015), it can be concluded that
employee happiness and satisfaction have proven to
be positively correlated with work engagement and
organizational affective commitment (Field and
Buitendach, 2011), better quality of life (Anand and
Arora, 2009), performance and work productivity
(Bakker and Oerlemans, 2010), organizational
commitment (Lumley, et al., 2011) and also
negatively correlated with turnover (Idowu, et al.,
2010). Employee happiness and satisfaction are
important factors that affect their performance;
therefore, organizations need to always consider
what can be done in order to make employees feel
satisfied and happy in their work.
2.2 Measurement of Life Satisfaction
Glatzer, et al. (2015) stated that studies of life
satisfaction as a social indicator in society can be
seen as a result of the work of Campbell and
Converse in early 1970. In their book, they argue
that by looking directly at social psychological
feelings such as the attitudes, hopes, feelings,
aspirations and values of a population, it is necessary
to understand the current social changes and the
quality of life they have.
Generally, the measure of life satisfaction is
obtained through self-reporting. This method is
believed to be the most accurate method of
measuring life satisfaction (Sousa and Lybormirsky,
2001). Measurement through self-report asks
respondents to indicate their level of life satisfaction
by choosing symbols (numbers or facial
expressions) on a scale usually ranging from 1-7.
The measure of life satisfaction can be single-item
or multi-item. However, researchers agree that
multi-item scales are better than single-item in
measuring life satisfaction (Sousa and Lybormirsky,
2001). In addition, according to Diener (in Sousa
and Lybormirsky, 2001) the multi-item scales as a
whole have greater reliability and validity than
single-item scales.
ICP-HESOS 2018 - International Conference on Psychology in Health, Educational, Social, and Organizational Settings
188

This study uses the Satisfaction With Life Scale
(SWLS), which is the most widely used scale around
the world to measure the global satisfaction of one's
life. This scale was created by Diener, et al. (1985),
and contains five items to measure the global
satisfaction of life. Thus, this scale is used to
measure the satisfaction of life, which is the
cognitive component of happiness without
mentioning the affection (Sousa and Lybormirsky,
2001). This scale is neutral and incorporates the
concept of eudemonia and hedonic value as a unity
(Vitterso, 2016). Diener, et al. (2005) employed
various items as indicators of life satisfaction,
namely the desire to change lives, satisfaction with
one’s life today, the satisfaction of living in the past,
the satisfaction of life in the future, and the person's
general judgment of their life.
2.3 Demographic Factors Related to
Life Satisfaction
Lahamuddin (2013) names several factors that
influence the emergence of individual life
satisfaction including health, employment and
income status, realism of the role concept, age,
marriage and social relationships. These are general
indicators, which have been developed and refined
by further researches. In line with previous
researches, Qudsyi, et al. (2015) stated that
employee life satisfaction is also influenced by
demographic factors (Abeka-Donkor, 2013) such as
age (Johnson, et al., 2008), gender (Dhanapal, et al.,
2013), as well as job types and characteristics
(Luechinger, et al., 2008), supervision support
(Oduro-Owusu, 2010), work and family balance,
opportunities for career promotion, proper training,
and personal development and careers. Meanwhile,
employee life satisfaction is also negatively affected
by burnout (Hombrados-Mendieta and Cosano-
Rivas, 2011), the stress felt during work (Ahn,
2005), the perception that their income earned is less
than the income of others (Ahn, 2005), work-family
conflict and pressure of wok (Dhamayanti, 2006).
3 RESEARCH METHOD
This study used five items of SWLS, a
unidimensional scale to measure life satisfaction,
and respondents will answer each item on a Likert
scale of 1 to 7. The reliability statistic of SWLS on
this research is 0.841 (Cronbach’s Alpha) and
corrected item-total correlation score rotates from
0.556 to 0.785. To obtain sufficient research results,
this study uses a complete demographic factor
related to a respondent’s characteristics. The
measured demographic factors include gender, age,
education level, marital status, spouse working
status, employment status, tenure track title, length
of service, perceived income, perceived salary,
perceived wage, number of co-workers, and health
condition.
Given the widespread distribution of Christian
private universities in Indonesia, this study is
focused on universities that are considered to
represent lecturers across Indonesia, ranging from
Sumatra to Papua with accidental sampling
technique. The questionnaires are distributed
through e-mail to be filled in online. From a total of
60 questionnaires, there were 60 completed
questionnaires. Thus, the response rate of this
research is 100%, which means a very good
response.
The result of this research is a categorization of
respondents' satisfaction level according to Diener,
et al (1985). The categorization aims to show the
description of satisfaction level perceived by the
Christian private university lecturers who became
respondents in this study. The research continued
with cross tabulation analysis and non-parametric
correlation analysis to identify the correlation and
association of each demographic factor to life
satisfaction. Finally, ordinal logistic regression
analysis is performed to see the effect of these
demographic factors on the life satisfaction of the
respondents. This research employs SPSS 22
software for statistical analysis.
4 RESULTS
4.1 Categorization of Life Satisfaction
Level
The categorization is performed to determine the
description of life satisfaction level of respondents.
The results showed that the category of satisfaction
of respondents' overall life is quite scattered and
diverse, ranging from the level of dissatisfaction to
feeling very satisfied. However, it can be seen that
most lecturers are satisfied with their life (43.3%).
The categorization of life satisfaction scores can be
seen in Table 1.
Table 1: Level of life satisfaction.
Level Fre
q
uenc
y
(
Percenta
g
e
)
Ver
y
dissatisfie
d
0
p
erson
(
0%
)
Demographic Factors and Life Satisfaction of Indonesian Christian Private Universities Lecturers: A Descriptive Preliminary Study
189

Dissatisfied 2
p
ersons
(
3.3%
)
Somewhat dissatisfie
d
7 persons (11.7%)
Neutral 4 persons (6.7%)
Somewhat satisfie
d
15
p
ersons
(
25%
)
Satisfie
d
26
p
ersons
(
43.3%
)
Ver
y
satisfie
d
6
p
ersons
(
10%
)
Total 60
p
ersons (100%)
4.2 Cross Tabulation Analysis
Cross tabulation analysis of each demographic factor
with life satisfaction can be seen in Table 2 to Table
14.
Table 2: Cross tabulation analysis of gender with life
satisfaction.
Life Satisfaction
Category
Male Female Total
Dissatisfied 2
(6,9%)
0
(0.0%)
2
(3.3%)
Somewhat
dissatisfied
3
(10.3%)
4
(12.9%)
7
(11.7%)
Neutral 2
(6.9%)
2
(6.9%)
4
(96.7%)
Somewhat
satisfied
9
(31,0%)
6
(19.4%)
15
(25%)
Satisfied 9
(31,0%)
17
(54,8%)
26
(43.3%)
Very satisfied 4
(13.8%
2
(6.5%)
6
(10.0%)
Total 29 31 60
Based on Table 2 it can be seen that male and
female respondents are mostly satisfied with their
life. However, female respondents are more satisfied
with their life compared to male respondents. 17 out
of a total of 31 women were satisfied, while only 9
out of 29 men are satisfied. Another interesting
finding from the table above is that none of the
female respondents in the category were dissatisfied
with their lives.
Table 3: Cross tabulation analysis of age with life
satisfaction.
Life
Satisfaction
Category
25-30 31-40 41-60 >60 Total
Dissatisfied
1
(10 %)
1
(3,4%)
0
(0.0%)
0
(0.0%)
2
(3.3%
)
Somewhat
dissatisfied
3
(30%)
4
(13.8%)
0
(0.0%)
0
(0.0%)
7
(11,7
%)
Neutral
2
(20%)
2
(6.9%)
0
(0.0%)
0
(0.0%)
4
(6.7%
)
Somewhat
satisfied
2
(20%)
7
(24.1%)
3
(20.0%)
3
(50%)
15
(25.0
%)
Satisfied
2
(20%)
14
(48.3%)
8
(53.3%)
2
(33.3%)
26
(43.3
%)
Very
satisfied
0 (0.0%)
1
(3.4%)
4
(26.7%)
1
(16.7%)
6
(10.0
%)
Total
10 29 15 6 60
Based on Table 3 it can be seen that most
respondents according to their ages are satisfied with
their life. However, respondents from groups 31-40
years old, 41-60 years old and > 60 years old have
greater satisfaction level than respondents from the
group 25-30 years old. Respondents in the category
25-30 years old have diverse answers to the
satisfaction of their life. Another interesting finding
from the table above is that none of the respondents
in groups 41-60 years old and above 60 years old is
dissatisfied with their life.
Table 4: Cross tabulation analysis of education level with
life satisfaction.
Life
Satisfaction
Category
S1 S2 S3 Total
Dissatisfied 0
(0.0%)
2
(4.2%)
0
(0.0%)
2
(3.3%)
Somewhat
dissatisfied
0
(0.0%)
7
(14.6%)
0
(0.0%)
7
(11.7%)
Neutral 1
(100.0%)
3
(6.3%)
0
(0.0%)
4
(6.7%)
Somewhat
satisfied
0
(0.0%)
10
(20.8%)
5
(45.5%)
15
(25.0%)
Satisfied 0
(0.0%)
23
(47.9%)
3
(27.3%)
26
(43.3%)
Very
satisfied
0
(0.0%)
3
(6.3%)
3
(27.3%)
6
(10%)
Total
1 48 11 60
Based on Table 4 it can be seen that most
respondents according to their education level are
satisfied with their life. However, respondents from
group S2/Master’s degree are more satisfied than
respondents from groups S1/Undergraduate degree
or S3/Doctoral degree. Another interesting finding
from the table is that none of the S3/Doctoral degree
respondents are dissatisfied with their life.
Table 5: Cross tabulation analysis of marital status with
life satisfaction.
Life
Satisfaction
Category
Single Married Others Total
Dissatisfied 1
(5.0%)
1
(2.6%)
0
(0.0%)
2
(3.3%)
Somewhat
dissatisfied
6
(30.0%)
1
(2.6%)
0
(0.0%)
7
(11.7%)
Neutral 2
(10.0%)
2
(5.3%)
0
(0.0%)
4
(6.7%)
ICP-HESOS 2018 - International Conference on Psychology in Health, Educational, Social, and Organizational Settings
190

Somewhat
satisfied
2
(10.0%)
11
(28.9%)
2
(100%)
15
(25.0%)
Satisfied 9
(45.0%)
17
(44.7%)
0
(0.0%)
26
(43.3%)
Very satisfied
0
(0.0%)
6
(15.8%)
0
(0.0%)
6
(10.0%)
Total
20 38 2 60
Based on Table 5 it can be seen that most
respondents according to their marital status feel
satisfied with their life. However, married
respondents feel more satisfied with their life
compared to other respondents.
Table 6: Cross tabulation analysis of spouse status with LS
Based on Table 6 it can be seen that most
respondents according to their spouse status are
satisfied with their life. However, respondents with
spouses who are also working feel more satisfied
than other respondents. 16 people out of a total of 31
respondents with the status of working spouses are
satisfied with their life. Another interesting finding
from the table above is that for respondents with the
status of a spouse who does not work, some are
dissatisfied or somewhat dissatisfied with their life.
Table 7: Cross tabulation analysis of employment status
with life satisfaction.
Life
Satisfaction
Category
Permanent Contract
DPK
/PNS
Total
Dissatisfied 1
(2.2%)
1
(7.1%)
0
(0.0%)
2
(3.3%)
Somewhat
dissatisfied
6
(13.3%)
1
(7.1%)
0
(0.0%)
7
(11.7%)
Neutral 4
(8.9%)
0
(0.0%)
0
(0.0%)
4
(6.7%)
Somewhat
satisfied
9
(20%)
6
(42.9%)
0
(0.0%)
15
(25.0%)
Satisfied 20
(44.4%)
5
(35.7%)
1
(100%)
26
(43.3%)
Very
satisfied
5
(11.1%)
1
(7.1%)
0
(0.0%)
6
(10.0%)
Total
45 14 1 60
Based on Table 7 it can be seen that most
respondents, according to their employment status,
are satisfied with their life. Lecturers with
permanent employment feel more satisfied
compared to contract lecturers. However, there are
several permanent respondents who still feel
dissatisfied or somewhat dissatisfied with their life.
Table 8: Cross tabulation JJA with life satisfaction.
Based on Table 8 it can be seen that most
respondents according to academic functional degree
are satisfied with their life. Respondents with degree
of “Lektor” feel satisfied more than respondents
with other academic functional degrees. Another
interesting finding from the table above is two
respondents with the highest academic functional
degree, namely “Guru Besar”/Professor, somehow,
they still only feel somewhat satisfied with their life.
Table 9: Cross tabulation analysis of length of service (in
years) with life satisfaction.
Life
Satisfa
ction
Catego
ry
2-5 6-10 11-15 > 15 Total
Dissati
sfie
d
2
(13.%)
0
(0.0%)
0
(0.0%)
0
(0.0%)
2
(3.3%)
Some
what
dissati
1
(6.7%)
5
(20.0%)
1
(10.0%)
0
(0.0%)
7
(11.7%)
Life
Satisfaction
Category
Others
Work-
ing
Not
Working
Total
Dissatisfied
0
(0.0%)
0
(0.0%)
2
(15.4%)
2
(3.3%)
Somewhat
dissatisfied
4
(25%)
0
(0.0%)
3
(23.1%)
7
(11.7%)
Neutral
1
(6.3%)
3
(9.7%)
0
(0.0%)
4
(6.7%)
Somewhat
satisfied
3
(18.8%)
8
(25.8%)
4
(30.8%)
15
(25.0%)
Satisfied
8
(50%)
16
(51.6%)
2
(15.4%)
26
(43.3%)
Very
satisfied
0
(0.0%)
4
(12.9%)
2
(15.4%)
6
(10.0%)
Total
16 31 13 60
Life
Satisf
action
Categ
ory
TP AA Lektor
Lektor
Kepala
Guru
Besar
Total
Dissat
isfied
1
(5.3%)
1
(6.7%)
0
(0.0%
)
0
(0.0%)
0
(0.%)
2
(3.3%
)
Some
what
dissati
sfied
4
(21.1%)
0
(0.0%)
2
(11.1%
)
1
(16.7%)
0
(0.%)
7
(11.7
%)
Neutr
al
2
(10.5%)
1
(0.0%)
1
(5.6%
)
0
(0.0%)
0
(0.%)
4
(6.7%
)
Some
what
satisfi
ed
4
(21.1%)
6
(40.%)
1
(5.6%
)
2
(33.3%)
2
(100%
)
15
(25.
0%)
Satisfi
ed
7
(36.8%)
4
(26.7%)
13
(72.2%
)
2
(33.3%)
0
(0.%)
26
(43.
3%)
Very
satisfi
e
d
1
(5.3%)
3
(20%)
1
(5.6%
)
1
(16.7%)
0
(0.%)
6
(10%)
Total 19 15 18 6 2 60
Demographic Factors and Life Satisfaction of Indonesian Christian Private Universities Lecturers: A Descriptive Preliminary Study
191

sfied
Neutra
l
3
(20.%)
1
(4.0%)
0
(0.0%)
0
(0.0%)
4
(6.7%)
Some
what
satisfie
d
4
(26.7%)
4
(16.0%)
2
(20%)
5
(50%)
15
(25.0%)
Satisfi
e
d
4
(26.7%)
11
(44.0%)
7
(70%)
4
(40.0%)
26
(43.3%)
Very
satisfie
d
1
(6.7%)
4
(16.0%)
0
(0.0%)
1
(10.0%)
6
(10.0%)
Total
15 25 10 10 60
Based on Table 9 it can be seen that the
respondents according to their length of service in
Christian universities are satisfied with their life.
Most of the respondents have worked in Christian
private universities for 6 to 10 years and they feel
satisfied with their life. Respondents who just started
working, or have worked for 2 to 5 years have a
variety of life satisfaction level, ranging from not
satisfied to very satisfied. Conversely, respondents
who have worked more than 15 years, tend to feel
satisfied and very satisfied with their life.
Table 10: Cross tabulation analysis of perceived income
with life satisfaction.
Life Satisfaction
Category
Feel
Sufficient
Feel Not
Sufficient
Total
Dissatisfied 2
(10.5%)
0
(0.0%)
2
(3.3%)
Somewhat
dissatisfied
5
(26.3%)
2
(4.9%)
7
(11.7%)
Neutral 3
(15.8%)
1
(2.4%)
4
(6.7%)
Somewhat
satisfied
4
(21.1%)
11
(26.8%)
15
(25.0%)
Satisfied 3
(15.8%)
23
(56.1%)
26
(43.3%)
Very satisfied 2
(10.5%)
4
(9.8%)
6
(10.0%)
Total 19 41 60
Based on Table 10 it can be seen that the
respondents are satisfied with their life. However,
when viewed from their proportion, respondents
who feel sufficient with their income are more
satisfied than respondents who feel not sufficient
with their income. Respondents whose income has
not been able to meet their needs tend to feel
dissatisfied with their life.
Table 11: Cross tabulation analysis of perceived salary
with life satisfaction.
Life
Satisfaction
Cate
g
or
y
Same as
others
Below
others
Beyond
others
Total
Dissatisfied 0
(
0.0%
)
2
(
5.7%
)
0
(
0.0%
)
2
(
3.3%
)
Somewhat 1 6 0 7
dissatisfie
d
(
4.5%
)
(
17.1%
)
(
0.0%
)
(
11.7%
)
Neutral 1
(
4.5%
)
3
(
8.6%
)
0
(
0.0%
)
4
(
6.7%
)
Somewhat
satisfie
d
6
(
27.3%
)
7
(
20.0%
)
2
(
66.7%
)
15
(
25.0%
)
Satisfied 11
(50.0%)
14
(40.0%)
1
(33.3%)
26
(43.3%)
Very
satisfie
d
3
(
13.6%
)
3
(
8.6%
)
0
(
0.0%
)
6
(
10.0%
Total 22 35 3 60
Based on Table 11 it can be seen that most
respondents are satisfied with their life. However,
when viewed from their proportion, respondents
who have salaries equivalent or similar to other
professions feel more satisfied than other
respondents. Another interesting finding from the
table above is that respondents with salaries below
other professions generally still feel satisfied with
their life.
Table 12: Cross tabulation analysis of perceived wage
with life satisfaction.
Life
Satisfaction
Category
Same as
others
Below
others
Beyond
others
Total
Dissatisfied 1
(
2.3%
)
1
(
8.3%
)
0
(
0.0%
)
2
(
3.3%
)
Somewhat
dissatisfied
5
(11.6%)
2
(16.7%)
0
(0.0%)
7
(11.7%)
Neutral 3
(
7.0%
)
1
(
8.3%
)
0
(
0.0%
)
4
(
6.7%
)
Somewhat
satisfied
10
(23.3%)
2
(16.7%)
3
(60%)
15
(25%)
Satisfied 19
(
44.2%
)
5
(
41.7%
)
2
(
40%
)
26
(
43.3%
)
Very satisfied
5
(11.6%)
1
(8.3%)
0
(0.0%)
6
(10%)
Total
43 12 5 60
Based on Table 12 it can be seen that the
respondents are mostly satisfied with their life.
Although there are some respondents with equal or
even lesser wages than other PT lecturers who feel
dissatisfied or somewhat dissatisfied, most of them,
however, are satisfied and even very satisfied with
their lives.
Table 13: Cross tabulation analysis of number of Co-
workers with life satisfaction.
Life
Satisfacti
on
Category
1-2 3-5 6-10 > 10 Total
Dissatisfi
e
d
1
(9.1%)
0
(0.0%)
1
(7.7%)
0
(0.0%)
2
(3.3%)
Somewh
at
dissatisfi
e
d
3
(27.3%)
3
(11.1%)
1
(7.7%)
0
(0.0%)
7
(11.7%
)
Neutral 0
(0.0%)
2
(7.4%)
1
(7.7%)
1
(11.1%)
4
(6.7%)
ICP-HESOS 2018 - International Conference on Psychology in Health, Educational, Social, and Organizational Settings
192
Somewh
at
satisfie
d
4
(36.4%)
8
(29.6%)
2
(15.4%)
1
(11.1%)
15
(25.0%
)
Satisfied
3
(27.3%)
11
(40.7%)
7
(53.8%)
5
(55.6%)
26
(43.3
%)
Very
satisfied
0
(0.0%)
3
(11.1%)
1
(7.7%)
2
(22.2%)
6
(10.0%
)
Total 11 27 13 9 60
Based on the result of cross-tabulation of life
satisfaction with the number of co-workers, it can be
seen that most respondents are satisfied with their
life. There is an interesting pattern from the table
above, if they have more co-workers (specially 3-5
and 6-10 co-workers), the lecturers are more
satisfied with their life.
Table 14: Cross tabulation analysis of health condition
with life satisfaction.
Life Satisfaction
Category
Good Not good Total
Dissatisfied 1
(2.3%)
1
(6.3%)
2
(3.3%)
Somewhat
dissatisfied
2
(4.5%)
5
(31.3%)
7
(11.7%)
Neutral 4
(9.1%)
0
(0.0%)
4
(6.7%)
Somewhat satisfied 11
(25.0%)
4
(25.0%)
15
(25.0%)
Satisfied 20
(45.5%)
6
(37.5%)
26
(43.3%)
Very satisfied 6
(13.6%)
0
(0.0%)
6
(10.0%)
Total 44 16 60
Based on the results of cross-tabulation analysis
of life satisfaction with health condition, it can be
seen that most respondents are satisfied with their
life. If viewed in more detail, it can be concluded
that health factors have an important relation to the
lecturer's life satisfaction.
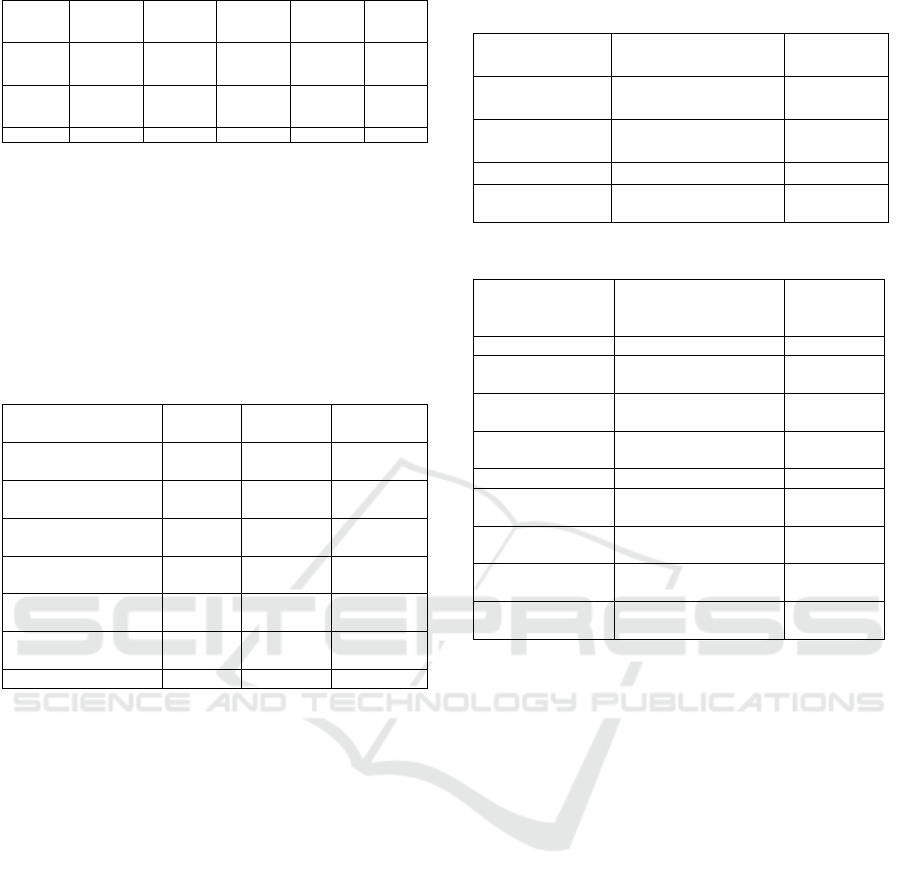
4.3 Relation of Demographic Factors
and Life Satisfaction
Statistics analysis is conducted to see the relation of
each demographic factor with life satisfaction of
Christian private university lecturers in Indonesia.
For demographic factors with nominal scale,
association analysis is run with Cramer's V
coefficient. Whereas demographic factors with
ordinal scale, correlation analysis is done by looking
at Kendall's Tau coefficient and significance value
of each correlation. If the significance value < 0.05 it
can be concluded that the two variables have a
strong relationship. The results of association and
correlation analysis can be seen in Tables 15 and 16.
Table 15: Association analysis (Cramer's V coefficient).
Demographic
Factor
Cramer's V coefficient
with (Sig-value)
Conclusion
Gender 0.311 (0.325)
Not
significant
Employment
status
0.229 (0.789)
Not
significant
Marital status 0.413* (0.025) Significant
Spouse working
status
0.425* (0.017) Significant
Table 16: Correlation analysis (Kendall’s Tau)
Demographic
Factor
Kendall’s Tau
coefficient with
(Sig-value)
Conclusion
Age 0.377* (0.001) Significan
t
Education level 0.183 (0.120)
Not
significan
t
Academic
functional degree
0.137 (0.207)
Not
significan
t
Length of service 0.163 (0.138)
Not
significan
t
Perceived income 0.375* (0.002) Significan
t
Perceived salary -0.181 (0.120)
Not
significan
t
Perceived wage -0.076 (0.511)
Not
significan
t
Number of Co-
Workers
0.253* (0.021) Significant
Health condition -0.258* (0.030)
Negatively
Significan
t
Based on Tables 15 and 16 it can be concluded
that from demographic factors measured in this
study, there are six demographic factors that
correlate significantly with the life satisfaction of
Christian private university lecturers. Meanwhile,
the other demographic factors are not significantly
correlated with the life satisfaction of the lecturers.
The first demographic factor is age. The age factor
has a positive and significant effect on a lecturer's
life satisfaction. This means that the greater the age
of the lecturer, the greater the satisfaction with their
life.
The second demographic factor is income. The
factor of perceived income has a positive and
significant effect on life satisfaction of lecturer. This
means that the greater the lecturer's income
compared to the needs of their life, the greater the
satisfaction of their life.
The third demographic factor is the number of
co-workers. This factor has a positive and significant
effect on a lecturer's life satisfaction. This means
that the higher the number of co-workers a lecture
has, the greater the satisfaction with their life. The
fourth demographic factor is marital status. Marital
status also relates to a lecturer's life satisfaction.
Demographic Factors and Life Satisfaction of Indonesian Christian Private Universities Lecturers: A Descriptive Preliminary Study
193

Married lecturers feel a higher satisfaction with life.
In addition, there is a fifth demographic factor
namely the spouse’s working status that is also
associated with a lecturer's life satisfaction.
Lecturers will be more satisfied in life if their spouse
also works and earns additional income for their
family.
Finally, the sixth demographic factor is health
condition that has been shown to have a negative
and significant relationship to a lecturer's life
satisfaction. This statistical result is interesting,
since usually people with good health condition will
feel satisfied with their life compared to a person
who has problems in their wellness.
4.4 Ordinal Logistic Regression
Analysis
Initially, ordinal regression analysis was performed
to determine the influence of all demographic factors
on life satisfaction, but it was found later that the
model did not fit. Therefore, ordinal regression
analysis is only performed for demographic factors
that have been known to have a significant
relationship with life satisfaction, namely age,
perceived income, number of co-workers, marital
status, spouse status and health condition. The
results of ordinal logistic regression analysis can be
seen in the Appendix.
Based on the Appendix we can draw some
conclusions. First, in general, the results of ordinal
logistic regression confirm the results of previous
correlation analysis, that the six demographic factors
do have a significant effect on the life satisfaction of
lecturers in Christian private universities in
Indonesia. This can be seen from the fitting model
table showing the significance value of 0.000.
Second, the six demographic factors do not have a
parallel or equal regression coefficient. This can be
seen in the table of test of parallel, which shows a
great significance value that is 0.992.
The result of parameter estimation in ordinal
regression is depicted in Appendix C to Appendix H.
For example, from Appendix C, the calculation of
cumulative logit age category 2 is the coefficient of
estimate satisfaction category 2 minus the estimated
coefficient of age category 1=-5.974-(-0.438) =-
4.536. The cumulative odds value is the exp. value
of the cumulative logit. Cumulative proportion
formula=1/(1 + cumulative odds); whereas category
probability formula is the difference of cumulative
proportion value.
Based on Appendix C a positive relationship
can be seen between age factor and life satisfaction.
Age can reflect the maturity of one's thinking and
acting (Hurlock, 1997). The interesting finding is
that when the respondent entered the age category 4,
that is > 60 years old, the probability of being at the
level of life satisfaction of 5 (satisfied) is quite high,
that is 58%.
Based on Appendix D a positive relationship
can be seen between income factors and life
satisfaction. Income reflects the financial status of
the respondents. Respondents who are in the
category of income 1 (not sufficient) have achieved
probability at the level of life satisfaction of 4
(somewhat satisfied) that is equal to 41%.
Respondents who are in the category of income 2
(sufficient), have greater probability at the level of
life satisfaction of 5 (satisfied) that is equal to 58%.
Based on Appendix E it can be seen that
there is no meaningful relationship pattern between
number of co-workers and life satisfaction.
Respondents with number of colleagues in category
1 and category 3 have the same level of life
satisfaction tendency (with probability category
0.43) at level satisfaction of 4 (somewhat satisfied).
While the respondents with the number of co-
workers in category 2 and 4 have life satisfaction
level of 5 (satisfied) with probability of 0.50 and
0.58. Thus, respondents who have more co-workers
do not directly have a higher life satisfaction
compare to respondents who have fewer co-workers.
Based on Appendix F we can see the absence
of a meaningful pattern of relationships. Both
marital status 1 (single) and marital status 2
(married) are at the same level of life satisfaction of
5 (satisfied) with probability of 0.67 and 0.58.
Nevertheless, from the probability, it can be seen
that respondents in category 2 (married), have lower
probability of being satisfied with their life. This is
interesting, because according to Diener et al. (2005)
people who are married tend to have a higher
satisfaction of life compared to the single.
Based on Appendix G a positive relationship
can be seen between spouse working status and life
satisfaction. Respondents who have working spouses
(category 2) have a higher level of life satisfaction;
that is satisfaction is at level 5 with the category of
probability of 0.58 compared with the respondents
with spouses not working (category 1). Respondents
in category 1 tend to be only at the level of category
somewhat satisfied with the number of probabilities
0.42.
Based on Appendix H the absence of a
meaningful pattern of relationships can be seen
between health condition and life satisfaction. From
the category probability it can be seen that there is
ICP-HESOS 2018 - International Conference on Psychology in Health, Educational, Social, and Organizational Settings
194

no big difference in respondents with good health
condition and respondents with bad condition. Both
respondents are at the same level of satisfaction,
namely category 5 (satisfied) with the numbers 0.65
and 0.58, respectively. However, the probability for
respondents whose health condition is good that they
will feel satisfied with their life is higher compared
to respondents whose health condition is not good.
5 DISCUSSION
Work activities from a Christian perspective are
viewed as a personal life calling from God.
Likewise, with the profession of lecturers, for a
Christian believer it is a task entrusted directly by
God to share his life and educate the students
entrusted to them. Based on that view, Christian
lecturers are required to achieve the happiness and
optimal life satisfaction in carrying out their
profession. All the factors that become challenges or
obstacles in working as a lecturer, are not expected
to be a significant obstacle for Christian university
lecturers to continue to work in the world of higher
education in a productive and qualified manner.
The findings revealed that most lecturers are
satisfied with their life. Life satisfaction is an
important factor for a person in order to be able to
adjust and continue to feel happy in any situation
(Linsiya, 2015). Although some Christian private
universities cannot provide better incomes, with high
a level of life satisfaction, lecturers can continue to
develop themself and serve students, giving some
meaningful work to God, university and the nation.
Since the profession of lecturer is a calling from
God, then a lecturer should maximize their potential
to be a blessing to others around them, especially for
their students and organizations. Understanding the
meaning and purpose of life is also an important
factor to improve the satisfaction with one's life
(Schiraldi, 2007).
Other important findings also can be learned.
Each demographic factor has a distinctive pattern of
inter-relation with the lecturer's life satisfaction. A
good and positive working atmosphere does provide
a reason to be content in life, even though it is not
absolute. For example, a lecturer with a high degree
of academic function, namely a “guru besar” or
professor, will not always experience high
satisfaction with life when compared with lecturers
with lower academic functional degrees. Although
Professors have higher incomes, it does not
guarantee that they will have a high level of life
satisfaction. This finding confirms that life
satisfaction is an overall assessment that includes
many other aspects of human life.
Related to demographic factor and its effect on
life satisfaction of Christian private university
lecturers, it shows the same result as previous
researches. The findings of this study indicate a
significant relation between age, income, number of
co-workers, marital status, spouse’s status and health
conditions and a lecturer's life satisfaction. The
relation of age to life satisfaction is in line with the
findings of Sousa and Lybormirsky (2001) and
Johnson, et al. (2008). The relation of income to life
satisfaction is consistent with the findings of Sousa
and Lybormirsky (2001) and of Parvin and Kabir
(2011). The relation of number of co-workers to life
satisfaction is supported by previous research by
Parvin and Kabir (2011) and Jolodar (2012). The
relation of marital status and spouse’s working status
to life satisfaction is supported by findings of
Linsiya (2015). Finally, the relation of health
conditions to life satisfaction is also supported by
the findings of Pavot and Diener (2008). Only age,
perceived income and spouses working are proven
as three demographic factors that have significant
influence with greater probability of life satisfaction.
6 CONCLUSIONS
The results of this study provide preliminary
evidence of the relation and effect of various
demographic factors on the life satisfaction of
Christian private university lecturers in Indonesia.
The findings of this study confirm the results of
previous researches, which stated that the variable of
life satisfaction is influenced by many demographic
and other related psychological factors. Specifically,
this study also shows the unique condition of
lecturers in Christian private universities, in which
although many lecturers have not earned a high
income for this job, they still feel satisfied in life
because this profession is seen as a calling from
God.
Furthermore, in line with previous research, this
study shows the significant relation between age,
income, number of co-workers, marital status,
spouse’s status, and health condition and life
satisfaction of Christian private university lecturers
in Indonesia. In addition, from the result of ordinal
logistic regression analysis we can see the
significant effect of age, income and spouse status to
life satisfaction level of lecturers.
Finally, we suggest that organizational support
from the leaders and educational management
Demographic Factors and Life Satisfaction of Indonesian Christian Private Universities Lecturers: A Descriptive Preliminary Study
195

boards is needed to improve lecturers’ life
satisfaction. They can provide policies to increase
lecturers’ salary, health protection and insurance
programs, and maintain a conducive work climate.
They can show a warm leadership style and provide
some effort to sustain the life cycles of the
organization. All of these steps will have a
significant role in increasing lecturers’ life
satisfaction. If this condition can be realized, the
lecturers will be able to show productive
performance and produce quality work that is useful
for the development of the university and their
students. Thus, the vision of Christian universities’
mission as an extension of God's hand in providing
higher education for the noble value for the students
of the next generation can be realized as part of the
Goal of the Indonesian national education system.
This study has limitations because it only shows
the relationship and influence of demographic
factors on the life satisfaction of Christian private
university lecturers. Beside these matters, further
studies also need more respondents in order to
generalize the result. A more comprehensive
literature review needs to be completed to see the
influence of other related psychological factors that
can affect the life satisfaction of Christian private
university lecturers. Subsequently, further research
is expected to develop a conceptual model of life
satisfaction of Christian private university lecturers
in Indonesia.
REFERENCES
Abeka-Donkor, S., 2013. Are demographic factors
predictors of satisfaction? The International Journal of
Business & Management, 1(3), 1-8.
Ahn, N., 2005. Factors affecting life satisfaction among
Spanish workers: Relative importance of wage and
other factors, Preliminary, 1-21.
Anand, M., & Arora, D., 2009. Burnout, life satisfaction,
and quality of life among executives of multinational
companies, Journal of the Indian Academy of Applied
Psychology, 35(1), 159-164.
Bakker, A. B., & Oerlemans, W. G. M., 2010. Subjective
well-being in organizations. Chapter in K. Cameron &
G. Spreitzer (Eds.), Handbook of Positive
Organizational Scholarship. Oxford University Press.
Borg, C., Hallberg, I. R., & Blomqvist., 2006. Life
satisfaction among older people (65+) with reduced
selfcare capacity: the relationship to social, health and
financial aspects. Journal of Clinical Nursing 15,607-
618
Dhamayanti, R., 2006. Pengaruh konflik keluarga-
pekerjaan, keterlibatan pekerjaan, dan tekanan
pekerjaan terhadap kepuasan kerja karyawan wanita:
Studi pada Nusantara Tour & Travel kantor cabang
dan kantor pusat Semarang. Jurnal Studi Manajemen
& Organisasi, 3(2), 93-107.
Dhanapal, S., Alwie, S. M., Subramaniam, T., & Vashu,
D., 2013. Factors affecting job satisfaction among
academicians: A comparative study between gender
and generations, 2nd International Conference on
Management, Economics, and Finance Proceeding, 2,
48-69.
Diener, E., Emmons, R. A., Larsen, R. J., & Griffin, S.,
1985. The Satisfaction with Life Scale. Journal of
Personality Assessment, 49, 71-75
Diener, E., Lucas, R. E., & Oishi, S., 2005. Subjective
well-being: The science of happiness and life
satisfaction. In C. R. Snyder & S. J. Lopez (Eds.),
Handbook of positive psychology. Oxford University
Press, New York, 2
nd
edition.
Eid, M. & Larsen, R. J., 2008. The Science of Subjective
Well-Being. New York: Guilford Press.
Field, L. K., & Buitendach, J. H., 2011. Happiness, work
engagement and organizational commitment of
support staff at a tertiary education institution in South
Africa, South African Journal of Industrial
Psychology, 37(1), 1-10.
Glatzer, W., Camfield, L., Møller, V., & Rojas, M. (Eds.).,
2015. Global handbook of quality of life: Exploration
of well-being of nations and continents. Springer.
Hombrados-Mendieta, I., & Cosano-Rivas, F., 2011.
Burnout, workplace support, job satisfaction and life
satisfaction among social workers in Spain: A
structural equation model, International Social Work,
56(2), 228-246.
Hurlock, E. B., 1997. Psikologi Perkembangan: Suatu
Pendekatan Sepanjang Rentang Kehidupan. Penerbit
Erlangga. Jakarta.
Idowu, A. O., Ambali, O. I., & Aihonsu, J. O. Y., 2010.
Job satisfaction and turnover among workers of small
scale agro-allied firms in Southwest Nigeria, Asian
Journal of Business and Management Sciences, 1(4),
54-62.
Johnson, J. K. M., Pitt-Catsouphes, M., Besen, E., &
Smyer, M., 2008. Quality of employment and life
satisfaction: A relationship that matters for older
workers, Issue Brief, 13, 1-11.
Jolodar, S. Y. E., 2012. An investigation of social factors
affecting on personnel job satisfaction of remedial
service insurance department, Iranian Journal of
Management Studies, 5(1), 97-110.
Lahamuddin, H., 2013. Life Satisfaction Mahasiswa
Cosplayer, Proposal Metode Penelitian Kualitatif.
Makassar, Universitas Negeri Makassar.
Linsiya, R. W., 2015. Perbedaan Kepuasan Hidup antara
Mahasiswa Strata 1 (S1) dan Strata 2 (S2). Prosiding
Seminar Nasional Psikologi dan Kemanusiaan
Psychology Forum Universitas Muhammadiyah
Malang, ISBN: 978-979-796-324-8.
Luechinger, S., Meier, S., & Stutzer, A., 2008. Why does
unemployment hurt the employed? Evidence from the
life satisfaction gap between the public and the private
sector, Discussion Paper Series, March 2008, 1-35.
ICP-HESOS 2018 - International Conference on Psychology in Health, Educational, Social, and Organizational Settings
196

Lumley, E. J., Coetzee, M., Tiadinyane, R., & Ferreira, N.,
2011. Exploring the job satisfaction and organizational
commitment of employees in the information
technology environment, Southern African Business
Review, 15(1), 100-118.
Oduro-Owusu, K. N., 2010. Factors influencing
construction worker job satisfaction in the Ghanaian
construction industry, Theses of Faculty of
Architecture and Building Technology, Kumasi.
Parvin, M. M., & Kabir, M. M. N., 2011. Factors affecting
employee job satisfaction of pharmaceutical sector,
Australian Journal of Business and Management
Research, 1(9), 113-123.
Pavot, W., & Diener, Ed., 2008. The Satisfaction with Life
Scale and the Emerging Construct of Life Satisfaction,
Journal of Positive Psychology.
Purnomo, A. 2009. Kepuasan Hidup Dan Dukungan
Sosial Lanjut Usia. Perpustakaan Nasional RI Data
Katalog Dalam Terbitan. B2P3KS Press.
Qudsyi, H., Novitasari, R., Ambarito, T. P., Fakhrunnisak,
Y. E., 2015. Kepuasan Hidup Orang Yang Bekerja
Ditinjau dari Faktor Pribadi, Pekerjaan, dan Pasangan.
Prosiding Seminar Ilmiah Konferensi seri ke V.
Yogyakarta: Universitas Islam Indonesia
Saric, Z. R., Zganec, A.B., & Sakic., 2008. Life
satisfaction in adolescents: the effect of perceived
family economics status, self-esteem, and quality of
famiy and peer relationships. Druz Istraz Zagreb God
BR 3 (101), 547-564
Schiraldi, G. R., 2007. 10 Simple Solutions for Building
Self-Esteem, How to End Self Doubt, Gain Confidence
& Create A Positive Self-Image. New Harbinger
Publications. Oakland.
Sousa, L., & Lyubomirsky, S., 2001. Life satisfaction. In
J. Worell (Ed.), Encylopedia of women and gender:
Sex similarities and differences and the impact of
society on gender, Vol. 2, pp. 667-676, Academic
Press. San Diego.
Vittersø, J., 2016. Handbook of Eudaimonic Well-Being,
International handbooks of quality-of-life. Springer
International Publishing.
APPENDIX
Appendix A. Model Fitting
Model
-2 Log
Likelihood
Chi-Square df Sig
Intercept
Only
159.559
Final
118.925 40.643 10 0.000
Appendix B. Test of Parallel Lines
Model
-2 Log
Likelihoo
d
Chi-Square df Sig
Null
Hypothesis
118.925
General
97.293 21.633 40 0.992
Appendix C. Ordinal logistic analysis of age with life satisfaction.
Age
Life Satisfaction Level
1 2 3 4 5 6
Age Category 1
(25 – 30)
Cumulative lo
g
it - -4,536 -1,813 -1,005 0,824 4,609
Cumulative odds - 0,011 0,163 0,366 2,280 58,489
Cumulative
p
ro
p
ortion 1,00 0,99 0,86 0,73 0,30 0,02
Cate
g
or
y
p
robabilit
y
0,01 0,13 0,13 0,43
**
0,29
*
0,02
Age Category 2
(31 – 40)
Cumulative lo
g
it - -5,449 -2,726 -1,918 -0,089 3,156
Cumulative odds - 0,004 0,065 0,147 0,915 23,477
Cumulative
p
ro
p
ortion 1,00 1,00 0,94 0,87 0,52 0,04
Cate
g
or
y
p
robabilit
y
0,00 0,06 0,07 0,35
*
0,48
**
0,04
Age Category 3
(41 – 60)
Cumulative logit - -7,807 -5,084 -4,276 -2,447 0,798
Cumulative odds - 0,000 0,006 0,014 0,087 2,221
Cumulative
p
ro
p
ortion 1,00 1,00 0,99 0,99 0,92 0,31
Cate
g
or
y
p
robabilit
y
0,00 0,01 0,01 0,07 0,27
*
0,31
**
Age Category 4
( > 60)
Cumulative logit - -5,974 -3,251 -2,443 -0,614 2,631
Cumulative odds - 0,003 0,039 0,087 0,541 13,888
Cumulative
p
ro
p
ortion 1,00 1,00 0,96 0,92 0,65 0,07
Cate
g
or
y
p
robabilit
y
0,00 0,003 0,04 0,27
*
0,58
**
0,07
Appendix D. Ordinal logistic analysis of perceived income with life satisfaction.
Perceived Income
Life Satisfaction Level
1 2 3 4 5 6
Income Category 1
(Not Sufficient)
Cumulative lo
g
it - -3,945 -1,222 -0,414 1,415 4,66
Cumulative odds - 0,019 0,295 0,661 4,116 105,636
Cumulative
p
ro
p
ortion 1,00 0,98 0,77 0,60 0,20 0,01
Cate
g
or
y
p
robabilit
y
0,02 0,21 0,17 0,41
**
0,19
*
0,01
Income Category 2
(Sufficient)
Cumulative lo
g
it - -5,974 -3,251 -2,443 -0,614 2,631
Cumulative odds - 0,003 0,039 0,087 0,541 13,888
Cumulative proportion 1,00 1,00 0,96 0,92 0,65 0,07
Cate
g
or
y
p
robabilit
y
0,00 0,003 0,04 0,27
*
0,58
**
0,07
Demographic Factors and Life Satisfaction of Indonesian Christian Private Universities Lecturers: A Descriptive Preliminary Study
197

Appendix E. Ordinal logistic analysis of number of Co-workers with life satisfaction.
Number of Partners
Life Satisfaction Level
1 2 3 4 5 6
No. of Co-Workers Cat
e
1 (1 – 2)
Cumulative lo
g
it - -4,271 -1,548 -0,74 1,089 4,334
Cumulative odds - 0,014 0,213 0,477 2,971 76,249
Cumulative
p
ro
p
ortion 1,00 0,99 0,82 0,68 0,25 0,01
Category probability 0,01 0,16 0,15 0,43
**
0,24
*
0,01
No of Co-workers
Category 2 (3 – 5)
Cumulative lo
g
it - -5,562 -2,839 -2,031 -0,202 3,043
Cumulative odds - 0,004 0,058 0,131 0,817 20,968
Cumulative
p
ro
p
ortion 1,00 1,00 0,94 0,88 0,55 0,05
Category probability 0,00 0,05 0,06 0,33
*
0,50
**
0,05
No. of Co-Workers
Category 3 (6 – 10)
Cumulative lo
g
it - -4,466 -1,743 -0,935 0,894 4,139
Cumulative odds - 0,011 0,175 0,393 2,445 62,740
Cumulative
p
ro
p
ortion 1,00 0,99 0,85 0,72 0,29 0,02
Cate
g
or
y
p
robabilit
y
0,01 0,14 0,13 0,43
**
0,27
*
0,02
No. of Co-Workers
Category 4 (> 10)
Cumulative lo
g
it - -5,974 -3,251 -2,443 -0,614 2,631
Cumulative odds - 0,003 0,039 0,087 0,541 13,888
Cumulative
p
ro
p
ortion 1,00 1,00 0,96 0,92 0,65 0,07
Cate
g
or
y
p
robabilit
y
0,00 0,003 0,04 0,27
*
0,58
**
0,07
Appendix F. Ordinal logistic analysis of marital status with life satisfaction.
Marital Status
Life Satisfaction Level
1 2 3 4 5 6
Marital Status Category
1 (Single)
Cumulative lo
g
it - -6,907 -4,184 -3,376 -1,547 1,689
Cumulative odds - 0,001 0,015 0,034 0,213 5,463
Cumulative
p
ro
p
ortion 1,00 1,00 0,98 0,97 0,82 0,15
Cate
g
or
y
p
robabilit
y
0,00 0,01 0,02 0,14 0,67
**
0,15
*
Marital Status Category
2 (Married)
Cumulative lo
g
it - -5,974 -3,251 -2,443 -0,614 2,631
Cumulative odds - 0,003 0,039 0,087 0,541 13,888
Cumulative
p
ro
p
ortion 1,00 1,00 0,96 0,92 0,65 0,07
Cate
g
or
y
p
robabilit
y
0,00 0,003 0,04 0,27
*
0,58
**
0,07
Appendix G. Ordinal logistic analysis of spouse status with life satisfaction.
Spouse Status
Life Satisfaction Level
1 2 3 4 5 6
Spouse Status Category 1
(Not Working)
Cumulative logit - -4,779 -2,056 -1,248 0,581 3,826
Cumulative odds - 0,008 0,128 0,287 1,788 45,879
Cumulative proportion 1,00 0,99 0,89 0,78 0,36 0,02
Category probabilit
y
0,01 0,11 0,11 0,42
**
0,34
*
0,02
Spouse Status Category 2
(Working)
Cumulative logit - -5,974 -3,251 -2,443 -0,614 2,631
Cumulative odds - 0,003 0,039 0,087 0,541 13,888
Cumulative proportion 1,00 1,00 0,96 0,92 0,65 0,07
Category probabilit
y
0,00 0,003 0,04 0,27
*
0,58
**
0,07
Appendix H. Ordinal logistic analysis of health condition with life satisfaction.
Health Condition
Life Satisfaction Level
1 2 3 4 5 6
Health Conditio
n
Category 1 (Good)
Cumulative lo
g
it - -7,438 -4,715 -3,907 -2,078 1,167
Cumulative odds - 0,001 0,009 0,020 0,125 3,212
Cumulative
p
ro
p
ortion 1,00 1,00 0,99 0,98 0,89 0,24
Cate
g
or
y
p
robabilit
y
0,00 0,01 0,01 0,09 0,65
**
0,24
*
Health Conditio
n
Category 2 (Not Good)
Cumulative lo
g
it - -5,974 -3,251 -2,443 -0,614 2,631
Cumulative odds - 0,003 0,039 0,087 0,541 13,888
Cumulative
p
ro
p
ortion 1,00 1,00 0,96 0,92 0,65 0,07
Cate
g
or
y
p
robabilit
y
0,00 0,003 0,04 0,27
*
0,58
**
0,07
ICP-HESOS 2018 - International Conference on Psychology in Health, Educational, Social, and Organizational Settings
198
