
The Protective Efficacy of Kelakai (Stenochlaena Palustris) on
Cadmium-induced Glucose Metabolism Alteration In Vitro
Eko Suhartono
1,2
, Ika Kustiyah Oktaviani
3
, Adenan
4
, Iskandar Thalib
5
1
Department of Medical Chemistry/Biochemistry, Faculty of Medicine, Lambung Mangkurat University, Ahmad Yani Street
36
th
Km, Banjarbaru, South Kalimantan, Indonesia
2
Center of Excellent: Research Consortium for Sustainable Tropical Forest Management, Banjarbaru, South Kalimantan,
Indonesia
3
Department of Anatomy Pathology, Faculty of Medicine, Lambung Mangkurat University, Banjarmasin, South
Kalimantan, Indonesia
4
Department of Public Health, Faculty of Medicine, Lambung Mangkurat University, Banjarmasin, South Kalimantan,
Indonesia
5
Department of Child Health, Faculty of Medicine, Lambung Mangkurat University, Banjarmasin, South Kalimantan,
Indonesia
Keywords: Cadmium, Glucose Metabolism, Stenochlaena palustris
Abstract: The objectives of this study were to determine the protective effect of kelakai (Stenochlaena palustris)
leaves extract on cadmium (Cd)-induced glucose metabolism alteration in vitro. The protective effect of
plant extracts extract was determined by assessing the activity of pancreas amylase and liver glucokinase,
the concentration of liver glucose, glycogen, and methylglyoxal (MG). In this present study, the liver and
pancreas samples were obtained from 32 old male Rattus novergicus. Each model then divided into 4 groups
consisting of: pancreas or liver + 0.3 mg/l CdSO
4
(T1); pancreas or liver + 0.3 mg/l CdSO
4
+ 5 mg/l leaves
extract (T2); pancreas or liver + 0.3 mg/l CdSO
4
+ 10 mg/l leaves extract (T3); and pancreas or liver + 0.3
mg/l CdSO
4
+ 15 mg/l leaves extract (T4). Results of this present study shows that the administration of S.
palustris leaves extract could significantly decreased the pancreas amylase activity, the level of liver
glucose and MG, and significantly increase the liver glucokinase activity, and the level of liver glycogen (P
< 0.05). In conclusions, the results of this present study indicated that the administration of S. palustris
leaves extract could improve the glucose metabolism alteration by Cd.
1 INTRODUCTION
Industrialization and urbanization development
have resulted in increasing of environment
contamination by several toxic substances, including
heavy metal (Anyakora et al., 2013). Among heavy
metals, cadmium (Cd) is one of the heavy metal that
is very toxic to human body even at low
concentration (Rahman et al., 2014). If Cd enters the
human body, it could irreversibely accumulates and
affect some vitals organs such as liver, pancreas,
kidney, and nervous system (Suhartono et al., 2015a;
Suhartono et al., 2016; Khorasgani et al., 2013).
Also, Cd could affect some metabolism pathway
including glucose metabolism (Suhartono et al.,
2015b).
It has been found that Cd could decreased the
glycogen reserves and increased the glucose levels
in liver homogenate (Suhartono et al., 2015b). Also,
Bashir et al. (2014) study have shown that Cd could
increased the level of plasma glucose and decreased
the level of liver glycogen. Several investigators
have confirmed that Cd could affect the glucose
metabolism via several pathway. Cd altered activites
of carbohydrate metabolizing enzymes, including
hexokinase, glucokinase, phosphofructokinase and
amylase (Navaneethan et al., 2014; Bajo et al., 2014;
Slencu et al., 2014). Also, Cd could induced the liver
and pancreas cells damaged resulted in glucose
metabolism alteration (Khorasgani et al., 2014;
Suhartono et al., 2015b).
It has been long appreciated that Cd toxicity
could prevent by a number of natural antioxidants.
156
Suhartono, E., Oktaviani, I., Adenan, . and Thalib, I.
The Protective Efficacy of Kelakai (Stenochlaena Palustris) on Cadmium-induced Glucose Metabolism Alteration In Vitro.
DOI: 10.5220/0008788101560162
In Proceedings of the 2nd Syiah Kuala International Conference on Medicine and Health Sciences (SKIC-MHS 2018), pages 156-162
ISBN: 978-989-758-438-1
Copyright
c
2020 by SCITEPRESS – Science and Technology Publications, Lda. All rights reserved
In particular, kelakai (S. palustris), a local plants that
growth in Indonesia, especially South Kalimantan
known to be rich source of antioxidants. Our
previous reports shows that S. palustris contains
flavonoid and possess several antioxidants activities
(Suhartono et al., 2012). Also, another previous
study suggest that the S. palustris extracts can slow
down the formation of MG, AOPPs, and PC in
bovine serum albumin in vitro (Suhartono et al.,
2016).
In view of the antioxidant properties of S.
palustris, it is noteworthy to consider that S.
palustris might bring out beneficial effects on Cd-
induced glucose metabolism alteration in vitro.
Therefore, the present study has been designed to
evaluate the protective efficacy of S. palustris on
Cd-induced glucose metabolism alteration in vitro.
2 MATERIAL AND METHODS
2.1 Collection and Extraction of Plant
Materials
The fresh leaves of S. palustris were obtained from
Gambut subdistrict, South Kalimantan, Indonesia in
February 2016 and identified by Department of
Biology, Pharmacy Study Program, Faculty of
Mathematics and Natural Sciences, Lambung
Mangkurat University, South Kalimantan, Indonesia.
The plant parts were separated, shade dried and
powdered. Then, Powdered material of S. palustris
leaves is taken for maceration with 150 ml of
distilled water for 1 hr on rotary shaker. The extract
then filtered using muslin cloth and Whatman no.1
filter paper and concentrated by evaporation on
water bath (Suhartono et al., 2012).
2.2 Experimental Section
The liver and pancreas samples were obtained from
32 old male rats (Rattus novergicus) with 2-3-
month-old, weighing 200-250 g. The liver and
pancreas samples were taken surgically with
ketamine as anaesthesia. Experiments performed
complied with the rulings of the Institute of
Laboratory Animal Resources, Commission on Life
Sciences, National Research Council and were
approved by the Ethical Committee of the Faculty of
Medicine, University of Lambung Mangkurat,
Banjarbaru, South Kalimantan, Indonesia.
The liver and pancreas samples then fixed in
phosphate buffer solutions at pH 7.0. The liver and
pancreas samples for analysis were homogenized,
respectively. The homogenates were centrifuged at
3500 rpm for 10 min and the top layer was taken and
stored until it uses.
Liver and pancreas samples were divided into 4
groups with 6 samples of in each group. Group 1
(T1): liver or pancreas homogenates + 0.3 mg/l
cadmium sulphate (CdSO
4
); group 2 (T2): liver or
pancreas homogenates + 0.3 mg/l CdSO
4
+ 5 mg/l of
aqueous extracts of S. palustris; group 3 (T3): liver
or pancreas homogenates + 0.3 mg/l CdSO
4
+ 10
mg/l of aqueous extracts of S. palustris; group 4
(T4): liver or pancreas homogenates + 0.3 mg/l
CdSO
4
+ 15 mg/l of aqueous extracts of S. palustris.
Each solution then incubated at 37°C for 1 hour.
After incubation, pancreas amylase activity, liver
glucokinase activity, liver glycogen, glucose, and
MG concentration was estimated.
2.3 Pancreas Amylase Activity Analysis
The pancreas amylase activity was measured
according to the Smith and Roe method (Smith and
Roe, 1949). Pipette 5 ml of 1.2% starch solution (60
mg) at approximately 90
o
C, 3 ml of phosphate
buffer, and 1 ml of 0.5 M sodium chloride into each
of two test-tubes. Into a third tube (C), the blank,
pipette 5 ml of distilled water, 3 ml of phosphate
buffer, and 1 ml of 0.5 M sodium chloride. Place all
tubes in a water bath at 37oC until they have reached
the temperature of the water bath. To Tube A, add 1
ml of enzyme solution. Keep all tubes in the water
bath for exactly 30 minutes. Promptly add 2 ml of
N-hydrochloric acid to each tube. This brings the pH
below 2, a step that stops amylase action in the
digest tube and prevents action of the enzyme next
added to the control tube. Add 1 ml of enzyme
solution to tubes B (control) and C (blank) and mix
thoroughly. Pipette 2 ml of each of these reaction
mixtures into appropriately labelled 500 ml
volumetric flasks containing about 400 ml of
distilled water and 5 ml of N-hydrochloric acid. Add
1 ml of iodine reagent to each flask and make up to
volume. The resulting blue solutions are decanted
into cuvettes and read in a photoelectric calorimeter
at a wave-length of 620 mp. Solution from Tube B
gives the iodine colour value without amylase action
and solution from Tube A gives the value after
enzyme action.
Calculations – Let D = 2 – log G = Optical Density
(D of Control) – (D of Digest) X 60 = mg of starch hydrolysed
(D of Control)
The Protective Efficacy of Kelakai (Stenochlaena Palustris) on Cadmium-induced Glucose Metabolism Alteration In Vitro
157

The amylase unit is defined as the amount of
enzyme that under the conditions of this procedure,
with 60 mg. of starch present, will hydrolysed 10
mg. of starch in 30 minutes to a stage at which no
colour is given with iodine at 620 rnp. The definition
of this amylase unit was established to make the unit
conform as closely as possible to the units of
methods in general use.
2.4 Liver Glucokinase Activity
Analysis
Glucose concentration (100 mM, 200 mM, 300 mM,
400 mM and 500 mM), each concentration was
taken added 3 ml and 3 ml of phosphate buffer pH 7.
Furthermore, mixed until homogeneous. A total of 1
ml homogenate is added to each mixture, and then
measured as the levels of glucose [G0]. After 20
minutes, each mixture of glucose is measured again
[G1] by the method of hydrolytic Duboie's. The rate
of oxidation of glucose by glucokinase (v) is
expressed in changes in the concentration of glucose
per minute (Bustos and Iglesias, 2000).
2.5 Liver Glycogen Level Analysis
This assay was performed as described by Bidinotto
et al. (Bidinotto et al., 1997) Samples of liver were
quickly separated from freeze tissues and transferred
to essay tubes containing 1.0 ml of 6 mol/l
potassium hydroxide (KOH). The tubes were
transferred to a boiling water bath and left along 3-5
min for complete dissolution. Aliquots of the
resultant solution (250 μl) were added to 3 ml of
95% ethanol-water and after mixing, 100 μl of 10%
potassium sulphate (K
2
SO
4
) was appended. A
cloudy white precipitate was formed and the
supernatant was discharged after centrifuging at
3000 rpm for 3 min. It was added 2.5 ml of distilled
water to the precipitate, which was promptly
dissolved. Suitable aliquots from such solution were
employed to Dubois reaction. Glycogen
concentration is expressed in μmol of glucosil-
glucose per g of wet tissue.
2.6 Liver Glucose Level Analysis
Liver tissues were homogenized in 50%
Trichloroacetic Acid (TCA), keeping the proportion
of 100 mg per 1.0 ml of TCA. After centrifuging for
5 min at 5000 rpm, the contents of glucose were
determined in the supernatant. Homogenate samples
were submitted to the same procedure, keeping the
same proportions (100 μl of homogenate/1.0 ml
TCA). Glucose was determined by Dubois
hydrolytic method. It consists of a suitable aliquot of
glucose into a final volume of 0.5 ml added of 0.7
ml of 3% phenol. After shaking, 2 ml of
concentrated sulfuric acid (H
2
SO
4
) was added into
one stroke developing strong heat of reaction. The
product was determined at 540 nm in a single
colorimeter (Bidinotto et al., 1997).
2.7 Liver MG Level Analysis
MG compounds are measured using modified
Dinitro-Phenyl hydrazine (DNPH) method
(Suhartono et al., 2014). From each test solution, 0.5
ml solution was taken, and then each solution was
divided to 2 tubes with 0.25 ml volume in each tube.
The first tube was the sample (A) and the second
tube was blank (B) solution. Then 1 ml DNPH were
added into each A tube and 1 ml HCl 2.5 mol/l into
each B tube. The tubes were incubated for 45 min in
room temperature and protected from light, and then
tubes were shaken with a vortex for 15 min. The
next step is added 1 ml of TCA 20% into each tube
(A and B), then the tubes were incubated for 5 min.
Tubes were centrifuged for 5 min with 1400 rpm of
speed to separate the supernatant. The pellets are
centrifuged and washed three times with the addition
of 1 ml ethanol-ethyl acetate. The last step was
added 1 ml of urea 9 mol/l and incubates the
solution for 10 min in 37
o
C while it was shaken. The
solution was centrifuged again for 5 min in 1400
rpm of speed. Then the absorbance of tube A and B
were measured at λ = 390 nm (ΔA).
Furthermore, a total of 25 μl of the homogenate
was added to 350 μl DNPH (0.1% DNPH in 2 mol/l
HCl) and then 2.125 ml distilled water was added. It
is incubated for 15 min at 37°C, then 1.5 ml NaOH
10% was added. Absorbance was measured at λ =
576 nm (A1).
MG level was calculated following to equation:
MG Level (%) = A1 X 100%
ΔA
2.8 Statistical Analysis
The results were expressed as mean ± SE for six
replicates. Significance of mean differences of all
parameters between group of treatments were
SKIC-MHS 2018 - The 2nd Syiah Kuala International Conference on Medicine and Health Sciences
158

statistically compared using Kruskal-Wallis test and
followed by Mann-Whitney test for multiple range
test. Significance was set at P<0.05. The software
used for the data analysis were the Statistical
Package for the Social Sciences (SPSS) version 16.0
and Microsoft Excel 2010 for Windows Vista.
3 RESULTS
This present study which was undertaken to assess
the protective effects of S. palustris on Cd-induced
glucose metabolism alteration in in vitro condition.
Several parameters were measured such as, amylase
pancreas, liver glucose, glycogen, and MG level, and
liver glucokinase activity.
Figure 1 shows the mean comparison for
pancreas amylase activities between group of
treatments. The activity of pancreas amylase is
higher in T1 group than all group of treatments.
Treatment with S. palustris led to lower pancreas
amylase activity, with the lowest activity is in T4
group. Kruskal-Wallis test results shows that all
groups of treatment are significantly (p<0.05)
different. Then, we used Mann-Whitney test for
multiple comparison test. b, c, d, and e indicate that
significant differences compared with T1, T2, T3,
and T4 group, respectively. Mann-Whitney test
results show that there is a significant difference
between a group of treatments except between T1-
T2.
Figure 1: Comparison of pancreas amylase activity
between group of treatments. Values are mean ± SEM of
six replicates in each group treatments. b: Significantly
different when compared to Group T1; c: Significantly
different when compared to Group T2. d: Significantly
different when compared to Group T3; and e: Significantly
different when compared to Group T4. Comparison of
variables between the groups was performed with
Kruskal-Wallis test and followed by Mann-Whitney U test
(P<0,05).
Figure 2 shows the mean comparison for liver
glucokinase activities between group of treatments.
The activity of liver glucokinase were lower in T1
group compared with the all group of treatments.
Also, the result shows that the activity of liver
glucokinase seems higher, with the highest activity
is in group T4. Kruskal-Wallis test results shows that
all groups of treatment are significantly (p<0.05)
different. Also, b, c, d, and e indicate the significant
differences compared to T1, T2, T3, and T4 group,
respectively. Mann-Whitney test results show that
there is a significant difference between a group of
treatments except between T2-T3.
Figure 2: Comparison of liver glucokinase activity
between group of treatments. Values are mean ± SEM of
six replicates in each group treatments. b: Significantly
different when compared to Group T1; c: Significantly
different when compared to Group T2. d: Significantly
different when compared to Group T3; and e: Significantly
different when compared to Group T4. Comparison of
variables between the groups was performed with
Kruskal-Wallis test and followed by Mann-Whitney U test
(P<0,05).
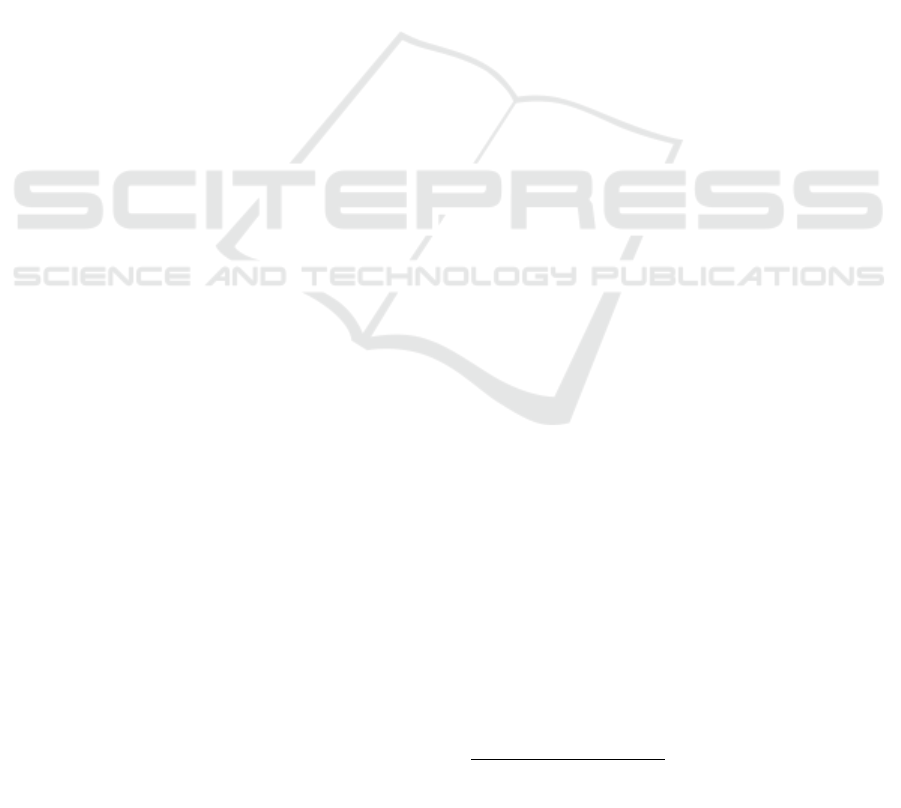
Figure 3 represented the mean values ± standard
error (mean ± SEM) of liver glucose concentration.
Dispersion of measured values around each mean
varied from 23.661 to 42.883 mM. The data from
figure 3 shows that T1 group have a higher liver
glucose concentration than another group of
treatments, while T2-T4 group have a lower liver
glucose concentration than T1 group. Kruskal-
Wallis test results shows that all groups of treatment
are significantly (p<0.05) different. The letters
indicate the multiple comparison using Mann-
Whitney test as mentioned above. Mann-Whitney
test results show that there is a significant difference
between a group of treatments except between T1-
T2, and T2-T3.
Figure 4 represented the mean values ± standard
error (mean ± SEM) of liver glycogen concentration.
Dispersion of measured values around each mean
varied from 0.600 to 2.599 glucosil-glucose µmol/gr
The Protective Efficacy of Kelakai (Stenochlaena Palustris) on Cadmium-induced Glucose Metabolism Alteration In Vitro
159
wet tissue. The data from figure 4 shows that T1
group have a lower liver glycogen concentration
than another group of treatments, while T2-T4 group
have a higher liver glycogen concentration than T1
group. Kruskal-Wallis test results shows that all
groups of treatment are significantly (p<0.05)
different. Also, the letters indicate Mann-Whitney
test results. Mann-Whitney test results show that
there is a significant difference between a group of
treatments except between T1-T2, and T3-T4.
Figure 3: Comparison of liver glucose level between group
of treatments. Values are mean ± SEM of six replicates in
each group treatments. b: Significantly different when
compared to Group T1; c: Significantly different when
compared to Group T2. d: Significantly different when
compared to Group T3; and e: Significantly different when
compared to Group T4. Comparison of variables between
the groups was performed with Kruskal-Wallis test and
followed by Mann-Whitney U test (P<0,05).
Figure 4: Comparison of liver glycogen level between
group of treatments. Values are mean ± SEM of six
replicates in each group treatments. b: Significantly
different when compared to Group T1; c: Significantly
different when compared to Group T2. d: Significantly
different when compared to Group T3; and e: Significantly
different when compared to Group T4. Comparison of
variables between the groups was performed with
Kruskal-Wallis test and followed by Mann-Whitney U test
(P<0,05).
Figure 5 shows the mean comparison for liver MG
level between group of treatments. The level of MG
was higher in T1 group than another group of
treatments. Also, the result shows that the level of
liver MG seems lower, with the lowest level are in
group T3 and T4. Kruskal-Wallis test results shows
that all groups of treatment are significantly
(p<0.05) different. The letters indicate Mann-
Whitney test results. Mann-Whitney test results
show that there is a significant difference between a
group of treatments except between T1-T2, and T3-
T4.
2.2.1
Title
Figure 5: Comparison of liver MG level between group of
treatments. Values are mean ± SEM of six replicates in
each group treatments. b: Significantly different when
compared to Group T1; c: Significantly different when
compared to Group T2. d: Significantly different when
compared to Group T3; and e: Significantly different when
compared to Group T4. Comparison of variables between
the groups was performed with Kruskal-Wallis test and
followed by Mann-Whitney U test (P<0,05).
4 DISCUSSION
It is widely known that the pancreas and liver play
an important role in glucose metabolism (Pap, 2004;
Kalsbeek et al., 2014). Pancreas secrete hormones
such as insulin and glucagon, and several enzymes
such as, amylase (Pap, 2004), while liver balancing
glucose entry into and out of the circulation
(Kalsbeek et al., 2014; Bechmann et al., 2012).
Thus, the effect of protective agents on tissues such
as the liver and pancreas that regulate glucose
metabolism is an interesting area to explore.
In this present study, we investigate the
protective effect of S. palustris on Cd-induced
glucose metabolism in vitro by measuring several
parameters such as pancreas amylase activity, liver
glucokinase activity, liver glucose, glycogen, and
MG level. From the result, in can be seen that Cd
exposure increase amylase activity. The results of
our studies are supported by the other research by
SKIC-MHS 2018 - The 2nd Syiah Kuala International Conference on Medicine and Health Sciences
160

Khorasgani et al. (2013). Results of that study
showed that Cd could increase the amylase activity
level in a pancreas of rats. Also, El-Aziz and El-
Mottaleb (2015) results showed the same effect but
in amylase activity in a serum of rats. The increasing
of amylase activity has known as a result from
pancreatitis or from damage amylase secretory cells
by Cd (Abedi et al., 2013). Result of this present
study also suggested that S. palustris extract shows a
protective effect especially in higher concentration.
This protective effect might be the presence of
phenolic compounds in S. palustris extracts. These
results are consistent with our previous report which
found that the S. palustris extracts comprise
flavonoid and possess some antioxidant activity
(Suhartono et al., 2012). This could inhibit the
pancreatitis and chelate some metal including Cd to
improve the amylase activity.
Results of this present study also indicated that
Cd exposure led to increase the glucose level and
decrease the glycogen level in a liver of rats. These
results are consistent with several previous reports
(Suhartono et al., 2015b; Bashir et al., 2014; Bhati et
al., 2014; Al Rikabi and Jawad, 2013; Sobha et al.,
2007). According to several previous reports, Cd
could induce the liver cells damage by interrupt the
pro- and anti-oxidant balance (Matovic et al., 2011;
Skipper et al., 2016; Suhartono et al., 2013). The
result of this present study indicated that S. palustris
extract could improve the level of glucose and
glycogen in liver cells homogenate, again better
protective effect in greater kelakai concentration.
This result was similar with our previous reports but
with bark and leave of Nothaphoebe coriacea extract
(Suhartono et al., 2016). The reason why S. palustris
have a protective effect to inhibited the Cd-induced
glucose metabolism alteration may be the same
reason as mentioned in the previous paragraph in
this section.
According to the result of this present study, Cd
exposure could affect the MG level in liver cells
homogenate. These results contrast with our
previous report. Our previous report show that Cd
could decrease the MG level in liver cells
homogenate (Suhartono et al., 2015). However, in
another several previous reports Cd could induced
the formation of MG both in in vitro and in vivo
condition, but in another organs, such as kidney
(Suhartono et al., 2016; Suhartono et al., 2014;
Husna et al., 2014). It is well known that MG is the
precursor of quantitatively important advanced
glycation end products (AGEs) (Rabbani and
Thornalley, 2014). MG is form via several
mechanism, including auto-oxidation of glucose,
which leads to glyoxal formation, decomposition of
amadori products (3-deoxyglucosone) and
fragmentation of glycerinaldehyde-3-phosphate and
dihydroxyacetone phosphate during glycolysis
(Jorgens et al., 2015).
5 CONCLUSIONS
S. palustris extracts possesses a protective effect
against Cd-induced glucose metabolism alteration in
vitro. The protective effects might be some
phytochemical constituents contained in S. palustris
extracts. Further studies will be worthwhile to
explore the exact phytochemicals constituents in S.
palustris extract and molecular protective effect
mechanism S. palustris extract.
REFERENCES
Abedi Z, Hasantabar F, Khalesi MK, Babaei S. 2013.
Effect of sublethal concentrations of cadmium, lead
and chromium on some enzymatic activities of
common carp; Cyprinus carpio. World Journal of
Zoology, 8 (1), pp. 98-105.
Al Rikabi AA and Jawad AADH. 2013. Protective effect
of ethanolic ginger extract against cadmium toxicity in
male rabbits. Basrah Journal of Veterinary Research,
12, pp. 13-29.
Anyakora C, Ehianeta T, Umukoro O. 2013. Heavy metal
levels in soil samples from highly industrialized Lagos
environment. African Journal of Environmental
Science and Technology, 7 (9), pp. 917-924.
Bajo MJR, Atauri P, Ortega F, Westerhoff HV, Gelpi JL,
Centelles JJ, Cascante M. 2014. Effects of cadmium
and mercury on the upper part of skeletal muscle
glycolysis in mice. PLoS One, 9(1), e80018. DOI:
10.1371/journal.pone.0080018.
Bashir N, Manoharan V, Prabu SM. 2014. Ameliorative
effects of grape seed proanthocyanins on cadmium
induced metabolic alterations in rats. International
Journal of Biological Research, 2, pp. 28-34.
Bechmann LP, Hannivoort RA, Gerken G, Hotamisligil
GS, Trauner M, Canbay, A. 2012. The interaction of
hepatic lipid and glucose metabolism in liver diseases.
Journal of Hepatology, 56, pp. 952–964.
Bhati Sl, Ranga D, Meena DC, Agarwal M, Chakrawarti
A, Purohit RK. 2014. Ameliorative effect of Emblica
officinalis in mice liver. World Journal of
Pharmaceutical Research, 3, pp. 846-863.
Bidinotto PM, Moraes G, Souza RHS. 1997. Hepatic
glycogen and glucose in eight tropical fresh water
teleost fish: a procedure for field determinations of
micro samples. B Tec Cepta Pirassununga, 10, pp. 53-
60.
The Protective Efficacy of Kelakai (Stenochlaena Palustris) on Cadmium-induced Glucose Metabolism Alteration In Vitro
161

Bustos DM and Iglesias AA. 2000. The kinetic properties
of liver glucokinase and its function in glucose
physiology as a model for the comprehensive study of
enzymes' kinetic parameters and reversible inhibitors.
Biochemistry and Molecular Biology, 28 (6), pp. 332-
337.
El-Aziz EA and El-Mottaleb NAA. 2015. The potential
protective effects of tetrahydrobiopterin on cadmium-
induced pancreatic changes in male rats. Bulletin
Egypt Social Physiological Science, 35 (3), pp. 62-74.
Husna AH, Ramadhani EA, Eva DT, Yulita AF,
Suhartono E. 2014. The role formation of
methylglyoxal, carbonyl compound, hydrogen
peroxide and advance oxidation protein product
induced cadmium in ovarian rat. International Journal
of Chemical Engineering and Application, 5 (4), pp.
319-323.
Jorgens, K, Stoll SJ, Pohl J, Fleming TH, Sticht C,
Nawroth PP, Hammes HP, Kroll J. 2015. High tissue
glucose alters intersomitic blood vessels in zebrafish
via methylglyoxal targeting the VEGF receptor
signalling cascade. Diabetes, 64, pp. 213-225.
Kalsbeek, Andries, Fleur S, Fliers E. 2014. Circadian
control of glucose metabolism. Molecular Metabolism,
3(4), pp. 372–383.
Khorasgani EM, Haghdoost IS, Sedaghat R, Mortazavi P,
Roghani M. 2013. Satureja hortensis L. alcoholic
extract ameliorates cadmium-induced pancreatic
damage in rats. Middle-East Journal of Science
Research, 15 (1), pp. 32-35.
Matovic V, Buha A, Bulat Z, Dukic-Cosic D. 2011.
Cadmium toxicity revisited: focus on oxidative stress
induction and interactions with zinc and magnesium.
Arhiv Hig Rada Toksikol, 62(1), pp. 65-75.
Navaneethan D and Rasool MK. 2014. An experimental
study to investigate the impact of p-coumaric acid, a
common dietary polyphenol, on cadmium chloride-
induced renal toxicity. Food Function, DOI:
10.1039/c4fo00346b.
Pap A. 2004. Effects of insulin and glucose metabolism on
pancreatic exocrine function. International Journal of
Diabetic Metabolism, 12, pp. 30-34.
Rabbani N and Thornalley PJ. 2014. The critical role of
methylglyoxal and glyoxalase 1 in diabetic
nephropathy. Diabetes, 63, pp. 50-52.
Rahman M, Gul S, Ajmal M, Iqbal A, Achakzai A. 2014.
Removal of cadmium from aqueous solutions using
excised leaves of quetta pine (Pinus halepensis mill.).
Bangladesh Journal of Botany, 43 (3), pp. 277-281.
Skipper A, Sims JN, Yedjou CG, Tchounwou PB. 2016.
Cadmium chloride induces DNA damage and
apoptosis of human liver carcinoma cells via oxidative
stress. International Journal of Environmental
Research and Public Health, 13 (88), pp. 1-10.
Slencu BG, Ciobancu C, Solcan C, Anton A, Ciobanu St,
Solcan Gh, Cuciureanu R. 2014. Effect of selenium
supplementation on serum amylase, lactate
dehydrogenase and alkaline phosphatase activities in
rats exposed to cadmium or lead. Agronomical
Research in Moldavia, XLVII (4), pp. 160.
Smith BW and Roe JH. 1949. Photometric method for the
determination of α-amylase in blood and urine, with
use of starch-iodine colour. Journal of Biological
Chemistry, 179, pp. 53-59.
Sobha K, Poornima A, Harini P, Veeraiah K. 2007. A
study on biochemical changes in the fresh water Fish,
Catla catla (Hamilton) exposed to the heavy metal
toxicant cadmium chloride. Kathmandu University
Journal of Sciences Engineering and Technology, I,
pp. 1-11.
Suhartono E, Viani E, Rahmadhan MA, Gultom IS,
Rakhman MF, Indrawardhana D. 2012. Screening of
medicinal plant for total flavonoid and antioxidant
activity in South Kalimantan of Indonesian.
International Journal of Chemical Engineering and
Applications, 3 (4), pp. 297-299.
Suhartono E, Triawanti, Yunanto A, Firdaus RT, Iskandar.
2013. Chronic cadmium hepatooxidative in rats:
treatment with haruan fish (Channa striata) extract.
APCBEE Procedia, 5, pp. 441-445.
Suhartono E, Triawanti, Leksono AS, Djati MS. 2014. The
role of cadmium in protein glycation by glucose:
Formation of methylglyoxal and hydrogen peroxide in
vitro. Journal of Medical and Biological Engineering,
3, pp. 59-62.
Suhartono E, Iskandar, Hamidah S, Arifin YF. 2015a.
Phytochemical constituents’ analysis and
neuroprotective effect of leaves of gemor
(Nothaphoebe Coriacea) on cadmium-induced
neurotoxicity in rats: An in-vitro study. International
Journal of Toxicological and Pharmacological
Research, 7(6), pp. 297-302.
Suhartono E, Santosa PB, Iskandar. 2015b. Ameliorative
effects of different parts of gemor (Nothaphoebe
coriacea) on cadmium induced glucose metabolism
alteration in vitro. International Journal of
Pharmaceutical and Pharmacological Science, 7 (11),
pp. 1-4.
Suhartono E, Bahriansyah M, Triawanti. 2016. The
inhibition effect of kelakai (Stenochlaena palustris)
extract on cadmium-induced glycation and fructation
in-vitro. International Journal of Pharmaceutical and
Clinical Research, 8 (4), pp. 248-253.
SKIC-MHS 2018 - The 2nd Syiah Kuala International Conference on Medicine and Health Sciences
162
