
Analysis of Public Sentiment towards East Java Governor Election
2018 on Twitter using Text Mining
Fajar Darwis Dzikril Hakimi
1
, Ahmad Zainul Hamdi
2
, Nurissaidah Ulinnuha
1
, Ahmad Hanif
Asyhar
1
, and Yuniar Farida
1
1
Department of Mathematics, State Islamic University Sunan Ampel Surabaya, Jl. Ahmad Yani 117, Surabaya
2
Department of Religion Studies, State Islamic University Sunan Ampel Surabaya, Jl. Ahmad Yani 117, Surabaya
yuniar_farida@uinsby.ac.id
Keywords: Sentiment Analysis, East Java Governor Election, Naïve Bayes Classifier.
Abstract: Governor elections were held together in most of Indonesian regions in 2018, including East Java. In pre-
implementation of East Java Governor election, there were several public opinions which had positive and
negative sentiment on Twitter. Those opinions can be used as parameter to evaluate the strength of each
candidate. The purpose of this research is to know the tendency of public opinion about East Java Governor
election on Twitter. In this research, there are several steps to do, i.e., crawling data, labelling data, removing
data, pre-processing data, building classification system using Naïve Bayes, and applying the system on more
Twitter data. The word weighting methods used are TF and TF-IDF. The result shows that TF word weighting
method has better performance. This research has two results of system performance for each candidate. Based
on data of the first candidate, the result of accuracy, precision, recall, and f-measure were respectively 98.99%,
93.44%, 97.78%, and 95.56%. Based on data of the second candidate, the result of accuracy, precision, recall,
and f-measure were 98.95%, 97.78%, 98.55%, and 98.17% respectively. Based on data from Twitter, East
Java citizens had tendency to choose the first candidate.
1 INTRODUCTION
Technological advancements in computer science
make exchange of information become easier
(Wongso, et al., 2017). Nowadays, the easiest way to
exchange information is through social media. Social
media, such as Facebook and Twitter, can facilitate
users, not only to interact with one another, but also
to read and share news, discuss important things, like
politics and others (Yaqub, et al., 2017). This
certainly leads to the abundance of information on
social media. There are several types of social media
that are often used as a tool to exchange information,
one of which is Twitter. One way to transform
abundant data into useful information is by
classifying information. Therefore, it is necessary to
create a system that can classify opinions
automatically because manual classification takes a
long time and it is not effective.
Some producers, service providers, and
government agencies take advantages from the
available information on social media to make
improvements to the products or policies that have
been made (Liu, 2012). In addition, social media also
have become an important channel for political figure
to address the public, making them accessible to their
voters (Kusen & Strembeck, 2018). Information
available on social media can also be used to find out
the electability of a political figure. The most
considered factor in influencing the electability of
political figure is the movement of loyalists
(Espinall, et al., 2017). One way to express the
support of loyalists is through social media.
Therefore, in the period before the election is held,
the opinion on social media becomes very important.
In 2018, governor elections were held
simultaneously in most regions of Indonesia,
including East Java. In East Java, there were each two
candidates for governor and vice governor. The first
candidate was Khofifah Indar Parawansa and
Emil Elestianto Dardak, while the second
candidate was Saifullah Yusuf and Puti Guntur
Soekarno. In pre-implementation of East Java
governor elections, there were various kinds of public
opinion which had positive and negative sentiments
on Twitter. That public opinion can be used as a
262
Hakimi, F., Hamdi, A., Ulinnuha, N., Asyhar, A. and Farida, Y.
Analysis of Public Sentiment towards East Java Governor Election 2018 on Twitter using Text Mining.
DOI: 10.5220/0008905900002481
In Proceedings of the Built Environment, Science and Technology International Conference (BEST ICON 2018), pages 262-267
ISBN: 978-989-758-414-5
Copyright
c
2022 by SCITEPRESS – Science and Technology Publications, Lda. All r ights reserved

parameter to evaluate the strength of each candidate.
Therefore, by classifying opinions on Twitter relating
to East Java governor election, information on the
strength of each candidate will be obtained based on
Twitter.
Problems will arise when opinions are classified
manually. It takes a long time to classify opinion on
Twitter and it is certainly not effective, considering
that the evaluation of the campaign's performance
must be carried out as quickly and effectively as
possible. To solve this problem, a system that
automatically classifying the opinion about East Java
governor election on Twitter will be created.
Algorithms that are often used to classify text
documents and have good results are Naive Bayes
classifier and support vector machine (Aggarwal &
Zhai, 2013). In addition, the research conducted by
Ghulam Asrofi Buntoro (Buntoro, 2016)
analyzing sentiment analysis towards candidates of
Jakarta governor 2017 on twitter showed that the
highest accuracy values were obtained using Naïve
Bayes classifier, with an average accuracy of 95%.
This r e s u l t shows that Naïve Bayes method has
a high performance to classify Twitter documents.
Therefore, this study will analyze public sentiment
towards East Java Governor election 2018 on Twitter
using Naïve Bayes classifier. The result of this study
can be used to evaluate the strength of each candidate
on Twitter. This strength on Twitter was one of factor
that influence East Java Governor Election 2018.
2 LITERATURE REVIEW
2.1 Twitter
Twitter is a social network that is quite popular
among internet users (Zulfa & Winarko, 2017).
Twitter limits its users to send a tweet with a length
to 280 characters. Twitter has some similarities with
other social networking sites like Facebook, which is
useful for connecting internet users. Twitter was
founded by Jack Dorsey and officially launched in
March 2006. Twitter continues to grow rapidly in the
number of users. This is evidenced by the number of
users that reached 500 million users in January 2013
(Yulian, 2018). The advantage of Twitter, compared
to Facebook, is the ‘follow’ feature that makes it
easy for someone to connect with unlimited number
of friends. This is certainly better than
Facebook,
which limits friendship to only 5000 people.
2.2 Text Classification
Classification is the process of building a model that
will be used to predict a category (Juniawan, 2009).
Classification has two processes that are learning
process and classification process itself. In the first
process, the classification algorithm creates a
classification model by analyzing training data. This
process is called supervised learning because each
training data has its own class label. This process can
be assumed as mapping of function
. It
means that determining the class label is based on
data by mapping function . The second process is
to determine the class label for testing data using
classification model that has been created.
Classification of text documents is certainly
different from the classification of numerical data. In
the classification of text documents, the independent
variables are the words in the text document. This
causes the classification of text documents to have so
many independent variables, depending on the
number of words in the classified documents.
Classification of text documents is included in text
mining. The purpose of text mining is to get useful
information from text documents (Nurhuda, et al.,
2013).
2.3 Naïve Bayes Classifier
Naïve Bayes classifier is a machine learning method
that uses probability calculation (Rini, et al., 2016).
This method utilizes the probability theory found by
British scientist Thomas Bayes. Naïve Bayes
classifier is based on the Bayes theorem in Equations
1 and 2 below (Balagatabi, 2012):
|
∩
1
∩
|
∙
2
Where:
| is the probability of A if B has happened
∩
is probability of A that happens
together with B
is the probability of A
is the probability of B
This method works by predicting the
probability of future occurrences based on
previous data. The main characteristic of Naïve
Bayes classifier is the independence of each event
that has a very strong assumption, where it is
assumed that each data is independent (Rini, et al.,
2016). Naïve Bayes classifier is a probability
concept that can be used to determine class of text
Analysis of Public Sentiment towards East Java Governor Election 2018 on Twitter using Text Mining
263

documents and can process large amounts of data
with high accuracy result (Lestari, et al., 2017).
In classifying text documents, there are several
steps to do, that are:
1. Calculating the probability value of each
document category.
2. Calculating the probability value of each
word in each document category.
3. Determining the category of test
documents based on calculations from the
first step and the second step.
2.4 Text Pre-processing
Text pre-processing aims to prepare text documents
to be ready for classification (Faradhillah, et al.,
2016). This stage is important because the existing
text documents usually do not have a definite
structure so the information in the text cannot be
processed directly. In addition, not all words in the
text document reflect the contents contained in the
document. This stage is done before the text
document is classified with Naïve Bayes classifier
method. The pre-processing stage of the text includes
cleansing, case folding, stop word removal,
tokenization, and word weighting.
1. Cleansing
Cleansing is included in pre-process text.
Cleansing aims to delete all URL or web
address that do not have meaning in
documents classification (Mujilahwati,
2016). The URL and web address will
interfere the classification process if it is not
deleted.
2. Case Folding
In classifying documents, case folding is
a must-do. The way to do case folding is by
changing all letters to lowercase. The purpose
of case folding is to make the word at the
beginning of the sentence have the same
meaning as the word in the middle or in the
end of the sentence (Manning, et al., 2009). In
addition, punctuation and number are
replaced by the space character.
3. Stop word Removal
Usually, words that often appear in each
document category are meaningless words in
document categorization (Manning, et al.,
2009). These words are called stop word.
These words cannot be used as an identifier
of a document, so the words should be
deleted. Examples of stop words are
conjunctions and pronouns.
4. Tokenization
Tokenization is the process of dividing
text documents, that can be sentences or
paragraphs, into tokens or certain parts
(Manning, et al., 2009). The purpose of
tokenization is to make words in the sentence
of paragraph able to be weighted for each
word.
5. Word Weighting
In text mining, word weighting is
important step. It becomes features selection
to classify document category. Word
weighting methods that are often used are TF
and TF-IDF. TF (Term Frequency) is word
weighting method based on the appearance of
a word on particular document. TF-IDF stands
for Term Frequency–Inverse Document
Frequency. So, TF-IDF is a combination of
two weighting scheme namely TF and IDF
(Juniawan, 2009). Equation 3 is TF-IDF
calculation formula.
∙log
3
Where:
Wij = term i weight for document j
Kj = number of all terms in document j
TFij =number of term i appearance in document j
D = number of all documents in database
DFi = number of documents that contain term i
Weight of a word in TF method is
calculated based only on the frequency of a
word in a tweet. Meanwhile, weight of a word
in TF-IDF method is calculated based on the
frequency of a word in a tweet and also the
number of tweet that contains that word in all
database.
2.5 Evaluation of System Classification
A classification system is made with expectation that
the system can classify all data correctly (Prasetyo,
2014). However, it cannot be denied that a system
that has been built always has errors. Therefore, the
classification system needs evaluation to find out
how well a method is used to classify a particular data
or how well the classification system has been made.
The most commonly used classification system
evaluation is accuracy. Accuracy can be used to
measure the performance of a classification system if
the data used has balanced ratio of the number for
each data category (Prasetyo, 2014). However,
sometimes the accuracy value does not describe the
BEST ICON 2018 - Built Environment, Science and Technology International Conference 2018
264
actual performance of a classification system. This
can happen if the ratio of the number of each data
categories is very unbalanced (Prasetyo, 2014).
Therefore, another type of classification system
evaluation is used. The classification system is
namely precision, recall, and f-measure, which are
good enough to be used against proportionally
unbalanced data (Hotta, et al., 2013).
Accuracy is ratio of correctly classified data to the
total of data. It is the most simple performance
evaluation. Precision is ratio of correctly classified
positive data to the total of classified positive data.
Recall is ratio of correctly classified positive data to
all data that actually have positive class. Meanwhile,
F-Measure is weighted average of precision and recall
(Prasetyo, 2014).
3 RESEARCH METHOD
3.1 Data
The data used in this research is public opinion on
Twitter about East Java Governor candidates for
2018-2022 period that obtained from crawling
Twitter process in April 2018 until June 2018. In
crawling process, the first thing to do is determining
the keyword. For example, if the data searched is
an opinion about the first governor candidate, then
it can be crawled using the keyword “khofifah”. If
the data searched is an opinion about the second
governor candidate, it can be crawled with the
keyword “gus ipul”.
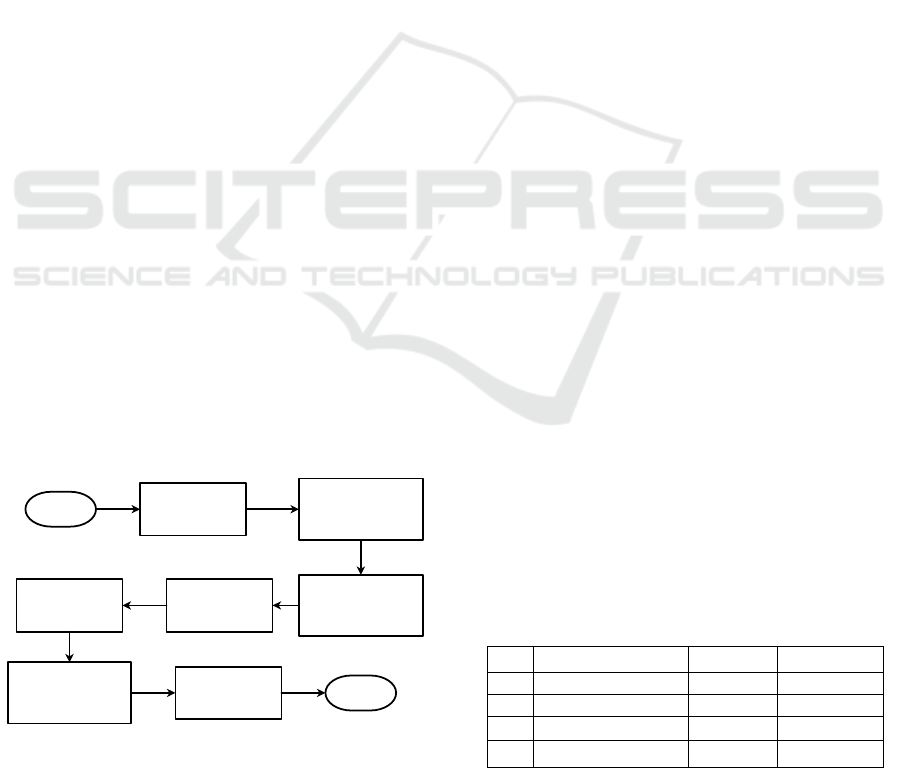
3.2 Data Analysis
To solve the problem in this research, there are
several steps to do such as in Figure 1.
Start
Crawling Twitter
Data
Data Labelling
(Positive, Negative,
Neutral and Outlier)
Data Deletion
(Neutral and Outlier)
Text Pre-
processing
Creating
Classification System
using Naive Bayes
Applying System Finish
Comparing TF
and TF-IDF
Figure 1: Research Flow Chart.
In this research, there were seven processes to
analyze data and get the results of sentiments
classification. The first process is collecting data by
crawling which is used to get opinion dataset on
Twitter. The second process is labelling data into
positive, negative, neutral, and outlier. The third
process is eliminating neutral and outlier data. The
fourth process is pre-text data processing. The
purpose of pre-processing is to convert raw datasets
into data that is ready to be classified. The fifth
process is comparing two word weighting methods,
TF and TF-IDF. Word weighting method with
better performance is used in the sixth process. The
sixth process is creating classification system using
Naive Bayes classifier method. The seventh process
is applying system to classify more data to obtain
predictions of the results of East Java Governor
election in 2018 based on public sentiment on
Twitter.
4 RESULTS AND DISCUSSION
4.1 Comparison between TF and TF-
IDF.
In this research, two word weighting methods were
used. The first word weighting method was TF. The
type of TF used was pure TF. Pure TF method is a
simple word weighting method because the weight of
each word is determined by the number of
occurrences of the word in a document.
The second word weighting method was TF-IDF.
TF-IDF is a development of TF method. After using
normalized pure TF, the weight is multiplied by the
IDF. The less often a word appears on set of
documents, the greater the IDF value is.
In this research, the TF weighting method had a
better performance than TF-IDF. For the first
governor candidate, TF and TF-IDF had the same
performance. The result of accuracy, precision,
recall, and f-measure were 98.99%, 93.44%, 97.78%,
and 95.56% respectively. Whereas for the second
governor candidate, TF was slightly better with
comparative performance as it is shown in Table 1:
Table 1: Comparison between TF and TF-IDF.
No Evaluation Type TF TF-IDF
1. Accuracy 98,.95% 98.25%
2. Precision 97.78% 97.32%
3. Recall 98.55% 96.57%
4. F-Measure 98.17% 96.95%
Analysis of Public Sentiment towards East Java Governor Election 2018 on Twitter using Text Mining
265

The result shows that TF was slightly superior to
TF-IDF, so the classification system was made using
the TF word weighting method.
4.2 Creating Classification System
After all existing words were weighted by pure TF,
the classification system was built using Naïve Bayes
classifier. Naïve Bayes classifier's work method is
based on the probability of the occurrence of words
that have been given weight by the TF word
weighting method.
Creating the classification system, the first step is
distributing training data and testing data. This step
cannot be done randomly because it will cause an
imbalance in the proportion of training data and
testing data. In addition, training data used must be
data that represents most of the available data, so that
the distribution of training and testing data cannot be
done randomly. The proportion of data distribution
that is often used is 80% for training data and 20%
for testing data. In addition, there is also a proportion
of 75% of training data and 25% of testing data. This
system used the proportion of 80% training data
and 20% testing data.
In the first system, the data used were 2497 data
which were distributed into training data and testing
data. Training data consisted of 2000 data which had
1906 positive-category data and 94 negative-
category data. M e a n while, the testing data consisted
of 497 data which had 469 positive-category data and
28 negative-category data.
In the second system, the data used were 1487
data which were distributed into training data and
testing data. Training data consisted of 1200 data
which had 1132 positive-category data and 68
negative-category data. M e a n while, the data testing
consisted of 287 data which had 238 positive-
category data and 49 negative-category data.
Table 2: Performance of Each Classification System.
No
Evaluation
Type
The First
System
The Second
System
1. Accuracy 98.99% 98.95%
2. Precision 93.44% 97.78%
3. Recall 97.78% 98.55%
4. F-Measure 95.56% 98.17%
Table 2 shows the performance of each
classification system using TF word weighting
method and proportion of 80% training data and 20%
testing data. It can be concluded that each
classification system has high performance with
values above 90%.
4.3 Results of System Application on
More Twitter Data
The two systems had good values (more than 90%) of
accuracy, precision, recall, and f-measure so that the
next step was to apply on more Twitter data to know
the tendency of public sentiment toward each
governor candidate. Table 3 shows the results of
system application for each data:
Table 3. Results of System Application.
No Data Positive Negative Total
1 First
candidate
(Khofifah
and Emil)
18521 1423 19944
2 Second
candidate
(Ipul and
Puti)
13714 2235 15949
Total 32235 3658 35893
In Table 3, it can be seen that the data used in
this study were 35893 data which were distributed
into two kinds of data, namely the first data for the
first governor candidate and the second data for the
second governor candidate. This data was obtained
from crawling Twitter data from April 2018 until
June 2018. Data for the first candidate were 19944
data and data for the second governor candidate were
15949 data
.
In data of the first governor candidate, there
were 92.86% positive sentiments and 7.13% negative
sentiments. While in data of the second governor
candidate, there were 85.98% positive sentiments and
14.01% negative sentiments.
Based on the combination of the first data and
the second data obtained from the Twitter crawling
process, it can be concluded that the first governor
candidate is superior to the second governor
candidate. This conclusion can be taken based on the
fact that the first governor candidate gets more
attention from Twitter users. The number of tweet
that mentioned the first governor candidate was
19944 tweets while the number of tweet that
mentioned the second governor candidate was 15949.
In addition,
the first governor candidate had greater
percentage of
positive sentiments than the second
governor candidate did and the first governor
candidate had smaller percentage of negative
sentiments than the second governor candidate did.
BEST ICON 2018 - Built Environment, Science and Technology International Conference 2018
266

This study contributes in creating classification
sentiment model regarding to East Java governor
election that can automatically and accurately
classify tweets by using Naïve Bayes and TF word
weighting method. The result of this study was based
only on social media, especially Twitter. It will be
even better if the result can be obtained from other
social media like Facebook, Instagram, or other
online media.
5 CONCLUSION
Based on the results of the classification system and
system application, it can be concluded t
hat
Naïve
Bayes classifier is a method that can be applied to
classify sentiments on Twitter. This was indicated by
the high performance of the system that was made. In
the first system, the system performance obtained
accuracy of 98.99%, precision of 93.44%, recall of
97.78%, and f-measure of 95.56%. Whereas in the
second system, system performance obtained
accuracy of 98.95%, precision of 97.78%, recall of
98.55%, and f-measure of 98,17%.
Based on data obtained from Twitter, Twitter
users tend to choose the first governor candidate,
Khofifah Indar Parawansa. This conclusion can be
taken based on the fact that the first governor
candidate gets more attention from Twitter users. In
addition, the percentage of
positive sentiments for
the first governor candidate was greater than that for
the second governor candidate and the percentage
of negative sentiments for the first governor
candidate was smaller than that for the second
governor candidate.
REFERENCES
Aggarwal, C. & Zhai, C., 2013. A Survey of Text
Classification Algorithm. pp. 169-170.
Balagatabi, Z. N., 2012. Comparison of Decision Tree and
Naive Bayes Methods in Classification of Researcher's
Cognitive Style in Academic Environment. Journal of
Advance in Computer Research, 3(2), pp. 23-24.
Buntoro, G. A., 2016. Analisis Sentimen Calon Gubernur
DKI Jakarta 2017 di Twitter. Integer Journal, pp. 32-
41.
Espinall, E. et al., 2017. Vote Buying in Indonesia:
Candidate Strategies, Market Logic and Effectiveness.
Journal of East Asian Studies, Volume 17, pp. 1-27.
Faradhillah, N. Y. A., Kusumawardani, R. P. & Hafidz, I.,
2016. Eksperimen Sistem Klasifikasi Analisa Sentimen
Twitter pada Akun Resmi Pemerintah Kota Surabaya
Berbasis Pembelajaran Mesin. Surabaya, SESINDO.
Hotta, H. S., Shrivas, A. K. & Singhai, S. K., 2013.
Artificial Neural Network, Decision Tree and Statistical
Techniques Applied for Designing and Developing E-
mail Classifier. International Journal of Recent
Technology and Engineering, 1(6), pp. 164-169.
Juniawan, I., 2009. Klasifikasi Dokumen Teks Berbahasa
Indonesia Menggunakan Minor Component Analysis,
Bogor: Institut Pertanian Bogor.
Kusen, E. & Strembeck, M., 2018. Politics, sentiments, and
misinformation: An analysis of the Twitter discussion
on the 2016 Austrian Presidential Election. Online
Social Network and Media, Volume 5, pp. 37-50.
Lestari, A. R. T., Perdana, R. S. & Fauzi, M. A., 2017.
Analisis Sentimen Tentang Opini Pilkada DKI 2017
Pada Dokumen Twitter Berbahasa Indonesia
Menggunakan Naive Bayes dan Pembobotan Emoji.
Jurnal Pengembangan Teknologi Informasi dan Ilmu
Komputer, Desember, 1(12), pp. 1718-1724.
Liu, B., 2012. Sentiment Analysis and Opinion Mining. 1st
ed. s.l.:Morgan & Claypool Publishers.
Manning, C. D., Raghavan, P. & Schutze, H., 2009. An
Introduction to Information Retrieval. Cambridge:
Cambridge University Press.
Mujilahwati, S., 2016. Pre-processing Text Mining pada
Data Twitter. Yogyakarta, SENTIKA.
Nurhuda, F., Sihwi, S. W. & Doewes, A., 2013. Analisis
Sentimen Masyarakat terhadap Calon Presiden
Indonesia 2014 berdasarkan Opini dari Twitter
Menggunakan Metode Naive Bayes Classifier.
JURNAL ITSMART, 2(2), pp. 35-42.
Prasetyo, E., 2014. DATA MINING Mengolah Data
Menjadi Informasi Menggunakan Matlab. Yogyakarta:
ANDI.
Rini, D. C., Farida, Y. & Puspitasari, D., 2016. Klasifikasi
Menggunakan Metode Hybrid Bayessian-Neural
Network (Studi Kasus: Identifikasi Virus Komputer).
JURNAL MATEMATIKA "MANTIK", 01(02), pp. 38-
43.
Wongso, R. et al., 2017. News Article Text Classification
in Indonesian Language. Procedia Computer Science,
Issue 116, pp. 137-143.
Yaqub, U., Chun, S. A., Atluri, V. & Vaidya, J., 2017.
Analysis of political discourse on twitter in the context
of the 2016 US presidential elections. Governor
Information Quarterly, pp. 1-14.
Yulian, E., 2018. Text Mining dengan K-Means Clustering
pada Tema LGBT dalam Arsip Tweet Masyarakat Kota
Bandung.
JURNAL MATEMATIKA "MANTIK", pp. 53-
58.
Zulfa, I. & Winarko, E., 2017. Sentimen Analisis Tweet
Berbahasa Indonesia dengan Deep Belief Network.
IJCCS, 11(2), pp. 187-198.
Analysis of Public Sentiment towards East Java Governor Election 2018 on Twitter using Text Mining
267
