
Pollutant Load and Assimilation Capacity in Martapura River,
South Kalimantan, Indonesia
Tien Zubaidah
1,2
, Nieke Karnaningroem
1
, and Agus Slamet
1
1
Enviromental Engineering Department, Institut Teknologi Sepuluh Nopember, Surabaya, Indonesia
2
Enviromental Health Department, Politeknik Kesehatan Banjarmasin, Banjar Baru, Indonesia
Keywords: pollutant load, assimilation capacity, martapura river
Abstract: Rivers always have multifunctional role that is vital for drinking water needs. Until now the Martapura River
has been used for various types of activities such as domestic households, tourism, fisheries, agriculture to
the industry which all cause the quality of water to decrease. This study aims to calculate the pollution load
and assimilation capacity by calculating the BOD, COD and TSS parameters analysed using linear regression.
The results of parameter analysis of BOD, COD and TSS have shown that under the conditions of the current
pollutant load and its assimilating capacity, the Martapura River water cannot carry out the refining process
itself.
1 INTRODUCTION
The function of the river becomes very important
because of its role as a transportation facility,
community water source, fisheries, agricultural
interests, and as a maintainer of natural hydrological
conditions. However, even with those vital functions,
the river as a final waste disposal site is still
commonly encountered throughout Indonesia. Back
then, the waste produced by human activities that was
discharged into waterways did not become a severe
problem because the river had sufficient assimilation
capacity to accommodate the waste in the body river.
However, as the river bank population grows, the
declining assimilation capacity of river water against
waste has become an important issue that must be
carefully considered.
Currently, a hundred and two rivers have
traversed the city of Banjarmasin, consisting of fifty-
four creeks, forty-five average rivers and three large
rivers, with the Barito river becomes the largest river
in the area. With the Barito River estuary area reaches
more than 2 kilometres per square and 900 km long,
it makes it the most important waterway for water
environment conditions in Banjarmasin City (South
Kalimantan Province Environmental Agency, 2017).
The declining quality of river water in the city of
Banjarmasin has been caused mainly by the random
domestic waste disposal into the river bodies
(Normelani, 2003), followed by poor urban sanitation
patterns and unhygienic behaviour among riverbank
communities (Normasari, 2016).
Data from the Directorate of Water Pollution
Control also shows that the most significant
contribution of waste (range 58.31 to 94.16 per cent)
comes from domestic waste and this waste tends to
increase every year (Ministry of Environment and
Forestry, 2017). With those conditions, this study
aimed to investigate domestic pollutant loads and
river assimilation capacity in Banjarmasin City.
2 RESEARCH METHOD
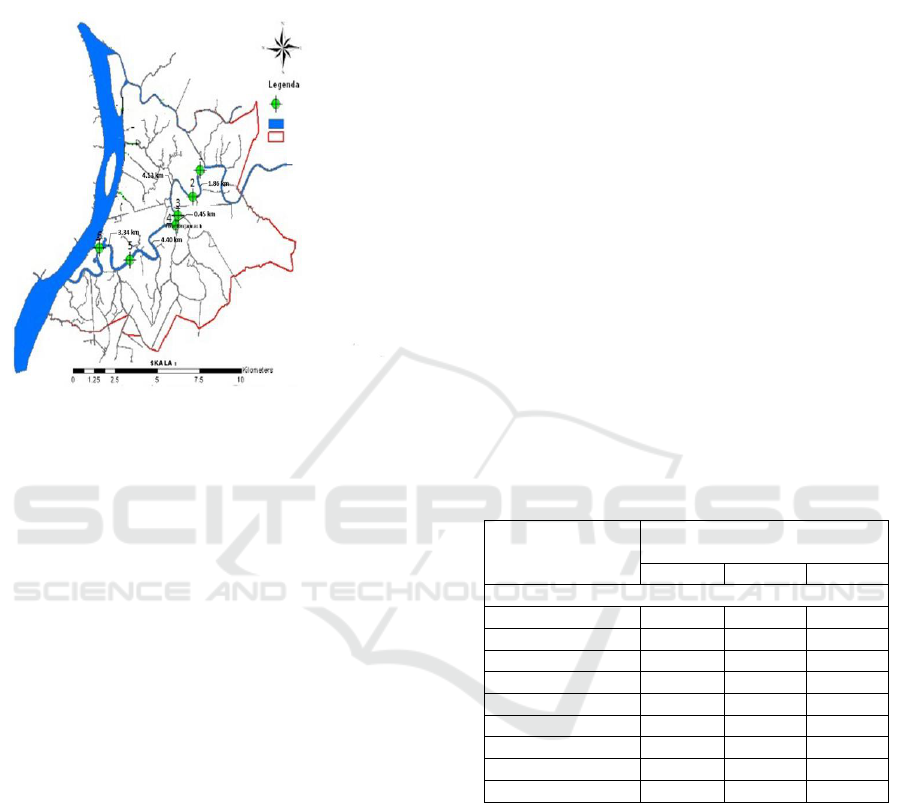
Sampling and measurement of water samples were
carried out three times in September 2018 in the
Martapura River, Banjarmasin City, South
Kalimantan (figure 1). Observations and analyses
were carried out in situ and ex-situ where ex situ study
was carried out at the Banjarmasin City
Environmental Laboratory. Total pollutant load per
time was used to express the pollutant load.
According to Tebbut (1997), by multiplying the
concentration and flow rate of the river, we can
calculate the pollutant load value. For the capacity of
assimilation, the amount is obtained by processing the
226
Zubaidah, T., Karnaningroem, N. and Slamet, A.
Pollutant Load and Assimilation Capacity in Martapura River, South Kalimantan, Indonesia.
DOI: 10.5220/0008908900002481
In Proceedings of the Built Environment, Science and Technology International Conference (BEST ICON 2018), pages 226-229
ISBN: 978-989-758-414-5
Copyright
c
2022 by SCITEPRESS – Science and Technology Publications, Lda. All rights reserved
correlation graph between the concentration of each
waste parameter in the river with the pollutant load of
the setting itself and then analysed by connecting it
with the water quality standard line.
Figure 1: Sampling station point in the Martapura River,
South Kalimantan.
Regression analysis is used as an auxiliary method
to determine intersection lines between pollutant
loads and the quality standards required for each
parameter. Pollution load parameters are used as
independent variables and pollutant concentration
parameters are used as dependent variables. Thus, the
pollution variables in the inlet can be mathematically
written as follows.
Y= a +bx
(1)
remarks :
y = Pollution concentration parameters
x = Pollutant load parameter value
a = Intersection with upright axis (middle / general
average)
b = slope/gradient (regression coefficient for
parameters)
The pollutant load value of a certain parameter
became the X variable while the parameter
concentration value became the Y variable. A simple
linear regression equation was used to answer
whether the concentration of a parameter was affected
by the parameter’s pollutant load itself. The simple
linear regression equation assumes that all pollutants
from the land will flow into the river. The more the
pollutant load enters the river, the higher the
concentration in the water will be. Furthermore, the
assimilation capacity value only applies to the area
specified in the study.
3 RESULT AND DISCUSSION
Hydrologically, the city of Banjarmasin is surrounded
by large rivers and their branches, flowing from the
north and the northeast to the southwest and the south,
and forming a dendritic drainage pattern. The
Martapura River that flows across the centre of the
city is located in densely populated residential areas
with various industrial and domestic activities. This
condition directly contributes to the decreasing
quality of the Martapura River’s water. We will
further discuss the Martapura River’s potential
pollution loads and its assimilation capacity.
3.1 Martapura River’s Potential
Pollution Load
The magnitude of the Martapura River's potential
pollution load sourced from domestic waste has been
summarised in Table 1 below:
Table 1: Martapura River’s Potential Pollution Load
Resume
Domestic
pollutant sources
Pollutant load potential
(kg/day)
BOD
COD
TSS
Non-point source
a.household waste
1137.45
1409.45
939.63
b. hotel waste
921.91
1267.63
875.81
c. restaurant waste
25.43
38.15
22.84
d. market waste
307.05
380.48
253.65
e. school waste
112.33
139.19
92.80
f. hospital waste
12.3
16.91
11.69
g. office waste
32.71
40.53
27,02
Point source
129,18
-
152.00
Total
2678.36
3292.34
2375.44
Based on Table 1, it can be seen that waste
originated from households provides the most
significant contribution as an indoor pollutant
primary source. A poorly managed household waste
was resulting in river highly polluted by domestic
waste. These results are in line with the research by
Palamuleni (2002) which has stated that the primary
pollutant of water is the habit of dumping domestic
waste massively as well as the lack of municipal
sanitation facilities. The burden of river water
pollution will continue to increase along with the
development of population demographics in a region,
synergising with economic growth and industry
Sampling station points
Rivers line
Banjarmasin
administrative border
Pollutant Load and Assimilation Capacity in Martapura River, South Kalimantan, Indonesia
227
(Goel, 2006), and this also applies to the city of
Banjarmasin.
3.2 The Martapura River’s
Assimilation Capacity
An indirect approach was taken to determine the
assimilation capacity of the Martapura River, which
is by linking water quality and its waste load. If the
pollutant concentration is above the intersection line
of the regression and the quality standard
concentration line, it means that the pollutant load has
exceeded the river's ability to clean itself. This
condition causes polluted rivers. On the other hand, if
the pollutant concentration is below the intersection
line of the regression and the quality standard
concentration line, it means that pollutants are still
undergoing a self-purification process. This condition
reflects the river in a non-polluted situation.
Table 2 shows the regression results for BOD,
COD and TSS parameters to obtain assimilation
capacity values. The function Y has shown the
average quality of the Martapura River’s waters from
upstream (Jingah River) to the downstream (Barito
River), in the dry season of 2018.
Table 2: The relationship function for river pollution and
river quality at the upstream, midstream, and downstream.
Para
meters
Y function
Qualit
y Std
(mg/L)
Asimilatio
n capacity
(kg/day)
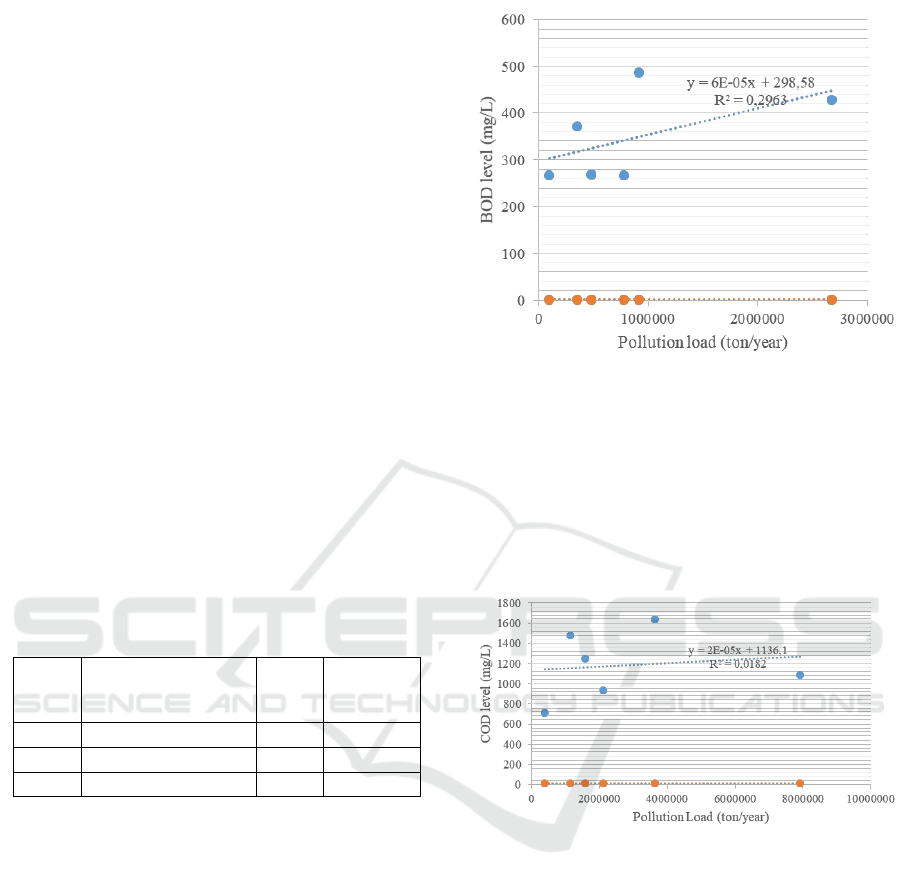
BOD
Y=6E-05x + 298,58
2
817.47
COD
Y=2E-05x + 1136,10
10
3110.47
TSS
Y=8E-08x + 178,21
50
487.89
Assimilation capacity is the limit of river pollutant
load which can still be cleaned naturally through
physical, chemical and biological events. From Table
2, the COD assimilation capacity value is 3110.47
kg/day, which is the maximum limit for pollutant
loads that can still be accommodated by the river until
the river conditions are not entirely polluted. In figure
2, we can see a graph of the relationship between the
total BOD pollutant load and the water quality
downstream for the BOD parameter.
Figure 2: Regression analysis for BOD pollutant load and
BOD level on the Martapura River.
In Figure 1, it can be seen that the river pollution
load for the BOD parameter has exceeded the
standard quality limit. This indicates the pollution
load for the BOD parameter exceeds its assimilation
capacity (817.47 kg/day). It can also be said that the
river has experienced pollution.
Figure 3: Regression analysis for COD pollutant load and
COD level on the Martapura River.
Figure 3 shows that the river pollution load for
COD parameters has exceeded the quality standard
line. This condition indicates that the pollution load
for the COD parameter exceeds its assimilation
capacity, or in other words, the river has been
categorised as polluted.
BEST ICON 2018 - Built Environment, Science and Technology International Conference 2018
228

Figure 3: Regression analysis for TSS pollutant load and
TSS level on the Martapura River.
Based on Figure 3, it can be seen that from 6
observation points, all of them are above the
assimilation line capacity of the TSS parameter
(487.89 kg/day). This means that the pollutant load
value is higher than the assimilation capacity value
and causes the river to be polluted.
4 CONCLUSIONS
All parameters studied at the observation point (BOD.
COD and TSS) have exceeded assimilation capacity.
The assimilation capacity of the Martapura River is
strongly influenced by the burden of river pollutants
originated from domestic waste, especially household
waste. Synergistic intervention is needed to reduce
the potential of pollutant load and at the same time, to
increase the assimilation capacity of the Martapura
River.
REFERENCES
Goel, P.K., 2006. Water Pollution: Causes, Effects and
Control. New Age International.
Longe, E.O., Omole, D.O., 2008. Analysis of the pollution
status of River Illo, Ota, Nigeria. The
Environmentalist 28, 451–457.
https://doi.org/10.1007/s10669-008-9166-4
Ministry of Environment and Forestry, 2017. Policy and
Implementation of Water Quality Management and
Pollution Control. Ministry of Environment and
Forestry, Jakarta.
Normasari, E.R., 2016. Martapura River’s Pollution
Control Model in Banjarmasin City (Doctoral
Disertation). Universitas Sebelas Maret, Surakarta.
Normelani, E., 2003. Evaluation of Martapura River water
quality for PDAM’s raw material as community
drinking water in Banjar Barat sub-district,
Banjarmasin City, South Kalimantan Province
(Thesis). State Unversity of Malang, Malang.
Nurisjah, S., Anisa, L., 2011. Lanskap Planning for
Riparian Martapura River to Improve The Quality of
Natural Environment in Banjarmasin City. J. Lanskap
Indones. 3. https://doi.org/10.29244/jli.2011.3.1.%p
Palamuleni, L.G., 2002. Effect of sanitation facilities,
domestic solid waste disposal and hygiene practices
on water quality in Malawi’s urban poor areas: a case
study of South Lunzu Township in the city of
Blantyre. Phys. Chem. Earth Parts ABC 27, 845–850.
https://doi.org/10.1016/S1474-7065(02)00079-7
South Kalimantan Province Environmental Agency, 2017.
2016 South Kalimantan Province Water Quality
Monitoring Report. South Kalimantan Province
Environmental Agency, Banjarmasin.
Tebbutt, T.H.Y., 1997. Principles of Water Quality Control.
Elsevier
Pollutant Load and Assimilation Capacity in Martapura River, South Kalimantan, Indonesia
229
