
The Modified Oral Minimal Model to Know Incretin Hormone
Effect in Type 2 Diabetes Mellitus
Agus Kartono, Rojali Fadila, Heryanto Syafutra, Setyanto Tri Wahyudi, and Tony Sumaryada
1
Department of Physics, Faculty of Mathematical and Natural Sciences, Bogor Agricultural University (IPB)
Keywords: Incretin hormone, Insulin, Oral minimal model, Simulation, Type 2 diabetes,
Abstract: Simulation of glucose, insulin and incretin hormones concentrations in the blood is described using the
modified oral minimal model that can be learned easily. In this study, the modified oral minimal model can
also describe the kinetics of incretin hormone concentration to determine the level of insulin secretion in the
body. Incretin hormone has been recognized as a major stimulus for insulin secretion after an oral glucose
load. Based on the results of this study, subjects with type 2 diabetes have the smallest of incretin hormone
concentration (115 ng/dL). The normal subjects have the highest of incretin hormone concentration (300
ng/dL). The simulations which have been done show that the deterministic coefficient (R
2
) value of each
simulation has reached above 90%, meaning that all the simulations results are good.
1 INTRODUCTION
When glucose is infused intravenously, insulin
secretion is stimulated much less than it is when
glucose is taken orally so as to result in similar
glucose concentrations. The incretin hormones
function has the key physiological impact on glucose
homeostasis after oral glucose. The secretion of
insulin after ingestion of glucose compared to the
isoglycemic intravenous glucose challenges is called
the incretin effect. This effect is estimated to be
responsible for 50 to 70% of the insulin response to
glucose. Glucagon-like peptide-1 (GLP-1) and
glucose-dependent insulinotropic polypeptide (GIP)
are the two intestinal insulin-stimulating hormones
caused mainly the incretin effect. Incretins are
peptide hormones that originate in the gut and
increase the effectiveness of insulin secretion after
glucose ingestion in a glucose-dependent manner.
GLP-1 and GIP are the two dominant incretin
hormones. They play an essential role in maintaining
normal glucose homeostasis and in particular
postprandial glucose levels (Tura et al. 2014; Kaur
& Gautam 2006; Vilsbøll & Holst 2004; Ahren
2011).
In subjects with type 2 diabetes mellitus
(T2DM), the incretin effect is either greatly impaired
or absent, and it is assumed that this could contribute
to the inability of these subjects to adjust their
insulin secretion to their needs. In studies of the
mechanism of the impaired incretin effect in T2DM
subjects, it has been found that the secretion of GIP
is generally normal, whereas the secretion of GLP-1
is reduced, presumably as a consequence of the
diabetic state. It might be of even greater importance
that the effect of GLP-1 is preserved whereas the
effect of GIP is severely impaired (Michaliszyn et al.
2014).
Two types of minimal model for the glucose and
insulin dynamics and incretin effect have been
developed according to the different routes of
glucose administration: intravenous glucose
tolerance test (IVGTT) and oral glucose tolerance
test (OGTT). The IVGTT-based minimal model
consists of glucose and insulin subsystems, where
insulin in the plasma compartment passes the en-
dothelium and enters a remote interstitial
compartment to exert insulin action. However, the
intravenous administration of glucose is far from the
physiologic way of glucose intaking, which
necessitates further improvement of the model by
incorporating the physiology of oral glucose intake.
The most common oral administration test, the
standard method to determine glucose tolerance
status, is the oral glucose tolerance test (OGTT).
This test is vital for the characterization of the
metabolic syndrome and natural progression from
normal glucose tolerance (NGT) to prediabetes
(impaired glucose tolerance (NGT)) to T2DM. The
280
Kartono, A., Fadila, R., Syafutra, H., Wahyudi, S. and Sumaryada, T.
The Modified Oral Minimal Model to Know Incretin Hormone Effect in Type 2 Diabetes Mellitus.
DOI: 10.5220/0009009802800286
In Proceedings of the 7th Engineering International Conference on Education, Concept and Application on Green Technology (EIC 2018), pages 280-286
ISBN: 978-989-758-411-4
Copyright
c
2020 by SCITEPRESS – Science and Technology Publications, Lda. All rights reserved

OGTT-based minimal model, is commonly called
the oral minimal model, can be easily applied to
examine the dynamic physiology of glucose
homeostasis. The oral minimal model can also be
readily adapted to various situations by modifying
its structure (Lim et al. 2016; De Gaetano et al.
2013).
The OGTT test is characterized by uncertainty
both in the amount of glucose absorbed and in its
absorption rate, which results in the time course of
exogenous glucose delivery to plasma. In the
OGTT-based minimal model, the time course of the
rate of appearance (R
a
) of exogenous glucose in
plasma cannot be specified a priori. Given the
ingested dose, indeed, several factors contribute
toward affecting the R
a
: the rate of gastric emptying
of ingested glucose, the extent of intestinal
absorption during the intestinal transit, and the
hepatic uptake of portal glucose. Because of these
uncertainties, the R
a
time course in the OGTT test
has been represented by a piecewise linear function,
with the time of breakpoints assigned and values that
are estimated from the data. The rate of gastric
emptying and the small intestine transit time appear
to be the main factors in determining the glucose R
a
profile (Salinari et al. 2011; Wilbaux et al. 2017).
Mathematical models of the glucose and insulin
dynamics have been used to represent the rela-
tionship mainly between glucose and insulin. The
glucose profiles during OGTTs are difficult to
predict due to highly variable factors such as the rate
of glucose absorption from the intestine and the
temporal delay of insulin action. Furthermore, the
incretin hormones have been recognized as a major
insulin secretory stimulus after an oral glucose load.
In the present model, the modified oral minimal
model that includes the incretin effect has been
developed to describe the glucose, insulin and
incretin hormone dynamics during the OGTT [Kim
et al. 2014; Brubaker et al. 2007; Seike et al. 2011).
This research introduced a modified oral minimal
model based on the incretin mechanisms for
investigating the incretin hormones. This study was
performed in healthy and subjects with T2DM that
the glucose excursion is very similar after ingestion
of 75 g due to an increase in the incretin effect
matching the increased glucose load.
2 MATERIALS AND METHODS
2.1 The Oral Minimal Model
The classic single-compartment IVGTT-based
minimal model was first introduced by Bergmann
and co-author. Minimal model is a one compartment
model, which means that the body is described as a
compartment with a basal concentration of glucose
and insulin. This model contains two minimal
models. The first model describes glucose kinetics,
how blood glucose concentration reacts to blood
insulin concentration and the second model
describes the insulin kinetics, how blood insulin
concentration reacts to blood glucose concentration.
However, the IVGTT used to obtain parameters in
this model is invasive and requires considerable
cooperation on the part of the patient [Bergman et al.
1981; Bergman et al. 1979; Kartono 2013).
The OGTT is a much simpler procedure to
perform, with both decreased invasiveness and
reduced burden on the patient. The OGTT tests are
thus routinely performed in clinical laboratories to
diagnose prediabetes (IGT) to T2DM. The OGTT-
based minimal model is commonly called oral
glucose minimal model resembles the IVGTT-based
minimal model but has a new element, the
gastrointestinal tract, which has as input the oral
dose.
The oral glucose minimal model has two
ordinary differential equations that represent the
changes in plasma glucose and insulin concentra-
tions. Variables and Parameters Of Oral Minimal
Model shows in Table 1. The general model
equations are described as follows (Cobelli et al.
2014):
V
tR
GptGtXp
dt
tdG
b
11
, (1)
00
GtG
,
b
ItIptXp
dt
tdX
32
, (2)
0
0
tX
,
,0
,
1
1
1
1 i
ii
ii
i
tt
tt
tR
(3)
others
ittt
ii
8,...,1,
1
.
The Modified Oral Minimal Model to Know Incretin Hormone Effect in Type 2 Diabetes Mellitus
281
Table 1: Variables and Parameters Of Oral Minimal Model.
Symbol
Unit
Notes
G(t)
mg/dL
glucose concentration when t after given input glucose by orally
I(t)
μU/mL
insulin concentration when t after input glucose is given orally
X(t)
min
-1
insulin action gives back glucose concentration to basal level when t
after given input glucose orally
G
b
mg/dL
basal glucose concentration before given input glucose orally
I
b
μU/mL
basal insulin concentration before input glucose given orally
G
0
mg/dL
theoretic glucose concentration in plasma when t equals zero which is
soon after input glucose is given orally
I
0
μU/mL
theoretic insulin concentration in plasma when t equals zero, more than
I
b
, is soon after input glucose is given orally.
p
1
min
-1
S
G
is effectivity of glucose, which is glucose absorption without insulin
in tissue.
p
2
min
-1
constant of increment of glucose absorption ability, in other words, the
fraction of the velocity of insulin which shows in interstitial plasma
p
3
min
-2
(μU/mL)
-1
improving the ability of glucose-dependent insulin absorption in tissue
per unit insulin concentration above basal insulin, in other words,
cleaning fraction insulin from interstitial compartment
R
α
(t)
mg. kg
-1
min
-1
the rate of input endogen glucose to the systemic circulation
V
dL/kg
the volume of distribution of glucose
α
i
mg. kg
-1
min
-1
the amplitude of glucose absorption
t
i
min
time of glucose absorption
The rate of plasma insulin secretion
concentration (dI/dt) is represented by the pancreatic
insulin secretion R
I
can be described as the sum of
two components: dynamic insulin secretion (R
I1
) and
static insulin secretion (R
I2
). The insulin circulation
rate of a single-compartment model with a rate
parameter p
I1
(min
-1
) for insulin disappearance is
defined by the following equation:
21 III
RRR
, (4)
, (5)
The secretion of rapidly releasable insulin stored
in β-cells in response to elevations in the glucose
level is represented by the parameter R
I1
(µU mL
-1
min
-1
) can be written as follow:
if, (6)
where the sensitivity of dynamic insulin
secretion by the β-cells is described by the parameter
p
I2
(µU mL
-1
mg
-1
dL). The secretion of newly
recruited insulin in response to an elevated glucose
level is represented by the parameter R
I2
can be
written as follow:
if (7)
The sensitivity of static insulin secretion by β-
cells to an elevated glucose level with a time
constant parameter p
I3
(min) is described by the
parameter p
I4
(µU mL
-1
mg
-1
dL min
-1
).
2.2 The Modified Oral Minimal Model
2.2.1 The Incretin Hormones Model
The GLP-1 hormone is produced by L cell which is
available in ileum and colon, while GIP hormone is
produced by K cell in duodenum tract and jejunum.
Secretion of these hormones can increase quickly
after subjects consume food which contains
carbohydrate and lipid. Carbohydrate and lipid can
stimulate the secretion of incretin hormones. The
GLP-1 hormone can stimulate β-cells in the pancreas
to produce insulin and directly inhibit glucagon
secretion, so that blood glucose level decreased.
To design the incretin hormones model, it is
needed to know how glucose enters the body.
Glucose entry into the body during OGTT involves
two main compartments. These compartments are
the gastrointestinal (GI) tract and mesenteric
circulation. In the GI tract, liquid glucose is very
IbI
RItIp
dt
tdI
1
0
2
1
dt
tdG
p
R
I
I
0
0
dt
tdG
dt
tdG
2
3
42
3
2
1
1
I
I
bII
I
I
R
p
GtGpR
p
R
b
b
GtG
GtG
EIC 2018 - The 7th Engineering International Conference (EIC), Engineering International Conference on Education, Concept and
Application on Green Technology
282

rapidly emptied from the stomach into the
duodenum. The equation to describe the rate of
delivery of glucose to the duodenum the duodenum
(Duod
G
) with a 75 g load OGTT is described by:
0
,0307.01014.5
0
G
Duod
g
g
tt
tt
t
75max
75max
5
5
. (8)
where t
max100g
= 166.1 min, t is time since the
start of the simulation, and t
max
is the t-intercept of
the straight lines. The OGTT simulations began after
5 min of basal metabolism; that t
max
is used only to
refer to the intercepts of these curves and nowhere
else in the model; and that these straight lines are
simple mathematical descriptions of experimentally
measured glucose delivery rates (mmol min
-1
).
Duodenal delivery rates cannot be negative.
Furthermore, when the units are converted from
mmol back to grams:
27.414
1.166
5
dtDuod
G
mmol = 74.58 g, (9)
thus retrieving the ingested doses of glucose.
Duod
G
is used subsequently to determine the rate of
release of incretins
These equations determine the rate of secretion
of incretin hormones and the rate of absorption of
glucose into mesenteric circulation. There is an
additional ordinary differential equation to describe
more about incretin concentration which is written
below:
tInckDuodk
V
Ra
dt
tdInc
G
Inc
65
, (10)
where
bInc
VInckRa
6
and basal plasma levels of
incretins (Inc
b
) were 200 ng/dL. The equations
above describe the concentration of incretin
hormones is based on GIP concentration during the
OGTT. Ra
Inc
is the basal rate of appearance of the
incretin, Inc
b
is the basal concentration determined
by the average fasting total GIP of all subjects and k
6
is the degradation which gives effect to the rate of
incretin hormones concentration. Parameter k
5
is the
rate of appearance of incretin due to Duod
G
2.2.2 Modified Insulin Secretion Model
The equation of insulin concentration kinetics in this
present model is from Brubaker and co-authors
which has some absorption parameters (Brubaker et
al. 2007). These absorption parameters give effect to
insulin kinetics in the body. The equation from
Brubaker and co-authors is modified by adding
constant R
I
from Seike et al. (2011). These are the
modified equations which describe insulin secretion
in pancreas and rate of insulin concentration:
I
RtIktIncktGk
dt
tdI
987
, (11)
0
1
42
3
2
bIIb
I
I
GtGpRInc
p
R
if
0
0
tG
tG
(12)
Parameter k
7
is the rate of appearance of insulin
due to G(t), k
8
is the rate of appearance of I(t) due to
Inc(t), k
9
is the measure of degradation/clearance of I
and β is effects of additional regulators of I(t) on
insulin appearance.
3 RESULTS AND DISCUSSION
The simulation of the modified oral minimal
model is made using the Matlab language
programming. It is needed to simplify the numerical
calculation and simplify to make the graphic of the
glucose, insulin, and incretin hormones
concentration. Numerical analysis is also needed to
be done because it is very difficult to solve these
analytical equations. In this research, the
mathematical model used is the ordinary differential
equation (ODE). Since this research using ODE, the
most accurate numerical method is Runge-Kutta 45
or ode45. Analysis deterministic coefficient (R
2
) is
needed to figure out the validation value between
data from the model to data from the experiment
which is formulated by:
N
i
ii
tyy
R
1
2
, (13)
N
i
i
yy
SST
1
, (14)
SST
X
R
2
2
1
, (15)
where y
i
is experiment data which contains deviation
standard σ, y(t
i
) is modeling data, N is the data and
y
is the average value of the sum from experimental
data and model data.
The Modified Oral Minimal Model to Know Incretin Hormone Effect in Type 2 Diabetes Mellitus
283
These data were taken from 120 Japanese
subjects who were listed at Tokyo University
Hospital, Japan.
The potential subjects (male and female) were at
age 40 to 65 years. All subjects were given 75 g
sampled OGTT. After all, subjects fasted for
approximately 10 hours, their venous sample blood
was taken at 0 min. These samples were taken to
measure glucose, insulin, and incretin hormones
concentration during 10, 20, 30, 60, 90, 120, 150,
180, 240 and 300 min (Møller 2012).
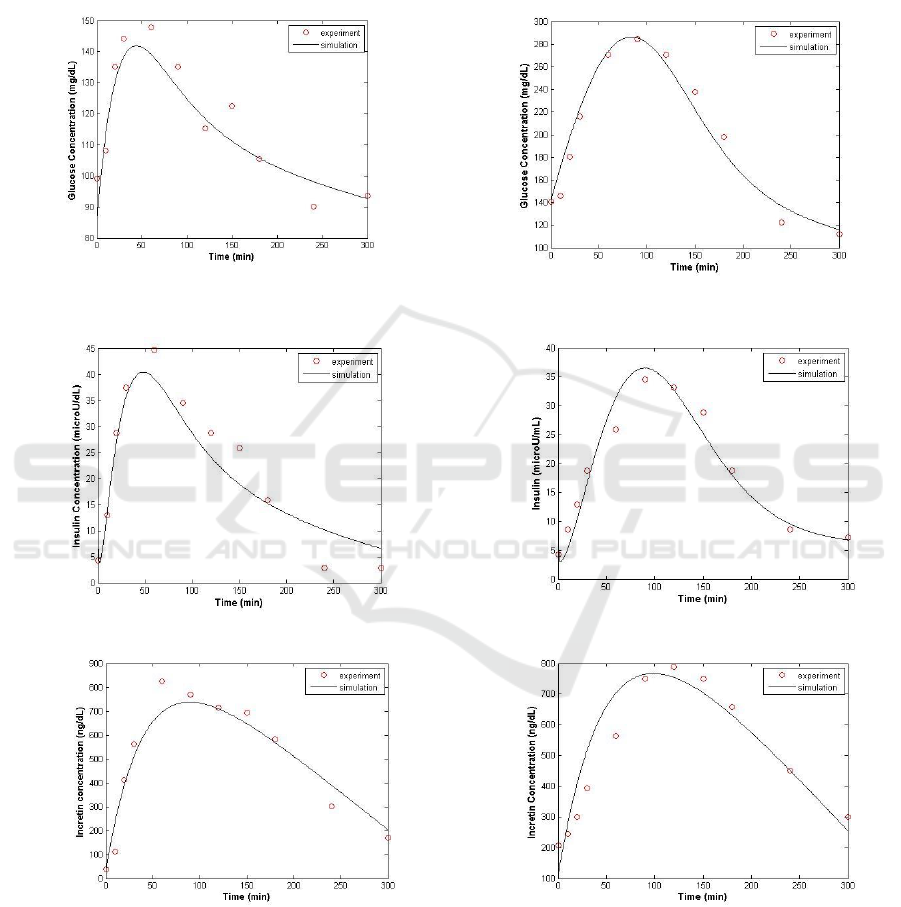
Normal Japanese subjects.
T2DM Japanese subjects.
Normal Japanese subjects.
T2DM Japanese subjects.
Normal Japanese subjects.
T2DM Japanese subjects.
Figure 1: Simulation results of the glucose, insulin and incretin hormone concentration of the normal and
T2DM Japanese subjects and the deterministic coefficient (R
2
) is = 91%.
EIC 2018 - The 7th Engineering International Conference (EIC), Engineering International Conference on Education, Concept and
Application on Green Technology
284

The simulation results of the modified oral minimal
model for glucose, insulin and incretin hormones
concentration of normal Japanese subject data show
good results. This can be proved by the deterministic
coefficient R
2
from the simulation. The results of
fitting data which is represented by R
2
value are
more than 90%. The parameter G
b
value is 85 mg/dl.
This value shows that right value for the normal
subject because according to statistics data, the G
b
value for the normal subject is 80-100 mg/dL. In the
rate of glucose concentration, as seen in Figure 1,
the glucose level slowly increased, then it decreased
after 60 min. In the normal subject, the ability of
insulin to accelerate the losing glucose from plasma
is good. As seen in Fig. 1, the rate of insulin
concentration increased until 60 min, after an oral
glucose load. This research also determined the
parameter basal incretin hormones Inc
b
. The
parameter Inc
b
value is 300 ng/dL, according to
statistical data for the normal subject, the Inc
b
value
is more than 200 ng/dl. This parameter value can be
concluded as the normal subject because it is more
than 200 ng/dL.
The simulation results of the modified oral
minimal model for glucose, insulin and incretin
hormones concentration of T2DM Japanese
subjects’ data show also good results. The
deterministic coefficient results of fitting data which
is represented by R
2
value is more than 90%. The
parameter G
b
value is 140 mg/dL. This value shows
that right value for the T2DM subject because,
according to statistics data, the G
b
value of the
T2DM subject is 130-150 mg/dL. In this simulation,
the G
b
value is even higher than the previous
simulation results of the normal subject. This results
can show that the absorption of glucose in the body
for normal subjects is the highest than the T2DM
subjects.
The parameter Inc
b
value of T2DM subjects is
115 ng/dL, according to statistical data for the
T2DM subject, the Inc
b
value is less than 200 ng/dL.
So, this parameter value can be determined as
T2DM subjects. This parameter Inc
b
can show that
the incretin hormones response is even slower than
the normal subject. The summary of values and units
for constants used in the present model shows in
Table 2. As seen from Figure 1, the rate of incretin
concentration slowly increased from 0-120 min,
after input glucose orally, that it increased by 150
min and kept decreasing until 300 min.
Table 2: Values and units for constants used in the present
model.
Constant
Value
Units
G
b
85-140
mg/dL
I
b
10-11
µU/dL
Inc
b
115-300
ng/dL
p
1
0.01-0.05
min
-1
p
2
0.002-0.005
min
-1
p
3
0.0015-0.0025
min
-1
k
5
2.5-3.0
ng dL
-1
mmol
-1
k
6
0.018-0.024
min
-1
k
7
0.009-0.03
mU min
-1
mmol
-
1.3
dL
-0.3
k
8
0.003-0.004
mU min
-1
ng
-1
k
9
1.3-1.6
min
-1
4 CONCLUSIONS
Kinematics of glucose, insulin and incretin
hormones concentration in the blood can be
described using a mathematical model. In this study,
the present model used is the modified oral minimal
model. Oral minimal model is modified to be able to
describe the rate of incretin hormones concentration
so that the level of secretion of insulin in the body
can be seen. Incretin hormones serve as a primary
stimulus of insulin secretion if there are incoming
glucose orally. The OGTT test data can show two
parameter values of the Incb and Gb from fit
between the present model and the OGTT
experimental results. Subjects with T2DM have the
highest basal glucose value parameter (G
b
), while
normal subjects have G
b
values lower than the
T2DM subject. Based on this study, subjects with
T2DM have an incretin hormone basal (Inc
b
)
parameter is the smallest (Inc
b
= 115 ng/dL). Normal
subjects have Inc
b
value exceeding 200 ng/dL.
ACKNOWLEDGEMENTS
This study was supported by grants from the
Direktorat Riset dan Pengabdian Masyarakat,
Direktorat Jenderal Penguatan Riset dan
Pengembangan, Kementerian Riset, Teknologi dan
Pendidikan Tinggi, Indonesia sesuai dengan Surat
Perjanjian Penugasan Pelaksanaan Program
Penelitian Nomor: 1624/IT3.11/PN/2018 tanggal 21
Februari 2018.
The Modified Oral Minimal Model to Know Incretin Hormone Effect in Type 2 Diabetes Mellitus
285

REFERENCES
Ahren B., 2011. The dynamic incretin adaptation and type
2 diabetes. The Journal of Clinical Endocrinology
and Metabolism, Vol 96(3), pp. 620–622.
Bergman R. N., Phillips L. S., Cobelli C., 1981.
Physiologic evaluation of factors controlling glucose
tolerance in man: measurement of insulin sensitivity
and beta-cell glucose sensitivity from the response to
intravenous glucose. The Journal of Clinical
Investigation, Vol 68, pp. 1456–1467.
Bergman R. N., Ider Y. Z., Bowden C. R., Cobelli C.,
1979. Quantitative estimation of insulin sensitivity.
American Journal of Physiology: Endocrinology and
Metabolism, Vol 236, pp. E667–E677.
Brubaker P. L., Ohayon E. L., D’Alessandro L. M.,
Norwich K. H., 2007. A Mathematical Model of the
Oral Glucose Tolerance Test Illustrating the Effects
of the Incretins. Annals of Biomedical Engineering,
35(7), pp. 1286–1300.
Cobelli C., Man C. D., Toffolo G., Basu R., Vella A.,
Rizza R., 2014. The Oral Minimal Model Method.
Diabetes, Vol 63, pp. 1203-1213.
De Gaetano A., Panunzi S., Matone A., Samson A.,
Vrbikova J., Bendlova B., Pacini G., 2013. Routine
OGTT: A Robust Model Including Incretin Effect
for Precise Identification of Insulin Sensitivity and
Secretion in a Single Individual. PLOS ONE, Vol
8(8), pp. 1-16.
Kartono A., 2013. Modified minimal model for effect of
physical exercise on insulin sensitivity and glucose
effectiveness in type 2 diabetes and healthy human.
Theory in Biosciences, Vol 132(3), pp. 195-206.
Kaur K., Gautam C.S., 2006. Development of new incretin
drugs: Promising therapies. The Indian Journal of
Pharmacology, Vol 38(2), pp. 100-106.
Kim M., Oh T. J., Lee J. C., Choi K., Kim M. Y., Kim H.
C., Cho Y. M., Kim S., 2014. Simulation of Oral
Glucose Tolerance Tests and the Corresponding
Isoglycemic Intravenous Glucose Infusion Studies
for Calculation of the Incretin Effect. Journal of
Korean Medical Science, Vol 29, pp. 378-385.
Lim M. H., Oh T. J., Choi K., Lee J. C., Cho Y. M., Kim
S., 2016. Application of the Oral Minimal Model to
Korean Subjects with Normal Glucose Tolerance
and Type 2 Diabetes Mellitus. Diabetes &
Metabolism Journal, Vol 40(4), pp. 308-317.
Michaliszyn S. F., Mari A., Lee S. J., Bacha F., Tfayli H.,
Farchoukh L., Ferrannini E., Arslanian S., 2014. β-
Cell Function, Incretin Effect, and Incretin
Hormones in Obese Youth Along the Span of
Glucose Tolerance from Normal to Prediabetes to
Type 2 Diabetes. Diabetes, Vol 63, pp. 3846–3855.
Møller J. B., 2012. Model-Based Analysis of Ethnic
Differences in Type 2 Diabetes. Ph.D. thesis,
Technical University of Denmark.
Salinari S., Bertuzzi A., Mingrone G., 2011. Intestinal
transit of a glucose bolus and incretin kinetics: a
mathematical model with application to the oral
glucose tolerance test. American Journal of
Physiology: Endocrinology and Metabolism, Vol
300, pp. E955–E965.
Seike M., Saitou T., Kouchi Y., Ohara T., Matsuhisa M.,
Sakaguchi K., Tomita K., Kosugi K., Kashiwagi A.,
Kasuga M., Tomita M., Naito Y., Nakajima H.,
2011. Computational assessment of insulin secretion
and insulin sensitivity from 2-h oral glucose
tolerance tests for clinical use for type 2 diabetes.
The Journal of Physiological Sciences,Vol 61, pp.
321–330.
Tura A., Muscelli E., Gastaldelli A., Ferrannini E., Mari
A., 2014. Altered pattern of the incretin effect as
assessed by modelling in individuals with glucose
tolerance ranging from normal to diabetic.
Diabetologia, Vol 57, pp. 1199–1203.
Vilsbøll T., Holst J. J., 2004. Incretins, insulin secretion
and Type 2 diabetes mellitus. Diabetologia, Vol 47,
pp. 357–366.
Wilbaux M., Wölnerhanssen B. K., Gerspach, C.
Beglinger A. C. M., Pfister M., 2017. Characterizing
the dynamic interaction among gastric emptying,
glucose absorption, and glycemic control in
nondiabetic obese adults. American Journal of
Physiology: Regulatory, Integrative and
Comparative Physiology, Vol 312, pp. R314–R323.
EIC 2018 - The 7th Engineering International Conference (EIC), Engineering International Conference on Education, Concept and
Application on Green Technology
286
